Short selling strategies risks and rewards phần 6 potx
Bạn đang xem bản rút gọn của tài liệu. Xem và tải ngay bản đầy đủ của tài liệu tại đây (596.57 KB, 44 trang )
202 THEORY AND EVIDENCE ON SHORT SELLING
tinuing survey conducted by the Yale School of Management, shows
that about 70% of those surveyed thought the market was overvalued in
early 2000. Remarkably, Exhibit 7.6 shows that simultaneously, 70% of
those surveyed also thought market would continue to go up. If every-
one agrees the market is overvalued, but expects it to continue to go up
amid high volume—this is the essence of the greater fool theory, and in
particular the Harrison and Kreps version.
Another fact explained by the overpricing hypothesis is the very
high level of stock issuance that occurred from 1998 to 2000. One inter-
pretation is that issuers and underwriters knew that stocks were over-
priced and so rushed to issue. Evidence arising out of subsequent legal
action against underwriters (such as emails sent by investment bank
employees) is certainly consistent with the hypothesis that the under-
writers thought the market was putting too high a value on new issues.
One way to think about issuance is as a mechanism for overcoming
short sale constraints. Both short selling and issuance have the effect of
increasing the amount of stock that the optimists can buy; both are
examples of supply increasing in response to high prices. Suppose you
think Lamont.com is overpriced in 1999. One way to take advantage of
this fact is to short the stock. In doing this, you are selling overpriced
EXHIBIT 7.6 The Percent of the Population Expecting an increase in the Dow in
the Coming Year.
7-Lamont-Short Constraints Page 202 Thursday, August 5, 2004 11:12 AM
Short Sale Constraints and Overpricing 203
shares to optimists. This action is very risky, however, as Lamont.com
might well double in price. A safer alternative action is for you to start a
new company that competes with Lamont.com, call it Lamont2.com,
and issue stock. This IPO is another way to sell overpriced shares to
optimists.
SUMMARY
The overpricing hypothesis says stocks can be overpriced when some-
thing constrains pessimists from shorting. In addition to short sale con-
straints, there also needs to be either irrational investors, or investors
with differences of opinion. This chapter has shown a variety of evi-
dence consistent with the overpricing hypothesis. First, I have discussed
three studies of extreme overpricing leading to extremely low subse-
quent returns. Second, I have discussed some suggestive evidence that
the tech stock mania period that peaked in March 2000 may also have
been overpricing due to the reluctance of pessimists to go short.
7-Lamont-Short Constraints Page 203 Thursday, August 5, 2004 11:12 AM
7-Lamont-Short Constraints Page 204 Thursday, August 5, 2004 11:12 AM
CHAPTER
8
205
How Short Selling Expands the
Investment Opportunity Set and
Improves Upon Potential
Portfolio Efficiency
Steven L. Jones, Ph.D.
Associate Professor of Finance
Indiana University, Kelley School of Business–Indianapolis
Glen Larsen, Ph.D., CFA
Professor of Finance
Indiana University, Kelley School of Business–Indianapolis
arry Markowitz’s seminal work on mean-variance portfolio optimi-
zation did not allow for short sales of risky securities.
1
Professional
money managers who use portfolio analysis have traditionally ignored
this opportunity as well, due either to institutional constraints or the
difficulties involved with short selling.
2
Yet, short selling clearly repre-
1
Harry M. Markowitz, “Portfolio Selection,” Journal of Finance (March 1952), pp.
77–91; and Harry M. Markowitz, Portfolio Selection: Efficient Diversification of In-
vestments (Somerset, NJ: John Wiley and Sons, 1959).
2
Harry M. Markowitz, “Nonnegative or Not Nonnegative: A Question about
CAPMs,” Journal of Finance (May 1983), pp. 283–295. Markowitz notes that his
assumption of no short selling is generally consistent with institutional practice. He
is particularly critical of portfolio optimization models that allow short sales but ig-
nore escrow and margin requirements and thus tend to give solutions with extreme
positive and negative weights that cannot be implemented in practice.
H
8-Jones/Larsen-ExpandInvest Page 205 Thursday, August 5, 2004 11:13 AM
206 THEORY AND EVIDENCE ON SHORT SELLING
sents an opportunity to expand upon the long-only investment set, and
there are several reasons to believe that this offers the potential to
improve upon realized (ex post) mean-variance portfolio efficiency.
First, as several of this book’s chapters point out, there is considerable
evidence of transitory overpricing in stocks that are expensive to short sell
as well as in stocks with high short interest. Thus, short selling such stocks,
when they are thought to overpriced, has the potential to improve upon
mean portfolio returns. Second, the opportunity to short sell effectively
doubles the number of assets, from N to 2N. This clearly offers the poten-
tial to reduce portfolio variance since the covariances of the second set of N
stocks (potentially held short) have the opposite sign from the respective
covariances in the first set of N stocks (potentially held long).
It is important to recognize, however, that while short selling offers
the potential to improve realized portfolio efficiency, there is no guarantee
without perfect foresight (ex ante). That is, if one can be certain of the
forecasted means and covariances, then short selling improves mean-vari-
ance efficiency as a simple matter of portfolio mathematics. Recent empir-
ical research, however, suggests that covariance forecasts are so fraught
with error that realized portfolio efficiency might actually be improved by
restricting or even prohibiting short positions. In addition, very little
work has been done on how best to reflect the margin requirements of
short selling in the portfolio optimization model. For example, the so-
called “full-investment constraint” is usually defined such that the portfo-
lio weights are constrained only in that they must sum to one, with nega-
tive weights assigned to short positions, and without any constraint on
the magnitudes of the weights. This assumes there are no escrow and
margin requirements, which implies that all of the proceeds from short
selling are available to finance additional investment in long positions.
We begin the next section by explaining the predictions of mean-
variance portfolio theory and its logical extension, the Capital Asset
Pricing Model (CAPM). In theory, short selling is not needed to optimize
portfolio efficiency as long as market prices reflect equilibrium required
returns. But despite this result, we do not dismiss short selling as unnec-
essary; instead, the result serves to emphasize the importance of distin-
guishing between investors based on their information set. We assume
that active investors trade based on some informational advantage,
while investors lacking any such advantages are logically passive. Thus,
indexing, rather than short selling, is probably the best way for passive
investors to optimize their potential portfolio efficiency. Other practical
implications emerge from considering the theoretical predictions in light
of the actual requirements of short selling. Although we focus on the
effects of margin requirements and escrowed short sale proceeds, we
also point out that the risk of recall and the transitory nature of over-
8-Jones/Larsen-ExpandInvest Page 206 Thursday, August 5, 2004 11:13 AM
How Short Selling Expands the Investment Opportunity Set 207
pricing means that short positions must be actively managed. We then
consider the evidence on whether short selling improves realized portfo-
lio efficiency, which is mixed, as was mentioned above. We close by
summarizing the practical implications of the theory and evidence.
SHORT SELLING IN EFFICIENT PORTFOLIOS: THE THEORY AND
ITS PRACTICAL IMPLICATIONS
We first consider the role of short selling in mean-variance portfolio theory
and the CAPM. While the theory predicts a minimal role for short selling
in a passive investor’s portfolio, the analysis provides a useful framework
for thinking about the conditions necessary for short positions to appear
in efficient portfolios. This framework provides the basis for later consid-
eration of (1) how active investors can improve expected portfolio effi-
ciency, ex ante, by short selling, and (2) how margin requirements and the
escrowing of short sales proceeds affect the feasible asset allocation.
Short Holdings in a Passive Investor’s Efficient Portfolio
Passive management has become almost synonymous with indexing, but
this definition omits any description of passive or active investors. Active
investors believe they can identify and profit from mispriced securities,
either through their own analysis or by paying for active management.
Active management is usually associated with a goal of improving mean
returns by trading on transitory advantages. Passive investors remain so
because they lack the time or the skill to identify mispriced securities, and
they do not believe active management is worth the higher fees, so their
goal is adequate diversification. Although both types of investors may
short sell, the important distinction is that only active investors can short
sell with the expectation of improving mean returns; passive investors
will short sell only for the purpose of diversification.
Mean-Variance Portfolio Theory and the CAPM
Markowitz’s mean-variance portfolio theory is a prescription for how to
choose and construct efficient portfolios. The resulting frontier shown
in Exhibit 8.1, in terms of expected mean returns (Er) and standard
deviations (
σ, the square root of the variance), represents the minimum
variance attainable at every level of return based on estimates of the
expected returns for individual securities and the return covariances for
pairs of securities. The positively sloped portion of this minimum-vari-
ance frontier, above the unique minimum-variance portfolio (MV), is
referred to as the efficient frontier of risky assets. Note that it would be
8-Jones/Larsen-ExpandInvest Page 207 Thursday, August 5, 2004 11:13 AM
208 THEORY AND EVIDENCE ON SHORT SELLING
suboptimal to hold any portfolio on the negatively sloped portion of the
frontier when there is a portfolio with the same standard deviation but a
higher expected mean return on the positively sloped portion. While the
ex post minimum-variance frontier can be computed from historical
returns, the portfolio analyst is primarily concerned with forecasting the
frontier of the future, ex ante. Thus, the analyst is focused on predicting
the expected return and covariance inputs, and this is usually done
through a combination of statistical analysis and judgment.
The CAPM is based on Markowitz’s portfolio theory in that it
describes how equilibrium (i.e., market clearing) expected returns are
determined when investors care only about expected return and vari-
ance and thus hold mean-variance efficient portfolios. Although the
standard Sharpe-Lintner CAPM
3
allows for short selling, the assump-
tions of homogeneous expectations and borrowing and lending at a
risk-free rate imply that no investor will hold a short position in equilib-
rium. This is illustrated in Exhibit 8.2, where the opportunity to borrow
or lend at a risk-free rate (r
f
) results in a unique mean-variance efficient
3
William F. Sharpe, “Capital Asset Prices: A Theory of Market Equilibrium Under
Conditions of Risk,” Journal of Finance (September 1964), pp. 425–442. John Lint-
ner, “The Valuation of Risk Assets and the Selection of Risky Investments in Stock
Portfolios and Capital Budgets,” Review of Economics and Statistics (February
1965), pp. 13–37.
EXHIBIT 8.1 Minimum-Variance Frontier
8-Jones/Larsen-ExpandInvest Page 208 Thursday, August 5, 2004 11:13 AM
How Short Selling Expands the Investment Opportunity Set 209
portfolio of risky assets that is also the market portfolio (MP), by defini-
tion, given that all risky assets must be held in equilibrium. Homoge-
nous expectations mean that all investors share common beliefs about
the joint probability distributions of future returns (i.e., means and
covariances); thus, the market portfolio comprises the risky portion of
their individual portfolios. More risk averse investors move down the
line, toward r
f
, by holding MP and lending at the risk-free rate, while
more aggressive investors move up the line, above MP, by holding MP
and borrowing at the risk-free rate.
The fundamental pricing relation predicted by the standard CAPM
is that an asset’s expected return (Er) equals the risk-free rate (r
f
) plus
the product of its beta (
β),and the risk premium on MP over the risk-
free rate (Er
MP
– r
f
). An asset’s beta represents its return volatility rela-
tive to MP (i.e., the covariance risk the asset contributes to the risky
market portfolio). This pricing relation will hold for individual assets as
long as investors view the unique mean-variance efficient portfolio as
optimal; in which case, it is the market portfolio, where the quantity of
shares supplied for each stock equals the quantity demanded. This
implies that MP represents all investors’ consensus expectation as to the
mean-variance, efficient-risky portfolio of the future.
Lintner shows, in later work, that dropping the assumption of homo-
geneous expectations does not alter the pricing implications of the CAPM
since the demands of heterogeneous investors still aggregate to the mean-
EXHIBIT 8.2
Standard CAPM with Risk-Free Lending and Borrowing
8-Jones/Larsen-ExpandInvest Page 209 Thursday, August 5, 2004 11:13 AM
210 THEORY AND EVIDENCE ON SHORT SELLING
variance efficient market portfolio.
4
That is, MP still represents the pre-
vailing expectation, across all investors, as to the optimal risky portfolio.
Thus, while dropping homogeneous expectations at least introduces the
possibility of short selling by individual investors based on their own
expectations, the CAPM still predicts that investors without special
insights would do well to follow a passive strategy of holding MP and
then either borrow or lend as their risk aversion dictates. The uniqueness
of MP, however, depends on the ability of investors to borrow or lend at
the same risk-free rate, which by definition must have a variance of zero.
The CAPM Without Risk-Free Lending and Borrowing
While it is obvious that no one can borrow at a risk-free rate, it is argu-
ably impossible to lend at a risk-free rate, as well, given that even U.S.
Treasury bills are subject to the risk of unexpected inflation. Granted,
Treasury inflation-protected securities (TIPS) are available as U.S. Trea-
sury notes and bonds, but these are also risky to the extent that interest
rates fluctuate for reasons other than the Consumer Price Index. Drop-
ping the assumption that investors can borrow or lend at a risk-free rate
means the CAPM survives in the form of Fischer Black’s so-called zero-
beta CAPM,
5
in which short selling plays a critical role.
The zero-beta CAPM makes use of the two-fund separation theorem,
which states that any point on the minimum-variance frontier can be
achieved by holding some combination of any two portfolios on the fron-
tier. Thus, as illustrated in Exhibit 8.3, more risk-averse investors can cre-
ate the minimum-variance portfolio of risky assets (MV), or some other
relatively low risk portfolio, from long positions in MP and Z, where
portfolio Z is unique in that it is the minimum-variance portfolio that is
uncorrelated with MP (i.e., portfolio Z has a beta of zero.)
6
To move
above MP, however, more aggressive investors must short sell Z to raise
the additional funds necessary to invest more than 100% of their wealth
in MP. Thus, in the zero-beta CAPM, short sales provide a method of
financing for aggressive investors in the absence of risk-free borrowing.
7
4
John Lintner, “The Aggregation of Investors’ Diverse Judgments and Preferences in
Perfectly Competitive Markets,” Journal of Financial and Quantitative Analysis (De-
cember 1969), pp. 347–400.
5
Fischer Black, “Capital Market Equilibrium With Restricted Borrowing,” Journal
of Business (July 1972), pp.444–455.
6
Black proves that a unique zero-beta portfolio (Z) lies below the minimum-variance
portfolio (MV), on the inefficient portion of the minimum variance frontier.
7
The pricing relation of zero-beta CAPM is the same as the standard CAPM, except
the expected return on the zero-beta portfolio (Z) replaces the risk-free rate, and Black
shows, by proof, that the expected return on portfolio Z is higher than the risk-free rate.
8-Jones/Larsen-ExpandInvest Page 210 Thursday, August 5, 2004 11:13 AM
How Short Selling Expands the Investment Opportunity Set 211
The CAPM with Differential Risk-Free Rates on Lending and
Borrowing
Rather than simply ignore opportunities to borrow or lend at fixed
rates, it is probably more realistic to just recognize that borrowing costs
more (r
B
) than lending yields (r
L
) and to assume that these differential
rates are effectively risk free. In this case, as is illustrated in Exhibit 8.4,
a series of efficient risky portfolios lie on the efficient frontier between
portfolios L and B. More risk-averse investors hold the risky portfolio
L, which is effectively a combination of long positions in MP and Z,
and they may move down the solid line, toward r
L
, by investing in Trea-
sury bills or TIPS. More aggressive investors hold the risky portfolio B,
which can be created by going-long portfolio MP and short-selling Z.
They can move up the solid line from B by borrowing at the broker’s
call rate and thus increasing their investment in B. The dashed line is
meant only to demonstrate that the intercept of the higher solid line,
anchored at B, is r
B
, the broker’s call rate.
Thus, in this arguably realistic scenario, short selling may be opti-
mal for aggressive investors, although beyond B, it makes sense for
more aggressive investors to begin to margin their long positions, rather
than continue to sell short. This outcome is more realistic than that of
the above zero-beta model, which assumed unlimited short selling such
that the sellers had full use of the sale proceeds. Note that unlimited
EXHIBIT 8.3 Zero-Beta CAPM
8-Jones/Larsen-ExpandInvest Page 211 Thursday, August 5, 2004 11:13 AM
212 THEORY AND EVIDENCE ON SHORT SELLING
short selling is implied when the full-investment constraint is specified
such that the weights of the portfolio holdings sum to one, with nega-
tive weights assigned to short positions. This specification, however,
ignores that in practice the full amount of the proceeds from a short sale
are placed in escrow with the broker and the short seller is required to
put up margin of at least 50% of the proceeds, as well.
8
Under these
restrictions, only limited short selling is possible. Fortunately, limited
short selling is more than adequate to span (i.e., move along) the fron-
tier from portfolio L to B.
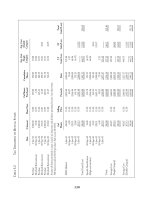
To see this, consider the top panel in Exhibit 8.5. We assume an inves-
tor initially has $15,000 long in portfolio MP, $5,000 long in portfolio Z,
and long margin is 100% (= equity/assets or $20,000/$20,000). The com-
bined positions will locate three-quarters of the distance from Z toward
MP on the minimum-variance frontier in Exhibit 8.4. This is slightly above
portfolio L, which lies about equal distance between Z and MP. Now
assume the investor sells the $5,000 long position in portfolio Z and uses
the funds as margin to short sell $10,000 of portfolio Z. The middle panel
8
Some long-short hedge funds effectively get around the 50% margin requirement
of the Federal Reserve Board’s Regulation T, as well as the escrowing of short sale
proceeds, by borrowing additional funds from their brokerage firm. Thus, every $1
short finances another $1 long. This is sometimes called 3-for-1 investing, where $3
are invested ($2 long and $1 short) for every $1 of capital. In some cases, it may be
possible to use even more margin than this example implies.
EXHIBIT 8.4 CAPM with Differential Lending and Borrowing Rates
8-Jones/Larsen-ExpandInvest Page 212 Thursday, August 5, 2004 11:13 AM
How Short Selling Expands the Investment Opportunity Set 213
of Exhibit 8.5 shows the short position in portfolio Z as a liability, the
escrowed proceeds and margin as assets, and the $5,000 in equity neces-
sary to satisfy the 50% margin requirement of the Federal Reserve Board’s
Regulation T (short margin = equity/liabilities = $5,000/$10,000). Next, in
the bottom panel, the investor buys $15,000 more of portfolio MP and
finances this purchase with a $15,000 margin loan. Thus, with the final
long and short margins both at the 50% minimum, the ending portfolio
weights are W
MP
= 1.5 and W
Z
= –0.5, which locates (approximately) at
portfolio B in Exhibit 8.4 since B lies above MP by about one-half of the
distance from Z to MP on the minimum-variance frontier.
Thus, in this example, the investor can use combinations of portfo-
lios MP and Z to span from L to B without violating margin require-
EXHIBIT 8.5 Limited Short Sales with 50% Margins
Initial Long Positions in Portfolios MP and Z (Combined position locates slightly
above Portfolio L on the Minimum-Variance Frontier in Exhibit 8.4.)
Sell $5,000 of Portfolio Z—use funds as Margin to Short Sell Portfolio Z
Final Long Position in Portfolio MP
Final Weights in the Portfolio of Risky Assets: = $30,000/$20,000 = 1.5 and
= –$10,000/$20,000 = –0.5 (Combined position locates at Portfolio B on the
Minimum-Variance Frontier in Exhibit 8.4, or just below B if borrowing rate > lend-
ing rate.)
Total equity from Long + Short positions = $20,000; Net lending, borrowing = 0 as
Escrowed short sale proceeds + Short margin requirement = Long margin loan.
Assets Liabilities
Portfolio MP $15,000 Margin Loan 0
Portfolio Z $5,000 Equity $20,000
Long margin = Equity/Assets = $20,000/$20,000 = 100%
Assets Liabilities
Short Sale Proceeds $10,000 Portfolio Z $10,000
Margin Requirement $5,000 Equity $5,000
Short margin = Equity/Liabilities = $5,000/$10,000 = 50%
Assets Liabilities
Portfolio MP $30,000 Margin Loan $15,000
Equity $15,000
Long margin = Equity/Assets = $15,000/$30,000 = 50%
W
MP
R
W
Z
R
8-Jones/Larsen-ExpandInvest Page 213 Thursday, August 5, 2004 11:13 AM
214 THEORY AND EVIDENCE ON SHORT SELLING
ments. Note that the dollar amounts of lending (the assets of the short
position) and borrowing (the liabilities of the long position) must offset
if the resulting combination is to lie on the minimum-variance frontier.
The costs, however, will not offset given that we allow for differential
rates, here in Exhibit 8.4, and the broker’s call rate on a margin loan is
certain to be higher than both the rebate rate on the escrowed short sale
proceeds, as well as the rate of return on the $5,000 short margin
requirement.
9
This means that the final portfolio weights in Exhibit 8.5
will actually locate just below portfolio B, rather than right on it, indi-
cating a slightly lower expected return. Still, Exhibit 8.4 is a reasonable
approximation of a passive investor’s opportunity set.
Investors may hold portfolio L and move down the solid line
toward r
L
by purchasing U.S. Treasury bills or TIPS; they can move up
the minimum-variance frontier from L by increasing the weight in the
market portfolio (MP), and they can move above MP, toward portfolio
B, by short selling portfolio Z. If, however, an investor constructs port-
folio B such that W
MP
= 1.5 and W
Z
= –0.5, as in Exhibit 8.5, then it is
impossible to borrow and move up the solid line from B without violat-
ing the 50% margin requirements.
10
However, it may still be possible to
borrow and move up the solid line, from portfolio B, given that B can
be constructed from long-only positions under conditions established by
Richard Green.
11
Short Positions on the Minimum-Variance Frontier Green shows that all the posi-
tions on the minimum-variance frontier, and thus the efficient frontier,
can be achieved with portfolios of long-only positions, unless there
remains an asset with an expected return of zero, or less, that is positively
correlated with all other assets. The existence of such an asset represents a
short selling opportunity that will improve the efficiency of any portfolio
made up of long positions only. To see this, recall that a short position’s
expected return and correlations have the opposite sign as that of a long
9
If the borrowing and lending rates are equal, then the model reduces to the standard
CAPM with a unique optimal risky portfolio. In fact, Lintner assumed equal rates
when he concluded that margin requirements on short sales do not alter the CAPM
or its prediction of a unique optimal risky portfolio. John Lintner, “The Effects of
Short Selling and Margin Requirements in Perfect Capital Markets,” Journal of Fi-
nancial and Quantitative Analysis (December 1971), pp. 1173–1195.
10
Later, in this chapter, we discuss in detail the limitations that margin requirements
place on active short sellers in their attempts to achieve enhanced portfolio efficiency.
These limitations are irrelevant to passive investors since they may construct portfo-
lio B from long positions, as explained immediately hereafter.
11
Richard C. Green, “Positively Weighted Portfolios on the Minimum-Variance
Frontier,” Journal of Finance (December 1986), pp. 1051–1068.
8-Jones/Larsen-ExpandInvest Page 214 Thursday, August 5, 2004 11:13 AM
How Short Selling Expands the Investment Opportunity Set 215
position in the same asset. Thus, short selling an asset with an expected
return of zero and positive correlations (with all other assets) will not
change the expected return, but it will reduce the variance of any long-
only portfolio (as a result of the short position’s negative correlation
with all other assets). If the asset had a negative expected return, then it
would represent an even better hedging opportunity since short selling it
would actually increase the expected return and reduce the variance of
any long-only portfolio.
Green points out that the existence of such an opportunity is incon-
sistent with the CAPM’s equilibrium pricing relation, as well as with
equilibrium as defined in most other recognized asset-pricing models.
This is because pricing models logically predict that assets that have
positive return correlations with most other assets must offer positive
expected returns to compensate investors for exposing their wealth to
covariance risk. Although pricing inefficiencies and disequilibrium may
result in transitory short selling opportunities, attempting to identify
and exploit such opportunities is for active, not passive, investors. Pas-
sive investors lack the time or the skill to identify overpriced securities,
and they do not believe active management is worth the higher fees.
In theory, limited short selling will span the efficient frontier, but
passive investors can optimize their potential efficiency with a long-only
portfolio, and indexing offers a low-cost solution. Individual securities
could be used to adjust the index for an investor’s risk aversion. Those
whose risk aversion lies well above or below average should use either a
margin loan or very low-risk lending, respectively, as in Exhibit 8.4,
rather than let their risky portfolio deviate too far from the target index.
Short Holdings in an Active Investor’s Efficient Portfolio
We have seen that short selling has little to offer passive investors. The
question is how should active investors, who have some prospects of iden-
tifying overpriced stocks, go about short selling so as to improve potential
portfolio efficiency. We analyze the theoretical justifications for three spe-
cific strategies: (1) enhanced indexing with short selling, (2) long-plus-
short portfolios, and (3) integrated long-short portfolios. Risk-neutral and
dollar-neutral long-short portfolios are not addressed here because they
represent arbitrage strategies that are not primarily concerned with portfo-
lio optimization.
12
Later, we consider how margin requirements and the
escrowing of short sales proceeds affect the feasible asset allocation.
12
Risk or dollar neutral portfolios may offer arbitrage profits, but these portfolios,
alone, are unlikely to maximize an investor’s utility. See Bruce I. Jacobs, Kenneth N.
Levy, and David Starer, “On the Optimality of Long-Short Strategies,” Financial An-
alysts Journal (March/April 1998), pp. 40–51.
8-Jones/Larsen-ExpandInvest Page 215 Thursday, August 5, 2004 11:13 AM
216 THEORY AND EVIDENCE ON SHORT SELLING
Enhanced Indexing with Short Selling
As several other chapters in this book point out, a considerable amount of
evidence indicates that individual stocks may occasionally become over-
priced, and short interest or the costs of short selling may offer some clues
for identifying these stocks. This suggests a strategy of enhanced index-
ing, where long positions reflect a passive index and short positions are
held in a separate active portfolio.
13
This active portfolio is comprised of
positions that represent a conscious attempt to “beat the market.” Long
positions could be included in this active portfolio, but short positions
have a distinct advantage in that they offer the opportunity to hedge
against the long-only index. That is, return correlations between the short
positions and the long-only index tend to be negative since the opposite is
true for the long positions. Thus, we will assume that our active portfolio
is made up only of short positions. Part of the logic for separate portfolios
is that the short positions in the active portfolio are speculative, by
nature, and at risk of recall; therefore, they have shorter durations and
require more attention than the positions in the long-only index.
Enhanced indexing with short selling offers a clear advantage over
long-only enhanced indexing in that the latter limits active investors from
fully utilizing negative information about a security. Richard Grinold and
Ronald Kahn point out that the opportunity costs of long-only indexing
are especially high in small-capitalization stocks.
14
To see this, consider an
example in which a stock comprises only 0.1% of the benchmark index,
long-only investors can materially overweight this stock, in their enhanced
index, but only a 0.1% underweight can be established. That is, if long-
only investors believe the stock will significantly underperform, there is
not much they can do other than sell their long position in the stock.
To see graphically how an active short-only portfolio can improve effi-
ciency, we consider an opportunity, like the one described by Richard
Green, with returns that are positively correlated with those of most other
assets and an expected return that is negative. The returns to a short posi-
tion in this hypothetical asset are negatively correlated with most other
assets and the expected return is positive. Exhibit 8.6 plots a short position
(S
H
) that meets these conditions and shows that the position acts like a
hedging asset when introduced to a preexisting minimum-variance frontier.
The newly feasible tangency portfolio, P*, now replaces MP as the optimal
13
The idea of holding a passive portfolio supplemented by a separate actively man-
aged portfolio comes from Jack L. Treynor and Fischer Black, “How to Use Security
Analysis to Improve Portfolio Selection,” Journal of Business (January 1973), pp.
66–86.
14
Richard C. Grinold and Robert C. Kahn, “The Efficiency Gains of Long-Short In-
vesting,” Financial Analysts Journal (November/December, 2000), pp. 40–53.
8-Jones/Larsen-ExpandInvest Page 216 Thursday, August 5, 2004 11:13 AM
How Short Selling Expands the Investment Opportunity Set 217
risky portfolio, despite the fact that P* has a lower expected return than
MP. This is because P* has the higher Sharpe ratio (i.e., a higher ratio of
excess return to standard deviation). Sharpe ratios are represented in
Exhibit 8.6 as the slopes of the lines, SR
P*
and SR
MP
, anchored at r
f
and
tangent to the respective minimum-variance frontiers.
15
The portfolio with
the highest Sharpe ratio is considered more efficient since holding portfolio
P* and either borrowing or lending at the risk-free rate, so as to move up
or down the line from P*, offers opportunities that dominate those that
can be generated from MP.
16
Note that, in this example, the primary rea-
son for the improved portfolio efficiency is the negative return correlation
between this short position (S
H
) and the market portfolio (MP), which
results in the more exaggerated convexity of the new minimum-variance
portfolio (relative to the expected return axis) in Exhibit 8.6.
15
The square root of the increase in the Sharpe ratio is equivalent to the Information
ratio. This ratio is popular for measuring the performance improvement attributable
to actively managed strategies. It is defined as the ratio of excess return (or alpha)
over residual risk, where alpha and residual risk are usually estimated with the em-
pirical CAPM. The empirical CAPM is simply a CAPM-based regression model.
16
Note that we have gone back to the assumption of lending and borrowing at a sin-
gle risk-free rate in Exhibit 8.6 only to simplify the graph. The larger point, that such
a short position improves portfolio efficiency, still holds even with differential lend-
ing and borrowing rates. We will soon reintroduce the effect of differential rates and
that margin requirements severely limit borrowing when short selling.
EXHIBIT 8.6 Enhanced Indexing by Hedging with Short Sales
8-Jones/Larsen-ExpandInvest Page 217 Thursday, August 5, 2004 11:13 AM
218 THEORY AND EVIDENCE ON SHORT SELLING
Interpreting Exhibit 8.6 in terms of enhanced indexing implies that
the market portfolio (MP) is the desired long-only index, while the short
position (S
H
) can be thought of as a short-only portfolio in one or more
stocks. Since the long-only index is passive, the line between passive and
active has been somewhat blurred. One can imagine that an otherwise
passive investor might short sell one or few securities to hedge against a
specific source of risk. As mentioned earlier, the distinction gets back to
whether the goal is return enhancement or risk reduction. In this exam-
ple, the nature of the short position (S
H
) indicates that the goal is risk
reduction, but with a different short position, the goal could have been
return enhancement, just as easily. An alternative to enhanced indexing
involves taking an active strategy in both the short-only portfolio and
the long-only portfolio. We refer to this as an active long-plus-short
strategy, where the long and short positions are held in separate portfo-
lios, just as with enhanced indexing.
Long-Plus-Short Portfolios
There are two reasons why long-plus-short portfolios might beat
enhanced indexing with short selling. First, the investor may be adept at
picking underpriced stocks, as well as overpriced stocks. In which case,
short selling provides what is expected to be a low-cost method of lever-
aging knowledge of underpricing, but this works only if the price of the
short-sold asset behaves as expected. If the price increases or if the short
position is recalled before the price has time to decline, then short sell-
ing can be disastrously expensive. Thus, as a means of leveraging long
positions, short sales present much more risk than long margin.
Second, if an investor believes the market portfolio (or index) is less
than mean-variance efficient, ex ante, then the investor may be better off
constructing their own long portfolio. For example, if the capital markets
place a relatively high value on liquidity, such that the CAPM is misspeci-
fied, then holding the market portfolio long amounts to paying for liquid-
ity, and an investor who is more buy-and-hold oriented on the long side
may have little need for this liquidity. Consequently, constructing a long-
only portfolio that is mean-variance efficient based on relatively passive
inputs may be preferred to the market portfolio (or a similar index). In
this case, the long-plus-short strategy is meant to provide better passive
long-side efficiency than enhanced indexing with short sales.
Clearly, the long-only portfolios account for the difference between
enhanced indexing with short sales and long-plus-short; thus, the strate-
gies appear much the same graphically. Exhibit 8.7 illustrates how an
active long-plus-short strategy can enhance efficiency. The actively man-
aged long-only portfolio (L) results from optimizing on an investor’s
8-Jones/Larsen-ExpandInvest Page 218 Thursday, August 5, 2004 11:13 AM
How Short Selling Expands the Investment Opportunity Set 219
mean-variance inputs. Portfolio S
O
represents an actively managed short-
only portfolio. The location of S
O
, on the mean-variance plane, is intended
to reflect a strategy of identifying and short selling overpriced stocks; thus,
the higher expected return and the less exaggerated convexity, when com-
pared to that of portfolio S
H
, which served to illustrate a hedging motive
in Exhibit 8.6.
17
Note that this alternative short position, S
O
, is introduced
as a way of generalizing the illustrations and is not meant to imply any
inherent difference between the short positions used in enhanced indexing
versus those used in active long-plus-short portfolios.
The resulting optimal risky portfolio P*, in Exhibit 8.7, has a higher
expected return and about the same standard deviation as the active
long-only portfolio (L); thus, P* is clearly more efficient since its Sharp
ratio, SR
P*
, is higher than SR
L
. As mentioned above, the only advantage
of a long-plus-short strategy over enhanced indexing with short selling
is, of course, the potential for the actively managed long-only portfolio
(L) to achieve greater efficiency than the market portfolio (MP). But
even in that case, if the return correlation with the active short-only
portfolio is lower for MP than for L, then enhanced indexing could still
achieve greater overall efficiency.
EXHIBIT 8.7
Enhanced Efficiency with Long-plus-Short Portfolios
17
The less exaggerated convexity of the frontier between portfolios S
O
and L in Ex-
hibit 8.7, when compared to that between portfolios S
H
and MP in Exhibit 8.6, in-
dicates that the return correlation between portfolios S
O
and L is higher (less
negative) than that between portfolios S
H
and MP.
8-Jones/Larsen-ExpandInvest Page 219 Thursday, August 5, 2004 11:13 AM
220 THEORY AND EVIDENCE ON SHORT SELLING
Effects of Margin Requirements and Escrowing Proceeds on Asset Allocation In using
Sharpe ratios to evaluate portfolio efficiency, we have effectively assumed
unlimited borrowing and lending at the same risk-free rate. But the rate
on borrowing is certainly higher than the rate on lending. In addition,
when the optimal risky portfolio involves short positions, as with port-
folio P* in Exhibit 8.7, margin requirements severely restrict the amount
of net borrowing possible. To see this, consider an investor with $10,000
in equity and assume that mean-variance optimization identifies the
weights of the portfolios L and S
O
in the optimal risky portfolio, P*, of
Exhibit 8.7, as = 1.5 and = –0.5. Exhibit 8.8 shows that these
weights can be achieved while satisfying the margin requirements by
going short $5,000 in portfolio S
O
and long $15,000 in portfolio L. Just
as in the previous example, in Exhibit 8.5, this set of weights results in
offsetting dollar amounts of lending and borrowing. Short sale proceeds
and short margin total $7,500, while the final long margin, in the bot-
tom panel, is $7,500.
Recall, however, that the short positions in Exhibits 8.6 and 8.7 are
plotted as if they were long positions. Thus, the portfolio weights need
to be adjusted to reflect the perspective of these exhibits. This is done by
taking the absolute value of the unadjusted weights, above, as a propor-
W
L
R
W
S
O
R
EXHIBIT 8.8 Asset Allocation in the Optimal Risky Portfolio (P*)
Short Position in Portfolio S
O
Long Position in Portfolio L
Unadjusted Weights in P*, the Optimal Risky Portfolio: = $15,000/$10,000 =
1.5 and = –$5,000/$10,000 = –0.5
Adjusted Weights in P*, the Optimal Risky Portfolio: = $15,000/$20,000 =
0.75 and = $5,000/$20,000 = 0.25
Total equity from long + Short positions = $10,000; Net lending, borrowing = 0 as
Escrowed short sale proceeds + Short margin requirement = Long margin loan.
Assets Liabilities
Short Sale Proceeds $5,000 Portfolio S
O
$5,000
Margin Requirement $2,500 Equity $2,500
Short margin = Equity/Liabilities = $2,500/$5,000 = 50%
Assets Liabilities
Portfolio L $15,000 Margin Loan $7,500
Equity $7,500
Long margin = Equity/Assets = $7,500/$15,000 = 50%
W
L
R
W
S
O
R
W
L
R
W
S
O
R
8-Jones/Larsen-ExpandInvest Page 220 Thursday, August 5, 2004 11:13 AM
How Short Selling Expands the Investment Opportunity Set 221
tion of the sum of these absolute values. This yields adjusted weights for
L and S
O
, in the optimal risky portfolio P*, of
= 1.5/2.0 = 0.75 and = 0.5/2.0 = 0.25
where the absolute value signs in the subscripts indicate that the weights
have been computed so that a positive weight in S
O
represents a short
position in that portfolio. Note that when assigning the dollar amounts
invested, these adjusted weights should be applied to the total dollar
amount available for investment, whereas the unadjusted weights are
applied to the total equity amount. The total dollar amount available
for investment is $20,000, the product of total equity and the sum of
the absolute values of the unadjusted weights, where 2.0 indicates that
both the long and short margin have been pushed to 50%.
18
This procedure for calculating adjusted weights is basically the same as
for the so-called “Lintnerian” definition of short sales (named for the short-
sale constraint as formulated in John Lintner’s version of the CAPM).
Under the Lintnerian definition, however, the dollar amounts invested are
assigned by multiplying the adjusted weights by the total equity. Thus,
given the Lintnerian definition of short sales, the adjusted weights,
= 0.75 and = 0.25
would dictate that $10,000 in equity be invested as a $7,500 long posi-
tion in portfolio L and a $2,500 short position in portfolio S
O
. This, of
course, implies 100% long and short margin. We suggest that a more
realistic dollar allocation can be computed, as above, by multiplying the
amount available for investment (given the desired level of margin) by
the adjusted weights. This is what we did in Exhibit 8.8, except there we
targeted the optimal risky portfolio. (That particular combination of
weights resulted in no net borrowing or lending at 50% long and short
margin.) Next, we consider how risk-averse investors can lend or bor-
row to achieve their own optimal complete portfolio (over the risk-free
and risky assets).
18
We consider the margin requirements in a manner similar to Gordon J. Alexander,
“Short Selling and Efficient Sets,” Journal of Finance (September, 1993), pp. 1497–
1506. In addition to addressing portfolio optimization with short selling and frac-
tional margin requirements, Alexander specifies that the expected return on a short
position equals the negative of the expected return on the respective long position
plus rebate interest on escrowed short sale proceeds and interest on the short margin
requirement.
W
L
R
W
S
O
R
W
L
R
W
S
O
R
8-Jones/Larsen-ExpandInvest Page 221 Thursday, August 5, 2004 11:13 AM
222 THEORY AND EVIDENCE ON SHORT SELLING
Let us first consider an investor with greater than average risk-aver-
sion, implying that utility is maximized by holding the optimal risky
portfolio, P*, in combination with lending. Assume, for example, that
the investor’s optimal complete portfolio is = 0.6, = –0.2, and
= 0.6 in terms of unadjusted weights. (Note that the weights
for portfolios L and S
O
remain in the same relative proportions as in the
optimal risky portfolio, P*, in Exhibit 8.8.) Exhibit 8.9 shows that these
weights can be achieved while satisfying the margin requirements by
going short $2,000 in portfolio S
O
and long $6,000 in portfolio L.
There is also $6,000 in lending, $3,000 of which is required in the form
of short margin and escrowed short sale proceeds.
From the perspective of Exhibit 8.7, this complete portfolio lies on the
line, below portfolio P*, with a slope (i.e., Sharpe ratio) of SR
P*
. The
adjusted weights for this complete portfolio are computed, as before, by tak-
ing the absolute value of these unadjusted weights as a proportion of the sum
of these absolute values.
= 0.6/1.4 = 0.43, = 0.2/1.4 = 0.14, and = 0.6/1.4 = 0.43
W
L
C
W
S
O
C
W
Lending
C
W
L
C
W
S
O
C
EXHIBIT 8.9 Optimal Asset Allocation with Lending
Short Position in Portfolio S
O
Long Position in Portfolio L
Unadjusted Weights in the Complete Portfolio: = $6,000/$10,000 = 0.6,
= –$2,000/$10,000 = –0.2, and = $6,000/$10,000 = 0.6
Adjusted Weights in the Complete Portfolio: = $6,000/$14,000 = 0.43,
=$2,000/$14,000 = 0.14, and = $6,000/$14,000 = 0.43
Total Equity from long + Short positions = $10,000; Total lending = $6,000 = Es-
crowed short sale proceeds + Short margin requirement + Lending at r
f
.
Assets Liabilities
Short Sale Proceeds $2,000 Portfolio S
O
$2,000
Margin Requirement $1,000 Equity $1,000
Short margin = Equity/Liabilities = $1,000/$2,000 = 50%
Assets Liabilities
Portfolio L $6,000 Margin Loan
Lending at r
f
$3,000 Equity $9,000
Long margin = Equity/Assets = $9,000/$9,000 = 100%
W
L
C
W
S
O
C
W
Lending
C
W
L
C
W
S
O
C
W
Lending
C
W
Lending
C
8-Jones/Larsen-ExpandInvest Page 222 Thursday, August 5, 2004 11:13 AM
How Short Selling Expands the Investment Opportunity Set 223
The denominator of 1.4 indicates that $14,000 is available for invest-
ment here, in Exhibit 8.9, whereas $20,000 was available for the example
in Exhibit 8.8. The difference arises because long margin is not utilized in
the example of Exhibit 8.9. Thus, $9,000 is available for investment long,
while the use of 50% short margin generates a $2,000 for investment in
portfolio S
O
, and this in turn, requires an additional $3,000 in lending, in
the form of escrowed proceeds and margin requirement.
Of course, the short margin requirement and the escrowed proceeds
qualify as lending only if they yield interest, and individual investors are
rarely in a position to demand this interest from their broker. Thus, the
complete portfolio of an individual investor, with this allocation, will
actually locate below the line, SR
P*
, as a result of the forgone interest.
Even the portfolios of institutional investors, with this allocation, will
locate slightly below the line, SR
P*
, because the rebate rate they earn on
escrowed proceeds is less than the risk-free rate.
Next, we consider an investor with less than average risk aversion,
so that utility is maximized if it is possible to lever the optimal risky
portfolio, P*, up the line, SR
P*
, by borrowing. We have assumed, to this
point, however, that the optimal risky portfolio, P*, is made up of the
particular combination of portfolio weights,
= 1.5 and = –0.5 (i.e., = 0.75 and = 0.25,
adjusted) that happens to utilize all available margin, as was demon-
strated in Exhibit 8.8.
19
Thus, it is impossible to move up the line, from
P*, by borrowing. If, however, the optimal risky portfolio, P*, is made
up of some less extreme combination of portfolio weights, such as
= 1.4 and = –0.4 ( = 0.78 and = 0.22)
then the long margin would not be fully utilized, and it would be possi-
ble to move up the line from this new P
*
. Exhibit 8.10 considers this
combination of weights, first with no net lending or borrowing (in the
top two panels) and then with net lending (in the bottom two panels).
19
Recall that the particular combination of unadjusted weights, = 1.5 and
= –0.5 is the most extreme combination of long and short weights (i.e., the maximum
difference in the absolute values of the weights) possible given that the 50% margin
requirements are satisfied and no net lending or borrowing. Thus, this is the most
extreme combination of long and short weights possible in the optimal risky portfo-
lio, P*, since there can, by definition, be no net lending or borrowing in the optimal
risky portfolio, P*.
W
L
R
W
S
O
R
W
L
R
W
S
O
R
W
L
R
W
S
O
R
W
L
R
W
S
O
R
W
L
R
W
S
O
R
8-Jones/Larsen-ExpandInvest Page 223 Thursday, August 5, 2004 11:13 AM
224 THEORY AND EVIDENCE ON SHORT SELLING
EXHIBIT 8.10 Optimal Asset Allocation with Borrowing
Short Position in Portfolio S
O
in the Optimal Risky Portfolio, P*
Long Position in Portfolio L in the Optimal Risky Portfolio, P*
Short Position in Portfolio S
O
in an Levered Optimal Complete Portfolio
Long Position in Portfolio L in a Levered Optimal Complete Portfolio
Note: The weights (unadjusted and adjusted) in P*, the Optimal Risky Portfolio are
unchanged from above, although net borrowing of $1,000 increases the dollar
amounts of the long and short positions by $1,400 and $400, respectively.
Unadjusted Weights in the Complete Portfolio: = $15,400/$10,000 = 1.54,
= –$4,400/$10,000 = –0.44, and = –$1,000/$10,000 = –0.1
Adjusted Weights in the Complete Portfolio: = $15,400/$18,800 = 0.82,
= $4,400/$18,800 = 0.23, and = –$1,000/$18,800 = –0.05
Assets Liabilities
Short Sale Proceeds $4,000 Portfolio S
O
$4,000
Margin Requirement $2,000 Equity $2,000
Short margin = Equity/Liabilities = $2,000/$4,000 = 50%
Assets Liabilities
Portfolio L $14,000 Margin loan $6,000
Equity $8,000
Long margin = Equity/Assets = $8,000/$14,000 = 57%
Unadjusted Weights in P*, the Optimal Risky Portfolio: = $14,000/$10,000
= 1.4 and = –$4,000/$10,000 = –0.4
Adjusted Weights in P*, the Optimal Risky Portfolio: = $14,000/$18,000
= 0.78 and = $4,000/$18,000 = 0.22 (Note: Lending and borrowing
amounts offset.)
Assets Liabilities
Short Sale Proceeds $4,400 Portfolio S
O
$4,400
Margin Requirement $2,200 Equity $2,200
Long Margin = Equity/Assets = $2,200/$4,400 = 50%
Assets Liabilities
Portfolio L $15,400 Margin Loan $7,600
Equity $7,800
Long Margin = Equity/Assets = $7,800/$15,400 = 51%
W
L
R
W
S
O
R
W
L
R
W
S
O
R
W
L
C
W
S
O
C
W
Net Borrowing
C
W
L
C
W
S
O
C
W
Net Borrowing
C
8-Jones/Larsen-ExpandInvest Page 224 Thursday, August 5, 2004 11:13 AM
How Short Selling Expands the Investment Opportunity Set 225
The top two panels show that with $10,000 in equity, an allocation
of $14,000 long in portfolio L and $4,000 short in portfolio S
O
results in
no net lending or borrowing, but additional borrowing capacity remains
(as long margin = 57%). The bottom two panels show that the less risk-
averse investor can move up the line SR
P*
, from P*, by increasing the
long margin loan by $1,600, buying $1,400 more of portfolio L, and
putting up another $200 short margin, which allows for the short sale of
an additional $400 of portfolio S
O
. The relative proportions of the risky
assets remain the same as before, but now net borrowing equals $1,000
(= long margin loan – short sale proceeds – short margin requirement).
The weights in this investor’s optimal complete portfolio are
= 1.54, = –0.44, and = –0.1
( = 0.82, = 0.23, and = –0.05).
These adjusted weights are computed as before, and the amount
available for investment equals the $15,400 held long, plus the $4,400
short position, less the $1,000 in net borrowing. Net borrowing is a lia-
bility that reduces the amount available for investment (the denominator
of this allocation ratio), which, in turn, increases the weights for portfo-
lios L and S
O
in the optimal complete portfolio. Likewise, net lending
increases the amount available for investment, as we saw in Exhibit 8.9.
(Although short selling also creates a liability, it is treated as a long posi-
tion in the calculation of these adjusted weights.) What if the investor
wishes to move further up the line SR
P*
? It cannot be done in any mate-
rial amount given this definition of P*
( = 1.4 and = –0.4)
because the ending asset allocation results in 51% long margin, which is
just a few dollars short of using up all remaining borrowing capacity.
Any further increase in net borrowing results in moving the risky
asset allocation away from P*, where
= 1.4 and = –0.4 ( = 0.78 and = 0.22)
Specifically, the short position in portfolio S
O
cannot make up as large a
proportion of the resulting complete portfolio. This is because the
W
L
C
W
S
O
C
W
Borrowing
C
W
L
C
W
S
O
C
W
Borrowing
C
W
L
R
W
S
O
R
W
L
R
W
S
O
R
W
L
R
W
S
O
R
8-Jones/Larsen-ExpandInvest Page 225 Thursday, August 5, 2004 11:13 AM
226 THEORY AND EVIDENCE ON SHORT SELLING
escrowed proceeds and margin requirement associated with short selling
effectively represent lending, which forces the location of a complete
portfolio down the line, SR
P*
. To see this, consider Exhibit 8.11, where
the dollar amount of portfolio S
O
sold short is the same as in Exhibit
8.9. The difference is that here, in Exhibit 8.11, we fully utilize the long
margin, whereas before we had not borrowed against the $9,000 of
equity in the long position. The asset weights in the resulting complete
portfolio are
= 1.8, = –0.2, and = –0.6
( = 1.29, = 0.14, and = –0.43)
W
L
C
W
S
O
C
W
Borrowing
C
W
L
C
W
S
O
C
EXHIBIT 8.11 Suboptimal Asset Allocation with Net Borrowing
Short Position in Portfolio S
O
Long Position in Portfolio L
Unadjusted Weights in the Complete Portfolio: = $18,000/$10,000 = 1.8,
= –$2,000/$10,000 = –0.2, and = –$6,000/$10,000 = –0.6
Adjusted Weights in the Complete Portfolio: = $18,000/$14,000 = 1.29,
= $2,000/$14,000 = 0.14, and = –$6,000/$14,000 = –0.43
Unadjusted Weights in the Risky Portfolio: = $18,000/$16,000 = 1.12 and
= –$2,000/$16,000 = –0.12
Adjusted Weights in the Risky Portfolio: = $18,000/$20,000 = 0.9 and
= $2,000/$20,000 = 0.1
Total equity from Long + Short positions = $10,000; Net borrowing = $6,000 =
Long margin loan – (Escrowed short sale proceeds + Short margin requirement)
Assets Liabilities
Short Sale Proceeds $2,000 Portfolio S
O
$2,000
Margin Requirement $1,000 Equity $1,000
Short margin = Equity/Liabilities = $1,000/$2,000 = 50%
Assets Liabilities
Portfolio L $18,000 Margin loan $9,000
Equity $9,000
Long margin = Equity/Assets = $9,000/$18,000 = 50%
W
L
C
W
S
O
C
W
Net Borrowing
C
W
L
C
W
S
O
C
W
Net Borrowing
C
W
L
R
W
S
O
R
W
L
R
W
S
O
R
W
Borrowing
C
8-Jones/Larsen-ExpandInvest Page 226 Thursday, August 5, 2004 11:13 AM