Study guide for come into my trading room phần 8 ppsx
Bạn đang xem bản rút gọn của tài liệu. Xem và tải ngay bản đầy đủ của tài liệu tại đây (227.15 KB, 21 trang )
Answer 98
Combination 4 is correct. Give yourself four points for choosing the
right answer.
Strict money management rules are the keystone of any trading plan;
they allow you to survive and succeed in the long run. A systems trader
must be absolutely strict about his analytic rules, but a discretionary
trader has some degree of flexibility. As long as he analyzes multiple
timeframes and does not trade against his rules, he has some latitude in
choosing his indicators and methods.
Answer 99
Choice 2 is correct. Give yourself four points for choosing the right
answer.
Beginners are attracted by tales of huge profits, but professionals focus
on survival first. This is why any good trading plan is built on the basis
of money management rules. The next goal is to grind out steady profits.
Once that goal is being consistently achieved, we can spend more time
looking for extraordinary opportunities. Then, if our analysis is right and
the market cooperates, we sometimes achieve extraordinary returns.
Answer 100
Sequence 5 is correct. Give yourself four points for choosing the right
answer.
Serious trading begins with good records. They come first because
they allow you to learn from mistakes as well successes, while you
experiment with different techniques. Setting money management rules
and recording your compliance with them is the next most important
step. The third stage is the development of a decision-making tree.
THE ORGANIZED TRADER 139
Rating Yourself
Below 60 Poor. If you failed this test, please go back to the main book,
reread the appropriate chapters, and retake this test. The topic is so
new and so neglected in trading literature that most people are com-
pletely unfamiliar with it. If you master it, you will get far ahead of
the crowd. Return to the recommended chapters, study them, and
retake this test a few days later.
60–72 Excellent. Your understanding of trading records is uncommon!
All that is left now is to set up your own records—and to trade suc-
cessfully!
Required Reading
Elder, Alexander. Come into My Trading Room (New York: John Wiley &
Sons, 2002). See Chapter 8 “The Organized Trader” and Chapter 9
“Trading for a Living.”
140 ANSWERS AND RATING SCALES
SECTION
THREE
LET’S TRADE:
CASE STUDIES
AND QUESTIONS
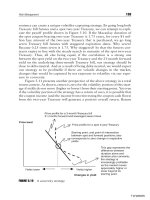
LET’S TRADE
The longer you trade, the more you learn—practice will make you a
better trader. Be sure to put on many small trades and carefully docu-
ment every entry and exit. Good records allow you to learn from expe-
rience. Trading small will help you keep emotions in check. You will
have plenty of time to increase your trading size once you become a
competent trader.
Remember this paragraph from Come Into My Trading Room:
Keeping good records is the single most important contribution to
your success. If you scrupulously maintain records, review them, and
learn from them, your performance will improve. If, at the same time,
your money management is in place to ensure survival during the
learning process, you’re sure to become a success.
This chapter of the Study Guide offers you an opportunity to prac-
tice making trading decisions and keeping records. Look at the charts
in this chapter as if you saw them in your trader’s diary. Mark up chart
patterns and indicator signals, and write down your comments on the
most important points. Make your trading decision and then turn to
the Answers chapter to compare your notes with mine and grade your
performance.
There are many ways to reach a trading decision. Some serious
traders use fundamental analysis, others technical, some combine both,
while gamblers trade “from the gut.” I like to be aware of the key fun-
damentals, but my favorite method is technical analysis. Price, time,
and volume reflect actions of all market participants—smart and dumb,
143
disciplined and gamblers, rich and poor, long-term and short-term
oriented. Prices and indicators are the footprints of bulls and bears. Let
us practice reading those footprints in order to find our way.
The charts in this section were printed in December 2001, not long
after the disaster of September 11th in New York. In stressful times like
these, when fundamentals shift rapidly, technical analysis really shines.
How to Work with These Case Studies
You will see three charts for each trade—two for the entry and one for
the exit. For the entry, you will have a weekly and a daily chart. The
weekly chart will show about a year and a half of history, a 26-week
EMA (solid), a 13-week EMA (dotted), and MACD-Histogram. The daily
chart, ending on the same day, will show several months of history,
the 22-day and the 13-day EMAs (solid and dotted), a 2-day Force Index,
and MACD-Histogram. For exit and reentry decisions, you will see an
updated daily chart that will, in addition to the above, show a trading
channel centered around the long EMA.
These charts feature some of my favorite indicators, although many
others could be used. It would impossible to show all important indi-
cators in a study guide, especially since serious traders always change
their sets of technical tools. My main goal here is to demonstrate the
need for using multiple timeframes—making a strategic decision on
the weekly chart and tactical choices on the daily chart. I also want to
illustrate the need for combining several indicators—trend-following
and oscillators—to evaluate different aspects of market behavior and
make rational trading decisions.
It is your job to find, mark, and document at least two important trad-
ing signals on each chart. You will receive a point for each correctly
marked signal and bonus points for identifying additional trading sig-
nals. Be sure to document each step that you take.
There are eight sets of charts, covering eight trades. Begin by work-
ing through an entry in one market, and then grade your performance
on that entry. Afterward, work through an exit and grade your perform-
ance again, using rating scales in the Answers section. If you are satis-
fied with your performance, move on to the next trade and repeat this
process. If you find that you have done poorly in a trade, return to Come
144 CASE STUDIES
Into My Trading Room and reread the relevant chapters before going
any further. This process will put you miles ahead of amateurs and gam-
blers who jump into the market with both feet, chasing a quick buck—
and get taken out feet first. Education, record keeping, and caution are
essential for your long-term success, which is the only success worth
having in the financial markets.
Please do not try to complete all eight exercises in a single day. Give
yourself enough time to think, reflect, reread relevant chapters, and
review other charts on your screen. You can take more than a week to
work through these exercises.
Here is the recommended sequence of steps as you move through
eight trades:
1. Look at the Entry Question page, which shows two unmarked
charts—weekly and a daily.
2. Mark two or more trading messages on each chart; make an entry
decision and document it.
3. Go to the Entry Answer page for that trade and grade your entry per-
formance. If the grade is satisfactory (above the pass point), proceed
as directed below; otherwise, return to Come Into My Trading Room
and study the relevant chapters.
4. Go to the Exit Question page, which shows an updated unmarked
daily chart. Quickly cover it with a sheet of paper.
5. Gently move the sheet from left to right, until you uncover the ver-
tical arrow marking the entry into the trade; from that day onward,
move the sheet to the right very slowly, one day at a time, stopping
after you uncover each day.
6. Whenever you see an exit point, based on chart or indicator signals,
mark it; whenever you see a likely reentry point, mark it also. Most
charts have more than one exit and reentry point.
7. Once you reach the right edge of the chart, go to the Exit Answer
page and rate your performance. If the grade is satisfactory (above
the pass point), proceed as directed below; otherwise, return to
Come Into My Trading Room and study the relevant chapters.
8. Proceed to the next trade and repeat the process.
QUESTIONS 145
Technical analysis is partly a science and partly an art—partly objec-
tive and partly subjective. There are two main approaches to using it in
trading—systematic and discretionary. Systematic traders test and auto-
mate every step. Discretionary traders change their tools as markets
evolve. If you are a systematic trader, you will test all the tools and
apply them in an absolutely uniform manner. As a discretionary trader,
I adjust my tools and every once in a while try to anticipate indicator
signals. The trick is to anticipate them ever so slightly, without going too
far out on a limb, and use the protection of money management.
Intelligent traders may disagree about trading signals. This is why a
professional trader is unlikely to get a perfect score on these tests. He
will bring his personality into the picture and interpret markets slightly
differently. Show me an experienced trader with independent judg-
ment, good records, and solid money management, and I will show
you a winner. What if you see some charts in a different light than I do?
I fear an avalanche of e-mails with questions, and not enough hours
in the day to answer all. The only place where we can butt heads and
argue about trades late into the night is in Traders’ Camps. Bring in your
differences, and we will resolve them. Just be sure to keep good records
of your decisions. Now, let’s go look for trades!
146 CASE STUDIES
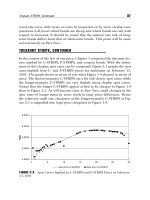
Trade 1: Oracle Corp ORCL—Entry Question
QUESTIONS 147
Chart Q1-a 26-week and 13-week EMAs, 12-26-9 MACD-lines and MACD-
Histogram
Chart Q1-b 22-day and 13-day EMAs, 12-26-9 MACD-lines and MACD-
Histogram, 2-day Force Index
Mark at least two trading signals on the weekly as well as the daily charts, and make
a trading decision at the right edge. Do not turn this page or look at the Answers pages
until you have documented your decision.
Answer on pages 164–165.
Trade 1: Oracle Corp ORCL—Exit Question
148 CASE STUDIES
You do not get paid for entering trades, you get paid for exiting them.
Beginners spend most of their time looking for trades, but give little
thought to how they will exit. It is a fact that most trades are profitable
at some point, yet despite that, most beginners lose money on most
trades. They lose because they fail to exit at the right time.
This exercise is designed to help you learn to find exit and reentry
points. Cover this chart with a sheet of paper so that you can see only
from its left edge to the point where you entered the trade. Start moving
the sheet of paper slowly to the right. Uncover one day at a time and
stop to look and analyze what you see. If you think that you see a good
exit point, mark it on the chart. Later, on the Answers pages, you will
see several exit and reentry points. You will be able to compare notes
and grade yourself.
entry
long
Chart Q1-c 22-day and 13-day EMAs, channel, 12-26-9 MACD-lines and
MACD-Histogram, and 2-day Force Index
Answer on pages 166–167.
Trade 2: Sun Microsystems SUNW—Entry Question
QUESTIONS 149
Mark at least two trading signals on the weekly as well as the daily charts and make a
trading decision at the right edge. Do not turn this page or look at the Answers pages
until you have documented your decision.
Answer on pages 168–169.
Chart Q2-a 26-week and 13-week EMAs, 12-26-9 MACD-lines and MACD-
Histogram
Chart Q2-b 22-day and 13-day EMAs, 12-26-9 MACD-lines and MACD-
Histogram, 2-day Force Index
Trade 2: Sun Microsystems SUNW—Exit Question
150 CASE STUDIES
entry
long
Chart Q2-c 22-day and 13-day EMAs, channel, 12-26-9 MACD-lines and
MACD-Histogram, 2-day Force Index
Cover this chart with a sheet of paper and start moving it from left to right
until you reach the vertical arrow, marking the day in October when we
went long SUNW. Continue to uncover the chart, one day at a time.
Analyze each day and mark exit and reentry points. Later, on the Answers
pages, you will be able to compare notes and grade yourself.
Putting on a trade is like jumping into a fast-moving river. You have
more control over an entry than over an exit. You can wait to jump in
until you see a perfect or near-perfect point. Getting out is much harder
because of the fast current and rocky shores. When you wait for an
entry, your only risk is a missed opportunity, but there are many oppor-
tunities in the markets. Exits are much more demanding—you want to
allow a stock to move in your favor to its full potential, but you do not
want to risk losing your paper profits.
Answer on pages 170–171.
QUESTIONS 151
Trade 3: Kroll Inc KROL—Entry Question
This company provides corporate security, and it popped up on my
“radar screen” shortly after the September 11 disaster.
Mark at least two trading signals on the weekly as well as the daily charts and make a
trading decision at the right edge. Do not turn this page or look at the Answers pages
until you have documented your decision.
Answer on pages 172–173.
Chart Q3-a
Chart Q3-b
Trade 3: Kroll Inc KROL—Exit Question
As usual, cover this chart with a sheet of paper and move it slowly from
left to right, one day at a time. Analyze each day and mark likely exit
and reentry points—there are always several of those per trade. Later,
on the Answers pages we will review them, and you will earn points for
each correctly identified exit point.
We went long KROL in the area marked by an arrow in September.
Now we have to decide where to get out of this trade. This is a difficult
question in a trade that is based partly on fundamentals and partly on
technical factors. The fundamental underpinnings mean that we have to
give the bulls the benefit of the doubt and not be in too much of a hurry
to exit. At the same time, we must put the ultimate trust in our techni-
cal indicators and use them to exit a trade.
152 CASE STUDIES
entry
long
Chart Q3-c 22-day and 13-day EMAs, channel, 12-26-9 MACD-lines and
MACD-Histogram, 2-day Force Index
Answer on pages 174–175.
Trade 4: Imclone Systems IMCL—Entry Question
QUESTIONS 153
Imclone is a biopharmaceutical company, working on cancer treatments.
Answer on pages 176–177.
Chart Q4-a 26-week and 13-week EMAs, 12-26-9 MACD-lines and MACD-
Histogram
Chart Q4-b 22-day and 13-day EMAs, 12-26-9 MACD-lines and MACD-
Histogram, 2-day Force Index
Cover this chart with a sheet of paper and move it slowly from left to
right, one day at a time. Mark entry and exit points and jot down a com-
ment about each. Later, on the Answers pages, we will review them,
and you’ll earn points for each correctly identified exit or reentry point.
We went long IMCL in the area marked by an arrow in August. Chart
patterns and indicator signals can help us decide where to take profits
and where to reestablish longs. When you look at an old chart, the
benefit of hindsight makes it seem very easy to hold for the long haul.
If you cover up the chart and advance one day at a time, you will recre-
ate some of the uncertainty and the psychological pressures of trading;
taking short-term profits will suddenly look a lot more appealing.
154 CASE STUDIES
Trade 4: Imclone Systems IMCL—Exit Question
entry
long
Chart Q4-c 22-day and 13-day EMAs, channel, 12-26-9 MACD-lines and
MACD-Histogram, 2-day Force Index
Answer on pages 178–179.
Trade 5: Wheat—Entry Question
QUESTIONS 155
The rules of technical analysis work in any freely traded market, including
stocks, futures, and currencies—it can be applied to most trading vehicles.
Many popular technical tools were originally developed for commodities
and only later migrated to the stock market.
Answer on pages 180–181.
Chart Q5-a
Chart Q5-b
Trade 5: Wheat—Exit Question
156 CASE STUDIES
entry
long
Chart Q5-c 22-day and 13-day EMAs, channel, 12-26-9 MACD-lines and
MACD-Histogram, 2-day Force Index
The best way to test a trading system is by clicking through your data
one day at a time. To learn from a chart, cover it with a sheet of paper,
moving it from left to right, a day at a time. Mark all entry and exit points
and jot down a comment about each. Later, on the Answers pages, you’ll
earn points for each correctly identified exit or reentry point.
We went long wheat in the area marked by an arrow in October. Use
chart patterns and indicator signals to decide where to take profits and to
reestablish longs. If you cover up the chart and advance one day at a time,
you will recreate some of the uncertainties and pressures of trading.
Answer on pages 182–183.
Trade 6: Vimpel Communications VIP—Entry Question
QUESTIONS 157
Mark at least two trading signals on the weekly and daily charts. Answer on pages 184–185.
Here’s another set of charts that reflects the universality of technical
analysis. The charts show a Russian stock listed on the NYSE—a cell
phone company from Moscow. I sometimes think that when we trade
VIP, comrades Lenin and Stalin take a few spins in their graves.
Chart Q6-a
Chart Q6-b
Trade 6: Vimpel Communications VIP—Exit Question
158 CASE STUDIES
entry
long
Chart Q6-c 22-day and 13-day EMAs, channel, 12-26-9 MACD-lines and
MACD-Histogram, 2-day Force Index
Cover this chart with a sheet of paper and move it, one bar a time, from
left to right. Mark all entry and exit points and jot down a comment
about each. Once finished, review the Answers pages and award your-
self points for each correctly identified exit or reentry point.
We went long VIP near the fast EMA, in the area marked by an arrow
in October. Use chart patterns and indicator signals to decide where
to take profits and where to reestablish longs. Covering up the chart
and opening it up one day at a time allows you to recreate some of the
pressure of trading this seemingly exotic stock.
Answer on pages 186–187.
Trade 7: International Business Machines IBM—Entry Question
QUESTIONS 159
Mark at least two trading signals on the weekly as well as the daily charts and make a
trading decision at the right edge.
Answer on pages 188–189.
IBM, “Big Blue”, is widely held by institutions. It is a charter member of
the blue chip club. It can swing, but it is unlikely to embark on a wild
rally or suffer a bone-crashing decline like so many “cats and dogs.”
Chart Q7-a
Chart Q7-b