Broadband Circuits for Optical Fiber Communication phần 2 pot
Bạn đang xem bản rút gọn của tài liệu. Xem và tải ngay bản đầy đủ của tài liệu tại đây (3.52 MB, 46 trang )
30
PHOTODETECTORS
will be no signal and therefore no noise for the zeros. Let’s suppose that the received
optical signal is
DC
balanced, has a high extinction ratio, and has the average power
P.
It then follows that the optical power for the ones is
P1
=
2Fand that for the zeros
is
PO
-
0.
Thus with
Eq.
(3.5), we find the noise currents for zeros and ones to be
The precise value of
ii.plN.o
depends on the extinction ratio and dark current. Fig-
ure
3.4
illustrates the signal and noise currents produced by a p-i-n photodetector in
response to an optical
NRZ
signal with
DC
balance and high extinction. Signal and
noise magnitudes are expressed in terms of the average received power
F.
0100110
Fig.
3.4
Signal and noise currents
from
a
p-i-n photodetector.
Dark Current.
The p-i-n photodetector produces a small amount
of
current even
when it is in total darkness. This so-called
dark current, IDK, depends on the junction
area, temperature, and processing, but usually is less than 5nA for a high-speed
InGaAs photodetector. The dark current and its associated shot-noise current interfere
with the received signal. Fortunately, in high-speed p-i-n receivers (2.5-40 Gb/s),
this effect usually is negligible. To demonstrate this, let’s calculate the optical power
for which the worst-case dark current amounts to
10%
of the signal current. As long
as our received optical power is larger than this, we are fine:
With the values
R
=
0.8
A/W and IDK(max)
=
5
nA, we findP
>
-42 dBm. We see
later that high-speed p-i-n receivers require much more signal power than this to work
at an acceptable bit-error rate, and therefore we don’t need to worry about dark current
in such receivers. However, in high-sensitivity receivers (at low speeds and/or with
APDs), the dark current can be an important limitation. In Section 4.5, we formulate
the impact of dark current on the receiver performance in a more precise way.
Saturation Current.
Whereas the shot noise and the dark current define the lower
end of the p-i-n detector’s dynamic range, the
saturation current defines the upper end.
At very high optical power levels, a correspondingly high density
of
electron-hole
pairs is produced, which generates a space charge that counteracts the bias-induced
AVALANCHE PHOTODETECTOR
31
drift field. The consequences are a decreased responsivity (gain compression) and
reduced bandwidth. This effect is particularly important in receivers with optical
preamplifiers, such as, erbium-doped fiber amplifiers (EDFAs), which readily can
produce several
10
mW of optical power at the p-i-n detector. Typical values for the
saturation current are in the
10
to
76
mA
range
[64].
3.2
AVALANCHE PHOTODETECTOR
The basic structure of the
avalanche photodetector
(APD) is shown in Fig.
3.5.
Like
the p-i-n detector, the avalanche photodetector is a reverse biased diode. However, in
contrast to the p-i-n photodetector, it features an additional layer, the
multiplication
region.
This layer provides gain through avalanche multiplication of the electron-hole
pairs generated in the i-layer, also called the
absorption region.
For
the avalanche
process to set in, the APD must be operated at a fairly high reverse bias of about
40
to
60
V.
As we said earlier, a p-i-n photodetector can be operated at a voltage
of
about
5
to
IOV.
Light
n
InP
1
Multiplication
Region
Absorption
I
i
InGaAs
1-
Region
Fig.
3.5
Avalanche photodetector (schematically).
Similar to the p-i-n detector, InGaAs commonly is used for the absorption region
to make the APD sensitive at long wavelengths
(1.3
and
1.55
pm). The multiplication
region, however, typically is made from the wider bandgap InP material, which can
sustain a higher electric field.
Responsivity.
The gain of the
APD
is called
avalanche gain
or
multiplication factor
and is designated by the letter
M.
A typical value for an InGaAs APD is
M
=
10.
The light power
P
therefore is converted to electrical current
IAPD
as
IAPD
=
M
.
RP,
(3.9)
where
R
is the responsivity
of
the APD without avalanche gain, which is similar to
the responsivity
of
a p-i-n detector. Assuming that
R
=
0.8
A/W, as in our example
for the p-i-n detector, and that
M
=
10,
the APD generates
8
A/W. Therefore, we
also can say that the APD has an effective responsivity
RAPD
=
8
A/W, but we have
to be careful to avoid confusion with the responsivity
R
in
Eq.
(3.9),
which does not
include the avalanche gain.
32
PHOTODETECTORS
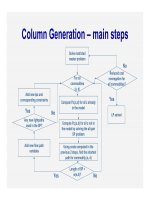
As
we can see from Fig.
3.6,
the avalanche gain
M
is a sensitive function of the
reverse bias voltage. Furthermore, the avalanche gain also is a function of temperature
and a well-controlled bias voltage source with the appropriate temperature dependence
is required to keep the gain constant. The circuit in Fig.
3.7
uses a thermistor (ThR)
to measure the
APD
temperature and a control loop to adjust the reverse bias voltage
VAPD
at a rate of
0.2%/"C
to compensate for the temperature coefficient
of
the
APD
[2].
Sometimes, the dependence
of
the avalanche gain on the bias voltage is exploited
to implement an
automatic gain control
(AGC)
mechanism that acts right at the
detector. Such an
AGC
mechanism can increase the dynamic range of the receiver.
Reverse
Bias
Voltage
V,,
[V]
Fig.
3.6
Avalanche gain and excess noise factor as a function
of
reverse voltage
for
a typical
InGaAs
APD.
Receiver
Fig.
3.7
Temperature-compensated APD bias circuit.
Avalanche
Noise.
Unfortunately, the
APD
not only provides more signal but also
more noise than the p-i-n detector, in fact,
more
noise than simply the amplified shot
noise that we are already familiar with. On a microscopic level, each primary carrier
created by a photon is multiplied by a random gain factor: for example, the first
photon ends up producing nine electron-hole pairs, the next one
13,
and
so
on. The
avalanche gain
M,
introduced earlier, is really just the
average
gain value. When
taking the random nature
of
the gain process into account, the mean-square noise
AVALANCHE PHOTODETECTOR
33
current from the APD can be written as
[5]
where
F
is the so-called
excess noise factor
and
Ip1~
is the primary photodetector
current, that is, the current before avalanche multiplication
(Ip”
=
ZAPD/M).
Equiv-
alently,
Ipl~
can be understood as the current produced in a p-i-n photodetector with
responsivity
R
that receives the same amount of light as the APD under discussion.
In the ideal case, the excess noise factor is one
(F
=
I),
which corresponds to the
situation where we have a deterministic amplification of the shot noise.
For
a con-
ventional InGaAs APD, this excess noise factor is more typically around
F
=
6.
[-+
Problem
3.51
As
we can see from Fig.
3.6,
the excess noise factor
F
increases with increasing
reverse bias roughly tracking the avalanche gain
M.
In fact, it turns out that
F
and
M
are
related as follows
[5]:
(3.1
1)
where
kA
is the so-called
ionization-coeficient ratio.
If only one type of carrier, say
electrons, participates in the avalanche process, then
kA
=
0
and the excess noise
factor is minimized. However, if electrons and holes both are participating, then
kA
>
0
and more excess noise is produced.
For
an InGaAs APD,
kA
=
0.5
to
0.7
and
the excess noise factor increases almost proportional to
M,
as can be seen in Fig.
3.6;
for a silicon APD,
kA
=
0.02
to
0.05
and the excess noise factor increases much more
slowly with
M
[5].
Thus from a noise point of view, the silicon APD is preferable,
but as we know, silicon is not sensitive at the long wavelengths commonly used
in telecommunication applications. Researchers are working on long-wavelength
APDs with better noise performance than the conventional InGaAs APD. They do
so
by using materials with a lower
kA
(e.g., InAIAs) and structures that reduce the
randomness in the avalanche process.
Because the avalanche gain can be increased only at the expense of producing
more noise in the detector
(Eq.
(3.1
I)),
there is an optimum APD gain at which the
receiver becomes most sensitive. As we see in Section
4.3,
the value
of
this optimum
gain depends. among other things, on the APD material
(k~).
From what has been said, it should be clear that the APD noise is signal dependent,
just like the p-i-n detector noise. The noise currents for zeros and ones, given a DC-
balanced
NFU
signal with average power and high extinction, can be found with
Eq.
(3.10):
-
LAPD.O
.2
0
and
(3.12)
I,~,~~~.~
.2
=
F
’
M2
.4qRF.
BW,.
(3.13)
-
-
The precise value of
ii.ApD,o
depends on the extinction ratio and dark current.
34
PHOTODETECTORS
Dark Current.
Similar to the p-i-n detector, the APD also suffers from a dark
current. The so-called
primary dark current,
IDK,
is amplified, just like a signal
current, to
M
.
IDK
and produces the avalanche noise
F
.
M2
.2qlDK.
BW,.
Typically,
IDK
is less than
5
nA for a high-speed InGaAs APD
[5].
We again can use Eq. (3.8)
to judge if this amount of dark current is harmful. With the values
R
=
0.8
A/W and
IDK(max)
=
5
nA, we find that we are fine as long as
P
>
-42 dBm. Most high-
speed APD receivers require more signal power than this to work at an acceptable
bit-error rate, and dark current is not a big worry.
Bandwidth.
Increasing the reverse bias not only increases the gain and the excess
noise factor, but also reduces the signal
bandwidth.
Similar to a single-stage amplifier,
the product of gain and bandwidth remains approximately constant and therefore can
be used to quantify the speed of an APD. The gain-bandwidth product of a typical
high-speed APD is in the range of
100
to 150GHz. The equivalent AC circuit for
an APD is similar to those shown for the p-i-n detector in Fig. 3.3, except that the
current source is now given by
iApD(t)
=
M
.
Rp(t)
and the parasitic capacitances
typically are somewhat larger.
APDs are in widespread use for receivers up to and including 2.5 Gb/s. However,
it is challenging
to
fabricate APDs with a high enough gain-bandwidth product to be
useful at 10 Gb/s and above. For this reason, high sensitivity 10-Gb/s+ receivers
often use optically preamplified p-i-n detectors. These detectors are more expensive
than APDs but feature superior speed and noise performance.
3.3
P-I-N DETECTOR WITH OPTICAL PREAMPLIFIER
A higher performance alternative to the APD is the p-i-n detector with optical preamp-
lifier or simply the
optically preamplijied p-i-n detector.
The p-i-n detector operates
at high speed, whereas the optical preamplifier provides high gain over a huge band-
width (e.g., more than
10
nm corresponding to more than 1,250 GHz), eliminating
the gain-bandwidth trade-off known from APDs. Furthermore, the optically prearnp-
lified p-i-n detector has superior noise characteristics when compared with an APD.
However, the cost of a high-performance optical preamplifier, such as an EDFA,
is substantial.
The optical preamplifier can be implemented with a so-called
semiconductor
op-
tical amplifier
(SOA), which is small and can be integrated together with the p-i-n
detector on the same InP substrate. However, for best performance, the
erbium-doped
fiber amplijier
(EDFA), which operates in the important 1.55-pm band and features
high gain and low noise, is a popular choice. See Fig. 3.8 for the operating principle
of an EDFA-preamplified p-i-n detector. An optical coupler combines the received
optical signal (input) with the light from a continuous-wave pump laser. The pump
laser typically provides a power of a few lOmW at either the 0.98-pm or 1.48-pm
wavelength, where the 0.98-prn wavelength is preferred for low-noise preamplifiers.
The signal and the pump light are sent through an erbium-doped fiber of about
10
m,
where the amplification takes place by means of stimulated emission. An optical
P-I-N DETECTOR WITH OPTICAL PREAMPLIFIER
35
30
-
-
rn
-
Q
d
lo
isolator prevents reflections
of
the optical signal from entering back into the ampli-
fier, which would cause instability. An optical filter with (noise) bandwidth
BWo
reduces the noise
of
the amplified optical signal before
it
is converted to an electrical
signal with a p-i-n photodetector. Optical noise is generated in the EDFA because
of
a process called
amplijied spontaneous emission
(ASE). The power spectral density
of this ASE noise,
SASE,
is nearly white.3 Thus, we can calculate the optical noise
power that reaches the photodetector as
PASE
=
SASE
.
BWo
.
To keep
PASE
low, we
want to use a narrow optical filter.
-15
I
LA
S
w
U
10
2
-5
t
0
z
Erbium
Fiber
Isolator Filter
'%
Coupler
p-i-n
Photodetector
Input
Fig.
3.8
A
p-i-n photodetector with erbium-doped fiber preamplifier (schematically).
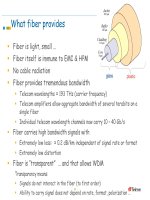
Responsivity.
One of the main characteristics of the optical amplifier is its power
gain,
G.
The gain value
of
an EDFA depends on the length
of
the erbium-doped
fiber and increases with increasing pump power, as shown in Fig.
3.9.4 A
typical
value is
G
=
100,
corresponding to a 20-dB gain. The current produced by the p-i-n
photodetector,
IOA,
expressed as a function
of
the optical power at the
input
of
the
preamplifier,
P,
is
IOA
=
G
.
RP,
(3.14)
where
R
is the responsivity of the p-i-n photodetector.
Pump Power
Fig,
3.9
EDFA
gain and noise figure as a function of the pump power.
31n the following,
SASE
always refers
to
the noise spectral density in
both
polarization modes, that
is,
SASE
=
2.
SASE.
where
SiSE
is the noise spectral density in a single polarization mode.
4The pump power in Fig. 3.9 is given in multiples of the pump saturation power
[5].
36
PHOTODETECTORS
Because the gain depends sensitively on the pump power, EDFA modules fre-
quently incorporate a microcontroller, which adjusts the power of the pump laser.
An automatic gain control (AGC) mechanism can be implemented by controlling the
pump power in response to a small light sample split off from the amplified output
signal
[29].
Such an AGC mechanism can increase the dynamic range
of
the receiver.
Whereas the APD improved the responsivity by about one order of magnitude
(M
=
lo),
the optically preamplified p-i-n detector can improve the responsivity by
about two orders of magnitude
(G
=
100)
relative to a regular p-i-n detector. So,
given that
72
=
0.8A/W and
C
=
100,
the effective responsivity
of
the combined
preamplifier and p-i-n detector is 80A/W.
AS€
Noise.
As we said earlier, the EDFA not only amplifies the input signal as
desired, but also produces an optical noise known as ASE noise. How is this optical
noise converted to an electrical noise in the photodetector?
If
you thought that it
was odd that optical signal
power
is converted to a proportional electrical signal
current,
wait until you hear this: because the photodetector responds to the intensity,
which is proportional to the
square
of the fields (cf. Fig.
2.5),
the optical noise gets
converted to
cwo
electrical beat-noise components. Roughly speaking, we get the
terms corresponding to (signal
+
noise)2
=
(signal)2
+
2.
(signal. noise)
+
(noise)2.
The first term is the desired electrical signal, the second term is the so-called
signal-
spontaneous beat noise,
and the third term is known as the
spontaneous-spontaneous
beat noise.
A detailed analysis reveals that the two electrical noise terms are
[5]
(3.15)
The first term in Eq.
(3.15),
the signal-spontaneous beat noise, usually is the dominant
term. This noise component is proportional to the signal power
Ps
at the output of
the EDFA
(Ps
=
G
P).
So,
a signal-independent optical noise density
SASE
generates
a
signal-dependent
noise term in the electrical domain! Furthermore, this noise term
is
not
affected by the optical filter bandwidth
BWo,
but the electrical bandwidth
SW,,
does have an effect. The second term in
Eq.
(3.15),
the spontaneous-spontaneous
beat noise, may be closer to your
expectation^.^
Similar to the signal component, this
noise current component is proportional to the optical noise power. Moreover, the
optical filter bandwidth does have an effect on the spontaneous-spontaneous beat noise
component. In addition to the ASE noise terms
in
Eq
(3.15).
the p-i-n photodetector
also produces shot noise terms. However, the latter noise contributions are
so
small
that they usually can be neglected.
[-+
Problem
3.61
'ln
the literature, spontaneous-spontaneous beat noise is sometimes given as
4R2S,fsEBWoSq,
[5]
and
sometimes
a.
2R2S&,BWoBW,
[
1161
(SASE
=
SASE/?.
the ASE spectral density in a single polarization
mode). which may be quite confusing. It seems that the first equation applies to EDFA/p-i-n systems
without
a
polarizer in between the amplifier and the
p-i-n
detector, whereas the second equation applies to
EDFNp-i-n systems
with
a polarizer.
In
practice, polarizers are not usually
used
in EDFA/p-i-n systems
because this would require a polarization controlled signal. We thus are using the
4R2S,fsEBWoBW,,
expression here.
P-I-N DETECTOR WITH OPTICAL PREAMPLIFIER
37
By now you have probably developed a healthy respect for the unexpected ways
optical quantities translate to the electrical domain. Now let’s see what happens to the
signal-to-noise ratio
(SNR). For a continuous-wave signal with the optical power
Ps
incident on the photodetector, the signal power in the electrical domain is
ii
=
R2
P;.
The electrical noise power,
ii,AsE,
for the same optical signal
is
given by
Eq.
(3.15).
With
PA~E
=
SASE
.
BWo,
the ratio of these two expressions
(i:/iz.AsE)
becomes
-
-
(3.16)
Now
PSI PA~E
also is known as the
optical signal-to-noise ratio
(OSNR)
at the output
of
the EDFA measured in the optical bandwidth
BWo
.
If the OSNR is much larger
than
112
(-3
dB),
we can neglect the contribution from spontaneous-spontaneous
beat noise (this is where the
1
/2 in the denominator comes from) and we end up with
the surprisingly simple result
BWO
Bwo
w
OSNR.
-
OSNR~
SNR
=
OSNR
-k
1
/2 2BW,
2BW,
*
(3.17)
This means that the electrical SNR can be obtained simply by scaling the OSNR
with the ratio
of
the optical and
2x
the electrical bandwidth. For example, for a
receiver with
BW,
=
7.5
GHz,
an OSNR
of
14.7 dB measured in a 0.1-nm band-
width
(12.5
GHz
at
h
=
1.55 wm) translates into an electrical SNR
of
13.9 dB.
In
Section 4.3, we use Eq. (3.17) to analyze optically amplified transmission systems.
[+
Problem
3.71
Noise
Figure
of
an
Optical Amplifier.
Just like electrical amplifiers, optical am-
plifiers are characterized by a noise figure
F.
A typical value for an EDFA noise
figure is
F
=
5
dB, and the theoretical lower limit turns out to be 3 dB, as we see
later. But
what
is
the meaning
of
noise figure
for
an
optical
amplifier?
In an electrical system, the noise figure is defined as the ratio
of
the “total output
noise power” to the “fraction of the output noise power due to the thermal noise of the
source resistance.” Usually, this source resistance is
50
s2.
(We discuss the electrical
noise figure
in
more detail
in
Section 6.2.3.) Now, an optical amplifier doesn’t get its
signal from a
504
source, and
so
the definition of its noise figure cannot be based
on thermal
50-s2
noise. What fundamental noise is it based
on?
The quantum (shot)
noise of the optical source!
The noise figure of an optical amplifier is defined as the ratio of the “total output
noise power” to the “fraction of the output noise powerdue to
the
quantum (shot) noise
of
the optical source.” The output noise power
is
measured with a p-i-n photodetector
that has a perfect quantum efficiency
(q
=
1)
and is quantified as the detector’s
38
PHOTODETECTORS
-
mean-square noise current.6
If
we write the total output noise power as i:.oA and the
fraction that is due to the source as i:.oA,s, then the noise figure is
F
=
i:,oA/i:.oA%s.
Figure 3.10 illustrates the various noise quantities introduced above. At the top, an
ideal photodetector is illuminated directly by the optical source and produces the DC
current
IPIN
and the mean-square shot-noise current ii.prN
=
2qIplN
.
BW,.
In the
middle, the signal from the optical source is amplified with a noiseless, deterministic
amplifier
with
gain
G.
This amplifier multiplies every photon from the source into ex-
actly
G
photons. The ideal photodetector now produces the DC current
IOA
=
GI~IN
and the mean-square shot-noise current
i:,oA.s
=
G2 .2qIpIN.
BW,
(cf. Problem 3.5).
Note that this quantity represents the “fraction of the output noise power due to the
source.” At the bottom, we replaced the noiseless amplifier with a real amplifier with
gain
G
and noise figure
F,
which produces the “total output noise power.” According
to the noise figure definition, the ideal photodetector now produces a mean-square
noise current that is
F
times larger than before:
-
-
-
-
ii,oA
=
F
.
G2
.
2qIpIN
.
BW,,,
(3.18)
where
Ip“
is the current produced by an ideal p-i-n photodetector receiving the same
amount of light as the optical preamplifier. Note that this noise current is still based
on an ideal photodetector. How large is the output noise current of an optical amplifier
followed by a
real
p-i-n detector with
q
<
l? We have to reduce
i:.oA
by the factor
q2
while taking into account that
Ip“
also reduces
by
q;
thus, we obtain the output
noise current
-
I,,OA
.2
=
qF
’
G2
.
2qIPIN.
BWn.
(3.19)
As usual, the noise current on zeros and ones is different and, given a DC-balanced
-
NRZ
signal with average power Pand high extinction, we find with Eq. (3.19)
-
i:.oA,o
x
0
and (3.20)
i:,oA.,
=
qF.
G2
-4qRF.
BW,.
(3.21)
The precise value of
i:.oA,o
depends on the extinction ratio, dark current, and
spon taneous-spontaneous beat noise.
It is instructive to compare the noise expression Eq. (3.10) for the APD with
Eq.
(3.19) for the optically preamplified p-i-n detector. We discover that the ex-
cess noise factor
F
of
the APD plays the same role as the product
qF
of
the opti-
cal preamplifier!
-
-
Noise Figure
and
ASE
Noise.
In
Eq. (3.15), we expressed the electrical noise
in
terms
of
the optical
ASE
noise, and
in
Eq. (3.18), we expressed the electrical noise
6An
equivalent definition
for
the noise figure
of
an optical amplifier is the ratio
of
the “input SNR” to the
“output SNR.” where both SNRs are meaured
in
the electrical domain with ideal photodetectors
(a
=
1)
and where the input SNR is based
on
shot noise only.
P-I-N DETECTOR WITH OPTICAL PREAMPLIFIER
39
Fig.
3.70
Definition of the noise figure for an optical amplifier.
in terms of the amplifier’s noise figure. Now let’s combine the two equations and
find out how the noise figure is related to the
ASE
noise spectral density. With the
assumption that all electrical noise at the output of the optically preamplified p-i-n
detector is described by the terms in
Eq.
(3.15),
i:,oA
=
ii,AsE,
that is, ignoring shot
noise contributions, we find
-
-
(3.22)
The first term is caused by signal-spontaneous beat noise, whereas the second term is
caused by spontaneous-spontaneous beat noise. Note that this noise figure depends
on the input power
P
and becomes infinite for
P
-+
0.
The reason for this is that
when the signal power goes to zero, we are still left with the spontaneous-spontaneous
beat noise, whereas the noise due to the source does go
to
zero.
[-+
Problem
3.81
Sometimes a restrictive type of noise figure
F
is defined that corresponds to just
the first term
of
Eq.
(3.22):
(3.23)
This
noise
figure
is
known
as
signal-spontaneous beat noise
limited
noisefigure
or
optical
noisefigure
and is independent
of
the input power.
For
sufficiently large input
power levels
P
and small optical bandwidths
BWo,
it is approximately equal to the
noise figure
F
in
Eq.
(3.22).
(The fact that there are two similar but not identical
noise figure definitions can be confusing at times.)
Let’s go one step further.
A
physical analysis
of
the
ASE
noise process reveals the
following expression for its power spectral density
[5]:
(3.24)
where
N1
is the number
of
erbium atoms in the ground state and
N2
is the number
of
erbium atoms in the excited state. The stronger the amplifier is “pumped,” the more
40
PHOTODETECTORS
atoms will be in the excited state, and thus for a strongly pumped amplifier, we have
N2
>>
N1.
Combining Eq. (3.23)for theopticalnoise figure withEq. (3.24) and taking
G
>>
1, we find the following simple approximation for the EDFA noise figure(s):
(3.25)
This equation means that increasing the pump power will decrease the noise figure
until it reaches the theoretical limit of 3 dB (cf. Fig. 3.9).
Negative Noise Figure?
What would an optical amplifier with a
negative
noise
figure (lolog
F
<
OdB,
F
<
1)
do? Placing such an amplifier in front of a p-i-n
detector would
improve
the signal-to-noise ratio over that of an unamplified p-i-n
detector. This sounds like a tricky thing to do. Now you may be surprised to learn
that you can actually
buy
optical amplifiers with negative noise figures. You can buy
a Raman amplifier with
F
=
-2
dB
or
even less, if you
are
willing to pay more!
Consider the following: a fiber span with loss
1
f
G
has a noise figure
of
G.
The
same fiber span followed by an EDFA with noise figure
F
has a combined noise figure
of
G
.
F.
You can prove both facts easily with the noise figure definition given earlier.
For
example, a 100-km fiber span with 25-dB
loss
followed by an
EDFA
with a noise
figure
of
5
dB has a total noise figure of 30dB.
[-+
Problem 3.91
Now, there is a type of optical amplifier, the
Raman amplijier,
that can provide
distributed gain
in
the fiber span itself. The fiber span is “pumped’ from the receive
end with a strong laser
(1
W or
so)
and
stimulated Raman scattering
(SRS), one of the
nonlinear fiber effects, provides the gain. For example, by pumping the 100-km fiber
span from above the loss may reduce from
25
dB to
15
dB and the noise figure may
improve from
25
dB to 23 dB. How do you sell such an amplifier? Right, you compare
it with a lumped amplifier such as an EDFA and say it has a gain of
10
dB and a noise
figure
of
-2
dB.
O.K.,
I’ll order one but please ship it without the fiber span
.
. .
3.4
SUMMARY
Three types
of
photodetectors commonly are used for optical receivers:
0
The p-i-n photodetector with a typical responsivity in the range of 0.6 to
0.9
A/W (for an InGaAs detector) is used mostly in short-haul applications.
0
The avalanche photodetector (APD) with a typical responsivity in the range of
5
to
20
A/W
(for an InGaAs detector) is used mostly in long-haul applications
up to
10Gb/s.
0
The optically preamplified p-i-n detector with a responsivity in the range of 6
to 900 A/W is used mostly in ultra-long-haul applications and for speeds at or
more than
10
Gb/s.
All three detectors generate a
current
that is proportional to the received
optical
power,
that is,
a
3-dB change
in
optical power results in
a
6-dB change in current.
SUMMARY
41
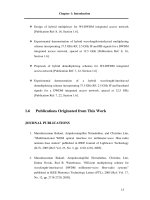
Fig.
3.71
A 10-Gb/s photodetector and
TIA
in
a 16-pin surface-mount package with a
single-mode fiber pigtail (1.6cm
x
1.3 cm
x
0.7cm). Reprinted by permission from Agere
Systems, Inc.
Fig.
3.12
A
packaged two-stage erbium-doped fiber amplifier with single-mode fiber pigtails
for the input, output, interstage access, and tap monitorports
(12
cm
x
10
cm
x
2
cm). Reprinted
by permission from Agere Systems, Inc.
42
PHOTODETECTORS
All
three detectors produce a
signal-dependent
noise current, specifically, the noise
power
i&,
grows proportional to the signal current
IPD
(neglecting the spontaneous-
spontaneous beat noise of the optically preamplified p-i-n detector).
As
a result,
received one bits contain more noise than zero bits. The p-i-n detector produces shot
noise, which often is negligible
in
digital transmission systems. The
APD
produces
avalanche noise, quantified by the excess noise factor
F.
The optical preamplifier
produces amplified spontaneous emission
(ASE)
noise, which is converted into two
electrical noise components by the p-i-n detector. The noise characteristics of the
optical preamplifier are specified by a noise figure
F.
-
3.5
PROBLEMS
3.1
Optical
vs.
Electrical
dBs.
A p-i-n photodetector in a 1.55-pm transmission
system converts the received optical signal to an electrical signal. By how many
dBs is the latter signal attenuated if we splice an additional
40km
of
standard
SMF
into the system?
3.2
Power Conservation in the Photodiode.
The p-i-n photodetector produces a
current that is proportional to the received optical power
P.
When this current
runs
through a resistor, it produces a voltage drop that also is proportional to
the received optical power. Thus, the electrical power dissipated in the resistor
is
proportional to
P2.
We conclude that
for
large values
of
P,
the electrical
power will exceed the received optical power! (a)
Is
this a violatian
of
energy
conservation? (b) What can you say about the maximum forward-voltage drop,
VF,
of
a photodiode?
3.3
Photodetector
vs.
Antenna.
An ideal photodetector
(r]
=
1)
and antenna
both are exposed to the same continuous-wave electromagnetic radiation at
power level
P.
(a) Calculate the power level
P
at which the signal from the
photodetector becomes equal
to
the
rms
value
of
the shot noise. (b) Calculate
the power level
P
at which the
rms
signal level from the antenna becomes equal
to the
rms
value of the antenna’s thermal noise. (c) How do these power levels
(sensitivities) for the photodetector and the antenna compare?
3.4
Shot Noise.
The current produced by a p-i-n photodetector contains shot noise
because the current consists
of
a
stream
of
randomly generated, point-like,
charged particles (electrons). (a) Does a battery loaded by a resistor also pro-
duce shot noise? (b) Explain the answer!
3.5
Amplified Shot Noise.
An APD with deterministic amplification (every pri-
mary camer generates precisely
M
secondary carriers) produces the mean-
square noise
i;,,,,
=
M2
.
2qIplN
.
BW,,
(Eq.
(3.10)).
Now, we could argue
that the DC current produced by the APD is
MIPIN
and thus the associated
shot noise should be
i:,,
=
2q
.
(MIPIN)
.
BW,,.
What is wrong with the
latter argument?
-
-
PROBLEMS
43
3.6
Optically Preamplified p-i-n Detector.
The following equation for the
noise produced by an optically preamplified p-i-n photodetector receiving the
continuous-wave input power
P
is given in
[5]:
Explain the origin of each term in this equation.
3.7
Optical Signal-to-Noise Ratio.
Equations (3.16) and (3.17) state the relation-
ship between SNR and OSNR for a continuous-wave signal with power
Ps.
How does this expression change for
a
DC-balanced ideal NRZ-modulated
signal with high extinction and an average power
&?
3.8
Noise Figure
of
an Optical Amplifier.
(a) Derive the equation for the noise
figure of an optical amplifier, Eq.
(3.22),
but also include the effect of the shot
noise caused by the signal current (cf. Problem
3.6).
(b) What would that noise
figure be, if we could build an optical amplifier free of ASE noise?
3.9
Noise Figure
of
a Fiber.
(a) Calculate the noise figure
F
of an optical fiber
with loss
1
/C.
(b) Calculate the noise figure
F
of an optical system consisting
of an optical fiber with loss 1 /GI followed by an EDFA with gain
G2
and noise
figure
F2,
(c) Calculate the noise figure
F
of an optical system with
n
segments,
where each segment consists of an optical fiber with loss 1/G followed by an
EDFA with gain G and noise figure
F2.
This Page Intentionally Left BlankThis Page Intentionally Left Blank
4
Receiver Fundamentals
In this chapter, we present the optical receiver at the system level. The terminology
and concepts introduced here will simplify the discussion in later chapters. In the
following, we analyze how noise in the receiver causes bit errors. This leads to the
definition of the receiver sensitivity. After introducing the concept
of
power penalty,
we study the impact of the receiver’s bandwidth and frequency response on its per-
formance. The adaptive equalizer, used to mitigate distortions in the received signal,
is covered briefly. We then turn to other receiver impairments such as nonlinearity
(in
analog receivers), jitter, decision threshold offset, and sampling time offset. We
conclude with a brief description of forward error correction, a technique that can
improve the receiver performance dramatically. More information on receiver theory
can be found in
[6,42,83].
4.1
RECEIVER
MODEL
The basic
receiver model
used
in
this chapter is shown
in
Fig.
4.1.
It consists
of
(i)
a
photodetector model, (ii) a linear channel model that comprises the transimpedance
amplifier (TIA), the main amplifier (MA), and optionally a low-pass filter, and (iii) a
binary decision circuit with a fixed threshold
(VDTH).
Later in the Sections
4.7,4.10,
and
4.11
we extend this basic model to include an adaptive equalizer,
an
adaptive
decision threshold, and a multilevel decision circuit, respectively.
The
detector model
consist of a signal current source
ipg
and a noise current source
in.pD.
The characteristics
of
these two current sources were discussed
in
Chapter
3
for
the p-i-n photodetector, the avalanche photodetector (APD), and the optically
45
46
RECEIVER
FUNDAMENTALS
Fig.
4.7
Basic receiver model.
preamplified p-i-n detector. In all cases, we have found that the signal current is
linearly related to the received optical power and that the noise current spectrum is
approximately white and signal dependent.
The
linear channel
can be modeled with a complex transfer function
H
(f)
that
relates the amplitude and phase of the output voltage
ug
to those of the input cur-
rent
ipg.
This transfer function can be decomposed into a product of three transfer
functions: one for the TIA, one for the filter, and one for the MA. But for now, we
are concerned with the receiver as a whole. The noise characteristics of the linear
channel are modeled by a single noise current source
in,amp
at the input of the chan-
nel.' The noise spectrum of this source is chosen such that after passing through the
noiseless channel
H(f),
it produces the output noise spectrum of the actual noisy
channel. In practice, the linear-channel noise
in.amp
is
determined almost completely
by the input-referred noise of the TIA, which is the first element of the linear channel.
Therefore, we also call this noise the
ampliJer noise.
It is important to distinguish
the different characteristics of the detector and amplifier noise:
0
The detector noise,
in.pD,
is
nonstationary
(the
rms
value is varying with the
bit value) and
white
(frequency independent) to a good approximation. Thus,
the power spectral density (or power spectrum for short) of the detector noise
must be written as a function of
time:
Z&D(f,
t)
-
bit-value(t).
(4.1)
0
The amplifier noise,
in.amp,
is
stationary
(the
rms
value is independent of time)
and usually
is
not
white.
In Section
5.2.3,
we
calculate the spectrum of this noise
source (Eqs.
(5.37),
(5.40), and (5.41)) and we see that its two main components
are a constant part (white noise) and a part increasing with frequency like
f2.
This is the case no matter if the receiver is built with an
FET
or BJT front-
end. The power spectrum of the amplifier noise therefore can be written in the
general form
(4.2)
2
zn.amp(f)
=
a0
+
a2f2
+
. . . .
'Note that
as
a result
of
modeling the amplifier noise with only a single noise current source. rather than
a noise current and noise voltage source, the value
of
in,amp
becomes dependent
on
the photodetector
impedance,
in
particular its capacitance.
BIT-ERROR
RATE
47
The last block
in
our receiver model, the
decision circuit,
compares the output
voltage from the linear channel,
uo,
with a fixed threshold voltage,
VDTH.
If the
output voltage is larger than the threshold, a one bit is detected; if it is smaller, a zero
bit is detected. Note that
in
contrast to the linear channel, this block is
nonlinear.
The comparison in the decision circuit is triggered by a clock signal, which typically
is provided by a clock-recovery circuit.
At this point, you may wonder how appropriate a
linear
model for the TIA and
MA
really is, in particular if the MA is implemented as a limiting amplifier, which
becomes strongly nonlinear for large input signals. Fortunately, the receiver's own
noise as well as the signal levels at the sensitivity limit usually are
so
small that we
don't have to worry about nonlinearity and limiting. Thus, for the subsequent noise
and sensitivity calculations, a linear model is appropriate.
4.2
BIT-ERROR RATE
The voltage
uo
at the output of the linear channel is a superposition of the desired
signal
voltage
us
and the undesired
noise
voltage
un
(uo
=
vs+u,,).
The noise voltage
u,,,
of course, is caused by the detector noise and the amplifier noise. Occasionally,
the instantaneous noise voltage
un
(t)
may become
so
large that it corrupts the received
signal
us(t),
leading to a decision error or
bit error.
In this section, we first calculate
the
rms
value of the output noise voltage,
uLm",
and then derive the bit-error rate,
BER,
caused by this noise.
Output
Noise.
The output noise power can be written as a sum of two compo-
nents, one caused by the detector and one caused by the linear channel (amplifiers).
Let's start with the amplifier noise, which is stationary and therefore easier to deal
with. Given the input-referred power spectrum
Ii,amp(f)
for the amplifier noise and
the transfer function of the linear channel
H(f),
we can easily calculate the power
spectrum at the output:
Note that to avoid cluttered equations, we omit indices distinguishing input and output
quantities. This can be done without ambiguity because we know from our model
that a current indicates an input signal to the linear channel and a voltage indicates
an output signal from the linear channel. Integrating the noise spectrum in
Eq.
(4.3)
over the bandwidth
of
the decision circuit,
BWD,
gives us the total noise power due
to the amplifier experienced by the decision circuit:
(4.4)
This equation is illustrated by Fig. 4.2. The input noise spectrum,
I:,
which increases
with frequency as a result of the
f
component, is shaped by the
IH(f)I2
frequency
48
RECEIVER
FUNDAMENTALS
response, producing an output spectrum,
V:,
which rolls
off
rapidly at high frequen-
cies. Because of the rapid rolloff, the precise value
of
the upper integration bound
(BWD)
is uncritical and sometimes is set to infinity.
Detector Linear Channel Decision
Ckt.
I
I
Fig.
4.2
Calculation
of
the total output-referred noise.
Next, we have to deal with the nonstationary detector noise. Visualize the input
noise spectrum,
Z:.pD(f,
t),
as a two-dimensional surface located above the time and
frequency coordinates. It can be shown
[83]
that this two-dimensional spectrum is
mapped to the output of the linear channel as follows:
I/n.pD(f,
r)
=
H(f)
.
/
Z&(f,
t
-
t’)
.
h(t’)
.
e.i2sf
‘’
dt’,
(4.5)
where
h
(t) is the impulse response of the linear channel. This means that the spectrum
not only gets “shaped” along the frequency axis, but it also gets “smeared out” along
the time axis! Potentially, this is a complex situation, because the output noise during
the nth bit period depends not only on the input noise during this same period, but also
depends on the input noise during all the previous bits. In some texts, this complex
noise analysis is camed
out
to the full extent
[6,
127, 1771. However, here we take
the easy way out and assume that the input noise varies slowly compared with the
duration of the impulse response
h(t).
Under these circumstances,
Eq.
(4.5)
can be
simplified to the form of
Eq.
(4.3),
with the difference that the spectra
are
now time
dependent. Thus, the total output noise power due to the photodetector is
00
2
-co
For systems using on-off keying
(OOK),
this time-dependent output noise power can
be described by just two values, one during the reception of zeros and one during the
reception
of ones.
[+
Problem 4.11
The
rms
noise at the output of the linear channel due to both noise sources is
obtained
by adding the (uncorrelated) noise powers given in
Eqs.
(4.4)
and
(4.6)
BIT-ERROR
RATE
49
under the square root:
Uil
""(t)
=
Jm
(4.7)
=
/LBWD
IH(f)I2
.
";.po(f,
f)
+
m2.amp(f)l
df.
Again, for
OOK
systems, this time-dependent noise can be described by two values:
uiy
for the zeros and
un"l;"
for the ones.
Signal, Noise, and
Bit-Error
Rate.
Now that we have derived the value of the
output
rms
noise, how is it related to the bit-error rate? Figure
4.3
illustrates the
situation at the input
of
the decision circuit, where we have the non-return-to-zero
(NU)
signal
us(r)
with a peak-to-peak value
4'
and the noise
un(t)
with an
rms
value
uy
.
For now, we assume that the NRZ signal is free of distortions (intersymbol
interference) and that the noise is Gaussian and signal independent (later we will
generalize). The noisy signal
is
sampled at the center of each bit period (vertical
dashed lines), producing the statistical distributions shown on the right-hand side.
Both distributions are Gaussian and have a standard deviation that is equal to the
rms
value of the noise voltage,
uy,
which we calculated in Eq. (4.7).
Bit
I
IIIII
NRZ Signal
+
Noise
Noise Statistics
Fig.
4.3
Relationship between
signal,
noise,
and bit-error rate.
The decision circuit determines whether a bit is a zero
or
a one by comparing
the sampled output voltage
ug
with the threshold voltage
VDTH,
which is located
at
the midpoint between
the
zero and one levels. Note that aligning the threshold
voltage with the crossover point of the two distributions produces the fewest bit errors
(assuming equal probability
for
zeros and ones). Now we can define the
bit-error
rule
(BER) as the probability that a zero is misinterpreted as a one
or
that a one is
misinterpreted as a zero.*
Given the above model, we can now derive a mathematical expression for the BER.
The error probabilities are given by the shaded areas under the Gaussian tails. The
*In
fact, the term
hit-error rute
is misleading because it suggests a measurement
of
bit errors per time
interval.
A
more accurate term would be
hit-error prohahilip
or
hit-error ratio,
however, because
of
the
widespread use
of
the term
hit-error rute.
we stick with it here.
50
RECEIVER
FUNDAMENTALS
area of each tail has to be summed with a weight of
1/2
because zeros and ones are
assumed to occur with probability
1/2.
Because the two tails are equal in area, we
can calculate just one
of
them:
where Gauss@) is the normalized Gaussian distribution (average
=
0,
standard devi-
ation
=
l).
The lower bound of the integral,
&,
is the difference between the one (or
zero) level and the decision threshold,
4p/2,
normalized to the standard deviation
v,y
of
the Gaussian distribution. Note that this value is the starting point
of
the
shaded tail in normalized coordinates. The
&
parameter, also called the
Personick
Q,3
is a measure
of
the ratio between signal and noise (but there are some subtle
differences between
Q
and the signal-to-noise ratio
[SNR],
as we will discuss later).
The integral in the above equation can be expanded and approximated as follows:
O0
Y2
Gauss(x)
dx
=
-
/
e-r
dx
(4.9)
&e
=-edc(-$)i;
1
1
exp(-Q2/2)
/ew
2
&
The approximation on the far right is correct within
10%
for
Q
>
3.
The precise
numerical values for the integral are listed in Table
4.1
for some commonly used
BER values.
Table
4.7
Numerical relationship between Q and bit-error rate.
Q
BER
Q
BER
0.0
1
/2
5.998
10-9
3.090
10-~
6.361
10-10
3.719
I
0-4
6.706
lo-"
4.265
10-5 7.035 10-12
4.753
10-6
7.349
10-13
5.199 7.651
10-14
10-
15
5.612
10-8
7.942
A
Generalization: Unequal Noise Distributions.
We now drop the assumption
that the noise is signal independent. We know that the noise on the ones is larger than
the noise on the zeros in applications where the detector noise is significant compared
3Note that the Personick Q
is
different from the Q-function,
Q(x),
used
in
some texts
[136].
In
fact, the
Personick
Q
corresponds to the argument.
x,
of the Q-function.
BIT-ERROR
RATE
51
with the amplifier noise, that is, for receivers with an optically preamplified p-i-n
detector or an APD (and also in optically amplified lightwave systems, as we will see
later). Given the simplified noise model introduced earlier, the
rms
noise alternates
between the values
v:;
and
v:.~;,
depending on whether the received bit is a zero or
a one.
In
terms of the noise statistics, we now have two different Gaussians, one for
the zeros with the standard deviation
u;$!
and a wider, lower one for the ones with the
standard deviation
u:;.
Calculating the crossover point for the optimum threshold
voltage and integrating the error tails yields
[5]
Of course, this equation simplifies to Eq. (4.8) for the case
of
equal noise distributions,
vLm5
=
v:;
=
u::.
[-+
Problem 4.21
Signal-to-Noise
Ratio.
The term
signal-to-noise ratio
(SNR) often is used in a
sloppy way; any measure of signal strength divided by any measure of noise may
be called SNR. In this sense, the
Q
parameter is an
SNR,
but in this book we use
the term SNR in a precisely defined way. We define SNR as the
mean-jree average
signal power
divided by the
average noise power.4
The SNR can be calculated in
the continuous-time domain, before the signal is sampled by the decision circuit, or
in the sampled domain (cf. Fig. 4.4). Note that in general these two SNR values are
not equal. Here we calculate the continuous-time SNR the mean-free average signal
power is calculated as
vg(t)
-vs(t>
,
which is (4p/2)2 for a DC-balanced
ideal NRZ
signal. Thenoisepoweriscalculated as
vi(t),
whichcan be written
1/2.(~~,~+21,2,~),
given equal probabilities for zeros and ones. Thus, the SNR follows as
-
2
-
(4.11)
Comparing
Eqs.
(4.10) and (4.1
l),
we realize that we cannot simply convert
Q
into
SNR, or vice versa, without additional knowledge of the noise ratio
v,~~/u~~.
How-
ever, there are two important special cases: (i) if the noise on the zeros and ones is
equal (additive noise, i.e., noise dominated
by
the amplifier) and (ii) if the noise on
the ones is much larger than on the zeros (multiplicative noise, i.e., noise dominated
41n some books on optical communication
[5,
1681,
SNR
is defined as the
peuk
signal power divided
by the average noise power. Here we define
SNR
based on the
averuge
power to be consistent with the
theory
of
communication systems. Furthermore, the signal power is
-
defined as
meamfree,
that is, the
power of the mean signal
m2
is
subtracted from the total power
u?j(t)
when computing the signal
power to avoid a dependence of the signal power on biaqing conditions. However. there is one important
exception: if the signal
is
constant (unmodulated, continuous wave), the mean power
is
nor
subtracted,
or
else the signal power would vanish.
Cf.
the
SNR
calculations in Sections
3.1
and
3.3
where the signal
was a continuous wave, The noise voltage
un
(t)
is mean free by definition and
thus
the noise power
is
automatically mean free.
52
RECEIVER FUNDAMENTALS
by the detector
or
optical amplifiers):
SNR
=
Q2,
if
urns
n.1
=
Un.0
m.7
(4.12)
SNR
=
112.
Q~,
if
VT
>>
v;?.
(4.13)
For example, to achieve a BER
of
(Q
=
7.0),
we need an SNR
of
16.9 dB in
the first case and 13.9dB in the second case.
[+
Problems 4.3,4.4,4.5, and 4.61
At this point, you may wonder if you should use
10
log
Q
or 20
log
Q
to express
Q
values in dB. The above SNR discussion suggests 20 log
Q
(=
10
log
Q2).
But an
equally strong argument can be made for
10
log
Q
(for example, look at Eq. (4.20) in
the next section).
So,
my advice
is
to use
Q
on a linear scale whenever possible. If
you must express
Q
in dBs,
always
clarify whether you used
10
log
Q
or
20
log
Q
as
the conversion rule.
SNR
for
TV
Signals.
Although our focus here is on digital transmission systems
based on
OOK,
it is instructive to compare them with analog transmission systems. An
example of such an analog system is
the
CATVMFC system, where multiple analog
or
digital TV signals
or
both are combined by means
of
subcanier multiplexing
(SCM) into a single analog signal, which is then transmitted over an optical fiber
(cf. Chapter 1).
To
provide a good picture quality, this analog signal must have a much
higher SNR than the
14
to
17
dB typical for an NRZ signal. To be more precise, we
should use the term
currier-to-noise ratio
(CNR) rather than
SNR:
cable-television
engineers use the term CNR
for
RF-modulated signals such as the TV signals in an
SCM system and reserve the term SNR for baseband signals such as the NRZ signal
[23]. For an analog TV channel with AM-VSB modulation, the National Association
of Broadcasters recommends
CNR
>
46 dB. For a digital TV channel with QAM-256
modulation and forward error correction (FEC), typically
CNR
>
30
dB is required.
And then there
is
Eh/No.
There is yet another SNR-like quantity called
EhINo,
often pronounced “ebno.” Sometimes this quantity also is referred to as
SNR
per
bit.
EbINo
is mostly used in wireless applications, but occasionally, it appears in the
op-
tical communication literature, especially when error-correcting codes are discussed.
It therefore is useful to understand what it means and how it relates to
Q,
SNR, and
BER.
Eh
is the energy per information bit and
NO
is the (one-sided) noise power
spectral density. The
EhINo
concept applies to signals with white noise where the
noise spectral density can be characterized by the single number
NO.
This situation is
most closely approximated at the
input
of the receiver as shown in Fig. 4.4, before any
filtering is performed, and the noise can be assumed to be approximately white (not
necessarily a good assumption for optical receivers, as we have seen). Obviously,
the
SNR
at this point is zero because the white noise has an infinite power; however,
EbINo
has a finite value. As we know, after the band-limiting linear channel. we can
calculate a meaningful SNR and
Q
value as indicated in Fig. 4.4.
The energy per bit is the average signal power times the bit interval. Let’s assume
that the midband gain of the linear channel is normalized to one and that the linear
channel only limits the noise but does not attenuate the signal power. We thus can
BITERROR
RATE
53
Square Linear Decision
Detection Channel Circuit
OSNR
WNO
SNR
Q,SNR BER
Fig.
4.4
Various performance measures in an optical receiver.
relate the average energy per information bit to the signal voltage at the decision
circuit as
Eh
=
(v;(t)
-
vs(t>
)
.
T',
where
T'
is the duration of the information bit.
For a DC-balanced ideal NRZ signal, this can be shown to be
Eb
=
($/2)*
. T'.
Why this emphasis on information bit? Because the transmission system may use a
coding scheme such as 8B10B, where groups
of
8
information bits are coded into
10
bits before they are transmitted over the fiber. In this case, the period of an information
bit is somewhat longer than period of a channel bit. Mathematically, we can write
T'
=
T/r
=
l/(r
.
B),
where
B
is the channel bit rate and
r
is the so-called code
rate; for example, the code rate for the 8B10B code is
r
=
0.8.
Next, how is
No
related to the rms noise at the decision circuit? Assuming additive white noise with
the power spectral density
No
at the input, we can calculate the noise voltage at the
decision circuit as
(u,"")~
=
NO
.
BW,,
where
BW,
is the noise bandwidth of the
linear channel. Dividing
Eb
and
NO
reveals the following relationship with
&:
-
2
(4.14)
Thus,
&/No
is equal to
Q2
scaled by the ratio of the noise bandwidth and the infor-
mation bit rate. The latter ratio is related to the spectral efficiency of the modulation
scheme. Thus, the main difference between
Eh/No
and
Q
(or SNR) is that
&,/No
takes the spectral efficiency of the modulation scheme into account. In texts on com-
munication systems and forward error correction, it usually is assumed that a matched
filter receiver
is
used. For
NRZ
modulation, this means that the noise bandwidth is
half the bit rate,
BW,,
=
B/2
(cf. Section 4.6), leading to the simpler relationship
Ei,
&'
NO
2r'
_-
(4.15)
For example, to achieve a BER of
(&
=
7.0)
without coding
(r
=
l), we
need
&/No
=
13.9dB, whereas with 8BlOB coding
(r
=
0.8),
we would need
&/No
=
14.9dB.
[+
Problem 4.71
We conclude that if we assume DC-balanced
NRZ
modulation with
no
coding,
signal-independent white noise, and a matched filter receiver, then
&/No
is always
54
RECEIVER FUNDAMENTALS
3
dB lower than the
Q
parameter, where the
dB
value of the latter is calculated as
20
log
Q.
BER,
Q,
SNR, OSNR, Eh/No,
and
All
the Rest of It.
By now you have realized
that there is a bewildering variety of SNR-like quantities out there and it is time to
put them in perspective (see Fig.
4.4).
The primary performance measure in a digital
communication system is the BER, which is measured at the output of the decision
circuit. To design and test the system, we would like to relate the BER to quantities
that can be measured in other parts of the system. The first and most direct predictor
of BER is the
Q
parameter, which is determined from the sampled values at the input
of the decision circuit. To calculate the BER from
Q,
we have to assume only that the
noise is Gaussian, that the signal has two levels that
are
used with equal probability,
and that the decision threshold is set to its optimum value. In particular, we do
not
need to make any assumptions about the spectral distribution and additiveness of the
noise, neither does the shape and duration of the data pulses matter (e.g., NRZ vs.
RZ
modulation). This makes
Q
an excellent performance measure and should be
used whenever possible. The sampled SNR measured at the input of the decision
circuit is another, less direct predictor of the BER.
To
calculate the BER from the
sampled SNR, we need additional information about the relative strength of the noise
on the zeros and ones.
To
calculate the BER from the continuous-time SNR, we need
additional knowledge of the shape of the data pulses. To calculate the BER from the
&/No,
which is measured at the input of the receiver, we need additional knowledge
of
the receiver’s noise bandwidth and code rate.5 Finally, to calculate the BER from
the optical signal-to-noise ratio (OSNR), which is measured in the optical domain,
we also need additional knowledge of the receiver’s noise bandwidth. We discuss the
effect of OSNR on the BER in the next section.
4.3
SENSITIVITY
Rather than asking “What is the bit-error rate given a certain signal level?,” we could
ask the other way round, “What is the minimum signal level needed to achieve a given
bit-error rate?’ This minimum signal, when referred back to
the
input of the receiver,
is known as the
sensitivity.
The sensitivity is one
of
the key characteristics
of
an
optical receiver. It tells us to what level the transmitted signal can become attenuated
by the fiber and still be detected reliably by the receiver. Sensitivity can be defined
in the electrical as well as the optical domain, as we will see next.
Definitions.
The
electrical receiver sensitivity,
if&,
is defined as the minimum
peak-to-peak signal current at the input of the receiver necessary to achieve a specified
51n the literature on communication systems, it often is said that
“E/,/No
uniquely determines the
BER
for
a particular modulation scheme,” in apparent contradiction to what we are saying here. However. note that
the above statement rests on many implicit assumptions such as additive white Gaussian noise, a signal
without intersymbol interference
(IS),
a matched filter receiver with optimum threshold, and no coding.