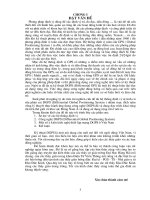
Fundamentals of Global Positioning System Receivers A Software Approach - Chapter 3 potx
Bạn đang xem bản rút gọn của tài liệu. Xem và tải ngay bản đầy đủ của tài liệu tại đây (296.59 KB, 22 trang )
Fundamentals of Global Positioning System Receivers: A Software Approach
James Bao-Yen Tsui
Copyright 2000 John Wiley & Sons, Inc.
Print ISBN 0-471-38154-3 Electronic ISBN 0-471-20054-9
CHAPTER THREE
Satellite Constellation
3.1
INTRODUCTION
The previous chapter assumes that the positions of the satellites are known.
This chapter will discuss the satellite constellation and the determination of the
satellite positions. Some special terms related to the orbital mechanics, such as
sidereal day, will be introduced. The satellite motion will have an impact on
the processing of the signals at the receiver. For example, the input frequency
shifts as a result of the Doppler effect. Such details are important for the design
of acquisition and tracking loops in the receiver. However, in order to obtain
some of this information a very accurate calculation of the satellite motion is not
needed. For example, the actual orbit of the satellite is elliptical but it is close
to a circle. The information obtained from a circular orbit will be good enough
to find an estimation of the Doppler frequency. Based on this assumption the
circular orbit is used to calculate the Doppler frequency, the rate of change of
the Doppler frequency, and the differential power level. From the geometry of
the satellite distribution, the power level at the receiver can also be estimated
from the transmission power. This subject is presented in the final section in this
chapter.
In order to find the location of the satellite accurately, a circular orbit is insufficient. The actual elliptical satellite orbit must be used. Therefore, the complete
elliptical satellite orbit and Kepler’s law will be discussed. Information obtained
from the satellite through the GPS receiver via broadcast navigation data such
as the mean anomaly does not provide the location of the satellite directly.
However, this information can be used to calculate the precise location of the
satellite. The calculation of the satellite position from these data will be discussed in detail.
32
3.2
3.2
CONTROL SEGMENT OF THE GPS SYSTEM
33
CONTROL SEGMENT OF THE GPS SYSTEM(1–3)
This section will provide a very brief idea of the GPS system. The GPS system may be considered as comprising three segments: the control segment, the
space segment, and the user segment. The space segment contains all the satellites, which will be discussed in Chapters 3, 4, and 5. The user segment can
be considered the base of receivers and their processing, which is the focus of
this text. The control segment will be discussed in this section.
The control segment consists of five control stations, including a master control station. These control stations are widely separated in longitude around the
earth. The master control station is located at Falcon Air Force Base, Colorado
Springs, CO. Operations are maintained at all times year round. The main purpose of the control stations is to monitor the performance of the GPS satellites.
The data collected from the satellites by the control stations will be sent to
the master control station for processing. The master control station is responsible for all aspects of constellation control and command. A few of the operation objectives are presented here: (1) Monitor GPS performance in support
of all performance standards. (2) Generate and upload the navigation data to
the satellites to sustain performance standards. (3) Promptly detect and respond
to satellite failure to minimize the impact. Detailed information on the control
segment can be found in reference 3.
3.3
SATELLITE CONSTELLATION(3–9)
There are a total of 24 GPS satellites divided into six orbits and each orbit has four
satellites. Each orbit makes a 55-degree angle with the equator, which is referred
to as the inclination angle. The orbits are separated by 60 degrees to cover the
complete 360 degrees. The radius of the satellite orbit is 26,560 km and it rotates
around the earth twice in a sidereal day. Table 3.1 lists all these parameters.
The central body of the Block IIR satellite is a cube of approximately 6 ft
on each side.(8) The span of the solar panel is about 30 ft. The lift-off weight
of the spacecraft is 4,480 pounds and the on-orbit weight is 2,370 pounds.
TABLE 3.1 Characteristics of GPS Satellites
Constellation
Number of satellites
Number of orbital planes
Number of satellites per orbit
Orbital inclination
Orbital radius(7)
Period(4)
Ground track repeat
24
6
4
55
26560 km
11 hrs 57 min 57.26 sec
sidereal day
34
SATELLITE CONSTELLATION
The four satellites in an orbit are not equally spaced. Two satellites are separated by 30.0–32.1 degrees. The other two make three angles with the first two
satellites and these angles range 92.38–130.98 degrees.(9) The spacing has been
optimized to minimize the effects of a single satellite failure on system degradation. At any time and any location on the earth, neglecting obstacles such as
mountains and tall buildings, a GPS receiver should have a direct line of sight
and be receiving signals from 4 to 11 satellites. A majority of the time a GPS
receiver can receive signals from more than four satellites. Since four satellites
are the minimum required number to find the user position, this arrangement can
provide user position at any time and any location. For this 24-satellite constellation with a 5-degree elevation mask angle, more than 80% of the time seven
or more satellites are in view.(9) A user at 35 degrees latitude corresponds to
the approximate worst latitude where momentarily there are only four satellites
in view (approximately .4% of the time).
The radius of the earth is 6,378 km around the equator and 6,357 km passing
through the poles, and the average radius can be considered as 6,368 km. The
radius of the satellite orbit is 26,560 km, which is about 20,192 km (26,560 −
6,368) above the earth’s surface. This height agrees well with references 6 and
9. This height is approximately the shortest distance between a user on the surface of the earth and the satellite, which occurs at around zenith or an elevation
angle of approximately 90 degrees. Most GPS receivers are designed to receive
signals from satellites above 5 degrees. For simplicity, let us assume that the
receiver can receive signals from satellites at the zero-degree point. The distance
from a satellite on the horizon to the user is 25,785 km ( 26, 5602 − 6, 3682 ).
These distances are shown in Figure 3.1.
From the distances in Figure 3.1 one can see that the time delays from the
satellites are in the range of 67 ms (20,192 km/ c) to 86 ms (25,785 km/ c),
where c is the speed of light. If the user is on the surface of the earth, the
maximum differential delay time from two different satellites should be within
19 (86–67) ms. In this figure, the angle a is approximately 76.13 degrees and
the angle b is approximately 13.87 degrees. Therefore, the transmitting antenna
on the satellite need only have a solid angle of 13.87 degrees to cover the earth.
However, the antenna for the L1 band is 21.3 degrees and the antenna for the
L2 band is 23.4 degrees. Both are wider than the minimum required angle. The
solid angle of 21.3 degrees will be used in Section 3.13 to estimate the power
to the receiver. The antenna pattern will be further discussed in Section 5.2.
3.4 MAXIMUM DIFFERENTIAL POWER LEVEL FROM DIFFERENT
SATELLITES
From Figure 3.1 one can calculate the relative power level of the received signals on the surface of the earth. The transmitting antenna pattern is designed to
directly aim at the earth underneath it. However, the distances from the receiver
3.5
FIGURE 3.1
SIDEREAL DAY
35
Earth and circular satellite orbit.
to various satellites are different. The shortest distance to a satellite is at zenith
and the farthest distance to a satellite is at horizon. Suppose the receiver has an
omnidirectional antenna pattern. Since the power level is inversely proportional
to the distance square, the difference in power level can be found as
Dp
10 log
257852
201922
≈ 2.1dB
(3.1)
It is desirable to receive signals from different satellites with similar strength.
In order to achieve this goal, the transmitting antenna pattern must be properly
designed. The beam is slightly weaker at the center to compensate for the power
difference.
3.5
SIDEREAL DAY(10,11)
Table 3.1 indicates that the satellite rotates around the earth twice in a sidereal day. The sidereal day is slightly different from an apparent solar day. The
apparent day has 24 hours and it is the time used daily. The apparent solar
day is measured by the time between two successive transits of the sun across
our local meridian, because we use the sun as our reference. A sidereal day is
36
SATELLITE CONSTELLATION
FIGURE 3.2
Configuration of apparent solar day and sidereal day.
the time for the earth to turn one revolution. Figure 3.2 shows the difference
between the apparent solar day and a sidereal day. In this figure, the effect is
exaggerated and it is obvious that a sidereal day is slightly shorter than a solar
day. The difference should be approximately equal to one day in one year which
corresponds to about 4 min (24 × 60/ 365) per day. The mean sidereal day is
23 hrs, 56 min, 4.09 sec. The difference from an apparent day is 3 min, 55.91
sec. Half a sidereal day is 11 hrs, 58 min, 2.05 sec. This is the time for the
satellite to rotate once around the earth. From this arrangement one can see
that from one day to the next a certain satellite will be at approximately the
same position at the same time. The location of the satellite will be presented
in the next section.
3.6
DOPPLER FREQUENCY SHIFT
In this section, the Doppler frequency shift caused by the satellite motion both
on the carrier frequency and on the coarse/ acquisition (C/ A) code will be discussed. This information is important for performing both the acquisition and
the tracking of the GPS signal.
The angular velocity dv / d t and the speed vs of the satellite can be calculated
from the approximate radius of the satellite orbit as
3.6
dv
dt
vs
DOPPLER FREQUENCY SHIFT
37
2p
≈ 1.458 × 10 − 4 rad/ s
11 × 3600 + 58 × 60 + 2.05
r s dv
≈ 26560 km × 1.458 × 10 − 4 ≈ 3874 m/ s
dt
(3.2)
where r s is the average radius of the satellite orbit. In 3 min, 55.91 sec, the
time difference between an apparent solar day and the sidereal day, the satellite
will travel approximately 914 km (3,874 m/ s × 235.91 sec). Referenced to the
surface of the earth with the satellite in the zenith direction, the corresponding
angle is approximately .045 radian (914/ 20.192) or 2.6 degrees. If the satellite
is close to the horizon, the corresponding angle is approximately .035 radian
or 2 degrees. Therefore, one can consider that the satellite position changes
about 2–2.6 degrees per day at the same time with respect to a fixed point
on the surface of the earth. In Figure 3.3, the satellite is at position S and the
user is at position A. The Doppler frequency is caused by the satellite velocity
component vd toward the user where
vd
FIGURE 3.3
vs sin b
Doppler frequency caused by satellite motion.
(3.3)
38
SATELLITE CONSTELLATION
Velocity component toward the user versus angle v.
FIGURE 3.4
Now let us find this velocity in terms of angle v. Using the law of cosine in
triangle OAS, the result is
2
r e + r s2 − 2r e r s cos a
AS 2
because of a + v
is
2
r e + r s2 − 2r e r s sin v
(3 . 4 )
p/ 2. In the same triangle, using the law of sine, the result
sin b
sin a
sin b
cos v
re
AS
(3.5)
Substituting these results into Equation (3.3), one obtains
vd
vs r e cos v
AS
vs r e cos v
2
re
+ r s2 − 2r e r s sin v
(3.6)
This velocity can be plotted as a function v and is shown in Figure 3.4.
As expected, when v p/ 2, the Doppler velocity is zero. The maximum
3.6
DOPPLER FREQUENCY SHIFT
39
Doppler velocity can be found by taking the derivative of vd with respect to v
and setting the result equal to zero. The result is
2
vr e [r e r s sin2 v − (r e + r s2 ) sin v + r e r s ]
2
(r e + r s2 − 2r e r s sin v)3/ 2
dvd
dv
0
(3.7)
Thus sin v can be solved as
sin v
re
or v
rs
sin − 1
r ≈ 0.242 rad
re
(3.8)
s
At this angle v the satellite is at the horizontal position referenced to the
user. Intuitively, one expects that the maximum Doppler velocity occurs when
the satellite is at the horizon position and this calculation confirms it. From
the orbit speed, one can calculate the maximum Doppler velocity vdm , which
is along the horizontal direction as
vdm
vs r e
rs
3874 × 6368
≈ 929 m/ s ≈ 2078 miles/ h
26560
(3.9)
This speed is equivalent to a high-speed military aircraft. The Doppler frequency shift caused by a land vehicle is often very small, even if the motion
is directly toward the satellite to produce the highest Doppler effect. For the
L1 frequency ( f 1575.42 MHz), which is modulated by the C/ A signal, the
maximum Doppler frequency shift is
f dr
f r vdm
c
1575.42 × 929
≈ 4.9 KHz
3 × 10⁸
(3.10)
where c is the speed of light. Therefore, for a stationary observer, the maximum
Doppler frequency shift is around ±5 KHz.
If a vehicle carrying a GPS receiver moves at a high speed, the Doppler
effect must be taken into consideration. To create a Doppler frequency shift of
±5 KHz by the vehicle alone, the vehicle must move toward the satellite at about
2,078 miles/ hr. This speed will include most high-speed aircraft. Therefore, in
designing a GPS receiver, if the receiver is used for a low-speed vehicle, the
Doppler shift can be considered as ±5 KHz. If the receiver is used in a highspeed vehicle, it is reasonable to assume that the maximum Doppler shift is ±10
KHz. These values determine the searching frequency range in the acquisition
program. Both of these values are assumed an ideal oscillator and sampling
frequency and further discussion is included in Section 6.15.
The Doppler frequency shift on the C/ A code is quite small because of the
40
SATELLITE CONSTELLATION
low frequency of the C/ A code. The C/ A code has a frequency of 1.023 MHz,
which is 1,540 (1575.42/ 1.023) times lower than the carrier frequency. The
Doppler frequency is
f dc
f c vh
c
1.023 × 106 × 929
≈ 3.2 Hz
3 × 10⁸
(3.11)
If the receiver moves at high speed, this value can be doubled to 6.4 Hz. This
value is important for the tracking method (called block adjustment of synchronizing signal or BASS program), which will be discussed in Chapter 8.
In the BASS program, the input data and the locally generated data must be
closely aligned. The Doppler frequency on the C/ A code can cause misalignment between the input and the locally generated codes.
If the data is sampled at 5 MHz (referred to as the sampling frequency), each
sample is separated by 200 ns (referred to as the sampling time). In the tracking
program it is desirable to align the locally generated signal and the input signal
within half the sampling time or approximately 100 ns. Larger separation of
these two signals will lose tracking sensitivity. The chip time of the C/ A code
is 977.5 ns or 1/ (1.023 × 10⁶ ) sec. It takes 156.3 ms (1/ 6.4) to shift one cycle
or 977.5 ns. Therefore, it takes approximately 16 ms (100 × 156.3/ 977.5) to
shift 100 ns. In a high-speed aircraft, a selection of a block of the input data
should be checked about every 16 ms to make sure these data align well with
the locally generated data. Since there is noise on the signal, using 1 ms of data
may not determine the alignment accurately. One may extend the adjustment of
the input data to every 20 ms. For a slow-moving vehicle, the time may extend
to 40 ms.
From the above discussion, the adjustment of the input data depends on the
sampling frequency. Higher sampling frequency will shorten the adjustment
time because the sampling time is short and it is desirable to align the input
and the locally generated code within half the sampling time. If the incoming
signal is strong and tracking sensitivity is not a problem, the adjustment time
can be extended. However, the input and the locally generated signals should be
aligned within half a chip time or 488.75 ns (977.5/ 2). This time can be considered as the maximum allowable separation time. With a Doppler frequency of
6.4 Hz, the adjustment time can be extended to 78.15 ms (1/ 2 × 6.4). Detailed
discussion of the tracking program will be presented in Chapter 8.
3.7
AVERAGE RATE OF CHANGE OF THE DOPPLER FREQUENCY
In this section the rate of change of the Doppler frequency will be discussed.
This information is important for the tracking program. If the rate of change
of the Doppler frequency can be calculated, the frequency update rate in the
tracking can be predicted. Two approaches are used to find the Doppler fre-
3.8
MAXIMUM RATE OF CHANGE OF THE DOPPLER FREQUENCY
41
quency rate. A very simple way is to estimate the average rate of change of the
Doppler frequency and the other one is to find the maximum rate of change of
the Doppler frequency.
In Figure 3.4, the angle for the Doppler frequency changing from maximum
to zero is about 1.329 radians (p/ 2 − v p/ 2 − 0.242). It takes 11 hrs, 58 min,
2.05 sec for the satellite to travel 2p angle; thus, the time it takes to cover 1.329
radians is
t
(11 × 3600 + 58 × 60 + 2.05)
1.329
2p
9113 sec
(3.12)
During this time the Doppler frequency changes from 4.9 KHz to 0, thus, the
average rate of change of the Doppler frequency df dr can be simply found as
df dr
4900
≈ 0.54 Hz/ s
9113
(3.13)
This is a very slow rate of change in frequency. From this value a tracking
program can be updated every few seconds if the frequency accuracy in the
tracking loop is assumed on the order of 1 Hz. The following section shows
how to find the maximum frequency rate of change.
3.8
MAXIMUM RATE OF CHANGE OF THE DOPPLER FREQUENCY
In the previous section the average rate of change of the Doppler frequency is
estimated; however, the rate of change is not a constant over that time period.
In this section we try to find the maximum rate of change of the frequency. The
rate of change of the speed vd can be found by taking the derivative of vd in
Equation (3.6) with respect to time. The result is
dvd
dt
dvd dv
dv d t
2
vr e [r e r s sin2 v − (r e + r s2 ) sin v + r e r s ] dv
2
(r e + r s2 − 2r e r s sin v)3/ 2
dt
(3.14)
In deriving this equation, the result of Equation (3.7) is used. The result of
this equation is shown in Figure 3.5 and the maximum rate of change of the
frequency occurs at v p/ 2.
The corresponding maximum rate of change of the speed is
dvd
dt
|
|
|
| max
vr e dv / d t
|
|
≈ 0.178 m s2
|
2 + r 2 − 2r r |
re
e x |v p 2
x
/
/
(3.15)
42
SATELLITE CONSTELLATION
FIGURE 3.5
The rate of change of the speed versus angle v.
In this equation, only the magnitude is of interest, thus, the sign is neglected.
The corresponding rate of change of the Doppler frequency is
df dr | max
dvd f r
dt c
0.178 × 1575.42 × 106
3 × 10⁸
0.936 Hz/ s
(3.16)
This value is also very small. If the frequency accuracy measured through the
tracking program is assumed on the order of 1 Hz, the update rate is almost
one second, even at the maximum Doppler frequency changing rate.
3.9 RATE OF CHANGE OF THE DOPPLER FREQUENCY DUE TO USER
ACCELERATION
From the previous two sections, it is obvious that the rate of change of the
Doppler frequency caused by the satellite motion is rather low; therefore, it
does not affect the update rate of the tracking program significantly.
Now let us consider the motion of the user. If the user has an acceleration
3.10
KEPLER’S LAWS
43
of 1 g (gravitational acceleration with a value of 9.8 m/ s2 ) toward a satellite,
the corresponding rate of change of the Doppler frequency can be found from
Equation (3.15) by replacing dvc / d t by g. The corresponding result obtained
from Equation (3.16) is about 51.5 Hz/ s. For a high-performance aircraft, the
acceleration can achieve several g values, such as 7 g. The corresponding rate of
change of the Doppler frequency will be close to 360 Hz/ s. Comparing with the
rate of change of the Doppler frequency caused by the motions of the satellite
and the receiver, the acceleration of the receiver is the dominant factor.
In tracking the GPS signal in a software GPS receiver two factors are used
to update the tracking loop: the change of the carrier frequency and the alignment of the input and the locally generated C/ A codes. As discussed in Section
3.5, the input data adjustment rate is about 20 ms due to the Doppler frequency
on the C/ A code. If the carrier frequency of the tracking loop has a bandwidth of the order of 1 Hz and the receiver accelerates at 7 g, the tracking
loop must be updated approximately every 2.8 ms (1/ 360) due to the carrier
frequency change. This might be a difficult problem because of the noise in
the received signal. The operation and performance of a receiver tracking loop
greatly depends on the acceleration of the receiver.
3.10
KEPLER’S LAWS(11,12)
In the previous section, the position of a satellite is briefly described. This information can be used to determine the differential power level and the Doppler
frequency on the input signal. However, this information is not sufficient to
calculate the position of a satellite. To find the position of a satellite, Kepler’s
laws are needed. The discussion in this section provides the basic equations to
determine a satellite position.
Kepler’s three laws are listed below (see Chapter 1 in ref. 11):
First Law: The orbit of each planet is an ellipse with the sun at a focus.
Second Law: The line joining the planet to the sun sweeps out equal areas
in equal times.
Third Law: The square of the period of a planet is proportional to the cube
of its mean distance from the sun.
These laws also apply to the motion of the GPS satellites. The satellite orbit
is elliptical with the earth at one of the foci. Figure 3.6 shows the orbit of a GPS
satellite. The center of the earth is at F and the position of the satellite is at S.
The angle n is called the actual anomaly. In order to illustrate the basic concept,
the shape of the ellipse is overemphasized. The actual orbit of the satellite is
very close to a circle. The point nearest to the prime focus is called the perigee
and the farthest point is called the apogee.
Kepler’s second law can be expressed mathematically as (Figure 3.6)
44
SATELLITE CONSTELLATION
Elliptical orbit of a satellite.
FIGURE 3.6
t − tp
A1
T
pas bs
(3.17)
where t presents the satellite position at time t, t p is the time when the satellite
passes the perigee, A1 is the area enclosed by the lines t t, t t p , and the
ellipse, T is the period of the satellite, as and bs are the semi-major and semiminor axes of the orbit, and pas bs is the total area of the ellipse. This equation
states that the time to sweep the area A1 is proportional to the time T to sweep
the entire area of the ellipse.
The third law can be stated mathematically as
T2
a3
s
4p 2
4p 2
≡
m
GM
(3.18)
where m GM 3.986005 × 10¹⁴ meters3 / sec2 (ref. 12) is the gravitational
constant of the earth. Thus, the right-hand side of this equation is a constant. In
this equation the semi-major axis as is used rather than the mean distance from
the satellite to the center of the earth. In reference 11 it is stated that as can be
used to replace the mean distance because the ratio of as to the mean distance
r s is a constant. This relationship can be shown as follows. If one considers the
area of the ellipse orbit equal to the area of a circular orbit with radius r s , then
3.11
pas bs
pr s2
as
rs
or
45
KEPLER’S EQUATION
rs
bs
(3.19)
Since as , bs , r s are constants, as and r s is related by a constant.
3.11
KEPLER’S EQUATION(11,13)
In the following paragraphs Kepler’s equation will be derived and the mean
anomaly will be defined. The reason for this discussion is that the information
given by the GPS system is the mean anomaly rather than the actual anomaly
that is used to calculate the position of a satellite.
In order to perform this derivation, a few equations from the previous chapter
will be repeated here. The eccentricity is defined as
es
a2 − b2
cs
s
s
≡
as
as
(3.20)
where cs is the distance from the center of the ellipse to a focus. For an ellipse,
the es value is 0 < es < 1. When as bs , then es 0, which represents a circle.
The eccentricity es can be obtained from data transmitted by the satellite.
In Figure 3.7 an elliptical satellite orbit and a fictitious circular orbit are
shown. The center of the earth is at F and the satellite is at S. The area A1 is
swept by the satellite from the perigee point to the position S. This area can be
written as
A1
area PSV − A2
(3.21)
In the previous chapter Equation (2.24) shows that the heights of the ellipse
and the circle can be related as
QP
SP
as
bs
(3.22)
Therefore, the area PSV can be obtained from area PQV as
area PSV
bs
area PQV
as
bs
as
[
bs
(area OQV − area OQP)
as
1 2
1 2
as E −
a sin E cos E
2
2 s
]
as bs
(E − sin E cos E )
2
(3.23)
46
SATELLITE CONSTELLATION
FIGURE 3.7
Fictitious and actual orbits.
where the angle E is called eccentric anomaly. The area of triangle A2 is
A2
1
SP × PF
2
1 bs
QP × PF
2 as
bs
sin E(es as − as cos E )
2
1 bs
as sin E(cs − as cos E )
2 as
as bs
(es sin E − sin E cos E )
2
(3.24)
In the above equation, the relation in Equation (3.20) is used. Substituting
Equations (3.23) and (3.24) into (3.21) the area A1 is
A1
as bs
(E − es sin E )
2
(3.25)
Substituting this result into Equation (3.17), Kepler’s second law, the result is
t − tp
A1 T
pas bs
T
(E − es sin E )
2p
a3
s
(E − es sin E )
m
(3.26)
3.12
TRUE AND MEAN ANOMALY
47
The next step is to define the mean anomaly M and from Equation (3.26)
the result is
M ≡ (E − es sin E )
m
(t − t p )
a3
s
(3.27)
If one defines the mean motion n as the average angular velocity of the satellite,
then from Equation (3.18) the result is
n
2p
T
m
a3
s
(3.28)
Substituting this result into Equation (3.27) the result is
M ≡ (E − es sin E )
n(t − t p )
(3.29)
This is referred to as Kepler’s equation. From this equation one can see that M
is linearly related to t; therefore, it is called the mean anomaly.
3.12
TRUE AND MEAN ANOMALY
The information obtained from a GPS satellite is the mean anomaly M. From
this value, the true anomaly must be obtained because the true anomaly is used
to find the position of the satellite. The first step is to obtain the eccentric
anomaly E from the mean anomaly, Equation (3.29) relates M and E. Although
this equation appears very simple, it is a nonlinear one; therefore, it is difficult
to solve analytically. This equation can be rewritten as follows:
E
M + es sin E
(3.30)
In this equation, es is a given value representing the eccentricity of the satellite orbit. Both es and M can be obtained from the navigation data of the satellite. The only unknown is E. One way to solve for E is to use the iteration
method. A new E value can be obtained from a previous one. The above equation can be written in an iteration format as
Ei + 1
M + es sin E i
(3.31)
where E i + 1 is the present value and E i is the previous value. One common
choice of the initial value of E is E 0 M. This equation converges rapidly
because the orbit is very close to a circle. Either one can define an error signal
48
SATELLITE CONSTELLATION
as E err E i + 1 − E i and end the iteration when E err is less than a predetermined
value, or one can just iterate Equation (3.31) a fixed number of times (i.e., from
5 to 10).
Once the E is found, the next step is to find the true anomaly n. This relation
can be found by referring to Figure 3.7.
cs − PF
as
OP
as
cos E
cs + r cos n
as
(3.32)
Now let us find the distance r in terms of angle n. From Figure 3.6, applying
the law of cosine to the triangle GSF, the following result is obtained
r′2
r 2 + 4rcs cos n + 4cs2
(3.33)
where r and r′ are the distance from the foci G and F to the point S. For an
ellipse,
r′ + r
2a s
(3.34)
Substituting this relation into Equation (3.33), the result is
r
a2 − c2
s
s
as + cs cos n
a s (1 − e 2 )
s
1 + es cos n
(3.35)
Substituting this value of r into Equation (3.32) the result is
cos E
es + cos n
1 + es cos n
(3.36)
cos n
cos E − es
1 − es cos E
(3.37)
Solve for n and the result is
This solution generates multiple solutions for n because cos n is a multivalued function. One way to find the correct value of n is to keep these angles E
and n in the same half plane. From Figure 3.7 one can see that the angles E
and n are always in the same half plane.
Another approach to determine n is to find the sin n.(13) If one takes the
square on both sides of the above equation, the result is
3.12
cos2 n
1 − sin2 n
TRUE AND MEAN ANOMALY
(cos E − es )2
(1 − es cos E )2
49
(3.38)
Solve for sinn and the result is
1 − e2 sin E
s
1 − es cos E
sin n
(3.39)
The n can be found from Equations (3.37) and (3.39) and they are designated
as n 1 and n 2 where
n1
cos − 1
cos E − es
1 − e cos E
s
n2
sin − 1
1 − es sin E
1 − es cos E
(3.40)
The n 1 value calculated from Matlab is always positive for all E values and n 2
is positive for E 0 to p and negative for E p to 2p as shown in Figure 3.8.
FIGURE 3.8
n 1 and n 2 versus E.
50
SATELLITE CONSTELLATION
Thus, the true anomaly can be found as
n
n 1 sign(n 2 )
(3.41)
where sign(n 2 ) provides the sign of n 2 ; therefore, it is either +1 or − 1. It is
interesting to note that to find the true anomaly only M and es are needed.
Although the semi-major axis as appears in the derivation, it does not appear
in the final equation.
3.13
SIGNAL STRENGTH AT USER LOCATION(1,8,14–16)
In this section the signal strength at the user location will be estimated. The
signal strength can be obtained from the power of the transmitting antenna, the
beam width of the antenna, the distance from the satellite to the user, and the
effective area of the receiving antenna. The power amplifier of the transmitter
is 50 w(8) (or 17 dBw). The input to the transmitting antenna is 14.3 dBw.(8)
The difference might be due to impedance mismatch or circuit loss.
The gain of the transmitting antenna can be estimated from the beam width
(or solid angle) of the antenna. The solid angle is denoted as v, which is 21.3
degrees. The area on the surface of a sphere covered by the angle v can be
obtained from Figure 3.9 as
FIGURE 3.9
Area facing solid angle v.
3.13
Area
∫
SIGNAL STRENGTH AT USER LOCATION
v
2pr 2
2p(r sin v)rdv
0
2pr 2 ( − cos v) | v
0
∫
51
v
sin vdv
0
2pr 2 (1 − cos v)
(3.42)
The ratio of this area to the area of the sphere can be considered as the gain of
the transmitting antenna, which can be written as
G
4pr 2
2
≈
≈ 29.28 ≈ 14.7 dB
2pr 2 (1 − cos v) | 21.30
0.683
(3.43)
Using 14.3 dBw as the input to the antenna, the output of the antenna should
be 29 dBw (14.3 + 14.7). However, the transmitting power level is listed as
478.63 w,(14,15) which corresponds to 26.8 dBw. This difference between the
power levels might be due to efficiency of the antenna and the accuracy of the
solid angle of the antenna because the power cannot be cut off sharply at a
desired angle.
If the receiving antenna has a unit gain, the effective area is(16)
Ae f f
l2
4p
(3.44)
where l is the wavelength of the receiving signal.
The received power is equal to the power density multiplied by the effective
area of the receiving antenna. The power density is equal to the radiating power
divided by the surface of the sphere. The receiving power can be written as
Pr
Pt Ae f f
4pR2
su
Pt
l2
4pR2 4p
su
Pt l 2
(4pRsu )2
(3.45)
where Rsu is the distance from the satellite to the user. Assume Rsu 25785 ×
103 m, which is the farthest distance as shown in Figure 3.1. Using 478.63 W
as the transmitting antenna and the wavelength l 0.19 m, the receiving power
Pr calculated from the above equation is 1.65 × 10 − 16 w (or − 157.8 dBw). If
the loss through the atmosphere is taken into consideration, the received power
is close to the minimum required value of − 160 dBw.
The power level at the receiver is shown in Figure 3.10. It is a function
of the elevation angle.(1) At zenith and horizon, the powers are at − 160 dBw.
The maximum power level is − 158 dBw, which occurs at about 40 degrees. If
the receiving antenna is taken into consideration, the received power will be
modified by its antenna pattern.
52
SATELLITE CONSTELLATION
FIGURE 3.10
3.14
Power level versus elevation angle.
SUMMARY
This chapter discusses the orbits of the GPS satellite. The orbit is elliptical but
it is very close to a circle. Thus, the circular orbit is used to figure the power
difference to the receiver and the Doppler frequency shift. This information is
important for tracking the satellite. In order to find the position of a satellite the
actual elliptical satellite orbit must be used. To discuss the motion of the satellite
in the elliptical-shaped orbit, Kepler’s laws are introduced. Three anomalies are
defined: the mean M, the eccentric E, and the true n anomalies. Mean anomaly
M and eccentricity es are given from the navigation data of the satellite. Eccentric anomaly E can be obtained from Equation (3.30). True anomaly n can be
found from Equations (3.40) and (3.41). Finally, the receiving power at the user
location is estimated.
REFERENCES
1. Global Positioning System Standard Positioning Service Signal Specification, 2nd
ed, GPS Joint Program Office, June 2, 1995.
2. Spilker, J. J., Parkinson, B. W., “Overview of GPS operation and design,” Chapter
2 in Parkinson, B. W., Spilker, J. J., Jr., Global Positioning System: Theory and
Applications, vols. 1 and 2, American Institute of Aeronautics and Astronautics,
370 L’Enfant Promenade, SW, Washington, DC, 1996.
3. Kaplan, E. D., ed., Understanding GPS Principles and Applications, Artech House,
Norwood, MA, 1996.
4. “System specification for the NAVSTAR global positioning system,” SS-GPS-300B
code ident 07868, March 3, 1980.
5. Spilker, J. J., “GPS signal structure and performance characteristics,” Navigation,
Institute of Navigation, vol. 25, no. 2, pp. 121–146, Summer 1978.
6. Milliken, R. J., Zoller, C. J., “Principle of operation of NAVSTAR and system char-
REFERENCES
7.
8.
9.
10.
11.
12.
13.
14.
15.
16.
53
acteristics,” Advisory Group for Aerospace Research and Development (AGARD),
Ag-245, pp. 4-1– 4-12, July 1979.
Misra, P. N., “Integrated use of GPS and GLONASS in civil aviation,” Lincoln Laboratory Journal, Massachusetts Institute of Technology, vol. 6, no. 2, pp. 231–247,
Summer/ Fall, 1993.
Aparicio, M., Brodie, P., Doyle, L., Rajan, J., and Torrione, P., “GPS satellite and
payload,” Chapter 6 in Parkinson, B. W., Spilker, J. J. Jr., Global Positioning System: Theory and Applications, vols. 1 and 2, American Institute of Aeronautics and
Astronautics, 370 L’Enfant Promenade, SW, Washington, DC, 1996.
Spilker, J. J. Jr., “Satellite constellation and geometric dilution of precision,” Chapter 5 in Parkinson, B. W., Spilker, J. J. Jr., Global Positioning System: Theory and
Applications, vols. 1 and 2, American Institute of Aeronautics and Astronautics,
370 L’Enfant Promenade, SW, Washington, DC, 1996.
“Reference data for radio engineers,” 5th ed., Howard W. Sams & Co. (subsidiary
of ITT), Indianapolis, 1972.
Bate, R. R., Mueller, D. D., White, J. E., Fundamentals of Astrodynamics, pp.
182–188, Dover Publications, New York, 1971.
“Department of Defense world geodetic system, 1984 (WGS-84), its definition and
relationships with local geodetic systems,” DMA-TR-8350.2, Defense Mapping
Agency, September 1987.
Riggins, R., “Navigation using the global positioning system,” Chapter 6, class
notes, Air Force Institute of Technology, 1996.
Braasch, M. S., van Graas, F., “Guidance accuracy considerations for real-time
GPS interferometry,” Proceedings ION-GPS, Albuquerque, NM, September 11–13,
1991.
Nieuwejaar, P., “GPS signal structure,” NATO Agard lecture series No. 161, NAVSTAR GPS system, September 1988.
Jordan, E. C., Electromagnetic Waves and Radiating Systems, Prentice Hall, Englewood Cliffs, NJ, 1950.