Fundamentals of Global Positioning System Receivers A Software Approach - Chapter 5 pps
Bạn đang xem bản rút gọn của tài liệu. Xem và tải ngay bản đầy đủ của tài liệu tại đây (371.02 KB, 36 trang )
Fundamentals of Global Positioning System Receivers: A Software Approach
James Bao-Yen Tsui
Copyright
2000 John Wiley & Sons, Inc.
Print ISBN
0-471-38154-3 Electronic ISBN 0-471-20054-9
73
CHAPTER FIVE
GPS C
/
A Code Signal Structure
5.1 INTRODUCTION
(1,2)
In the previous chapters user positions are calculated. In order to perform the
user position calculation, the positions of the satellites and pseudoranges to
the satellites must be measured. Many parameters are required to calculate the
positions of the satellites and they are transmitted in the satellite signals.
This chapter provides the details associated with the GPS signals. Spilker
(1,2)
not only gives a very good discussion on the signal, it also gives the rea-
sons these signals are selected. The discussion in this chapter is limited to the
fundamentals of the signals, such that a receiver design can be based on the
signals.
There are basically two types of signals: the coarse (or clear)
/
acquisition
(C
/
A) and the precision (P) codes. The actual P code is not directly transmitted
by the satellite, but it is modified by a Y code, which is often referred to as
the P(Y) code. The P(Y) code is not available to civilian users and is primarily
used by the military. In other words, the P(Y) code is classified. The P(Y) code
has similar properties of the P code. In order to receive the P(Y) code, one must
have the classified code. Therefore, only the fundamentals of the P code will
be mentioned in this book. The discussion will be focused on the C
/
A code.
In general, in order to acquire the P(Y) code, the C
/
A code is usually acquired
first. However, in some applications it is desirable to acquire the P(Y) code
directly, which is known as direct Y acquisition.
The radio frequency (RF) of the C
/
A code will be presented first, then the
C
/
A code. The generation of the C
/
A code and its properties will be presented
because they are related closely to acquiring and tracking the GPS signals.
Finally, the data carried by the signals will be presented. The applications of
the data will be briefly discussed.
74 GPS C
/
A CODE SIGNAL STRUCTURE
5.2 TRANSMITTING FREQUENCY
(1–4)
The GPS signal contains two frequency components: link 1 (L1) and link 2
(L2). The center frequency of L1 is at 1575.42 MHz and L2 is at 1227.6 MHz.
These frequencies are coherent with a
10.23 MHz clock. These two frequencies
can be related to the clock frequency as
L
1 1575.42 MHz 154 × 10.23 MHz
L
2 1227.6 MHz 120 × 10.23 MHz
These frequencies are very accurate as their reference is an atomic frequency
standard. When the clock frequency is generated, it is slightly lower than
10.23
MHz to take the relativistic effect into consideration. The reference frequency
is off by
(3)
4.567 × 10
3
Hz, which corresponds to a fraction of 4.4647 ×
10
10
( 4.567 × 10
3
/
10.23 × 10
6
). Therefore, the reference frequency used by
the satellite is
10.229999995433 MHz (10.23 × 10
6
4.567 × 10
3
) rather than
10.23 MHz. When a GPS receiver receives the signals, they are at the desired
frequencies. However, the satellite and receiver motions can produce a Doppler
effect as discussed in Section
3.5. The Doppler frequency shift produced by the
satellite motion at L
1 frequency is approximately ±5 KHz.
The signal structure of the satellite may be modified in the future. However,
at the present time, the L
1 frequency contains the C
/
A and P(Y) signals, while
the L
2 frequency contains only the P(Y) signal. The C
/
A and P(Y) signals in
the L
1 frequency are in quadrant phase of each other and they can be written
as:
S
L1
A
p
P(t)D(t) cos(2pf
1
t + f) + A
c
C(t)D(t) sin(2pf
1
t + f)(5.1)
where S
L1
is the signal at L1 frequency, A
p
is the amplitude of the P code, P(t)
±1 represents the phase of the P code, D(t) ±1 represents the data code,
f
1
is the L1 frequency, f is the initial phase, A
c
is the amplitude of the C
/
A
code, C(t)
±1 represents the phase of the C
/
A code. These terms will be
further discussed in the following sections. In this equation the P code is used
instead of the P(Y) code. The P(Y), C
/
A, and the carrier frequencies are all
phase locked together.
The minimum power levels of the signals must fulfill the values listed in
Table
5.1 at the receiver. These power levels are very weak and the spectrum
is spread, therefore they cannot be directly observed from a spectrum analyzer.
Even when the signal is amplified to a reasonable power level, the spectrum of
the C
/
A code cannot be observed because the noise is stronger than the signal.
As discussed in Section
3.3, the received power levels at various points on
the earth are different. The maximum difference is about
2.1 dB between a point
just under the satellite and a point tangential to the surface of the earth. In order
to generate a uniform power over the surface of the earth, the main beam pattern
5.2 TRANSMITTING FREQUENCY 75
TABLE 5.1 Power Level of GPS Signals
P C
/
A
L
1 133 dBm 130 dBm
L
2 136 dBm 136 dBm
*
*
Presently not in L2 frequency.
of the transmitting antenna is slightly weaker at the center to compensate for the
user at the edge of the beam. The resulting power level versus elevation angle
is shown in Figure
3.10. The maximum power is 128 dBm, which occurs at
about
40 degrees. Of course, the receiving antenna pattern also contributes to
the power level of the receiver. Usually the receiving antenna has a higher gain
in the zenith direction. This incorporates the ability of attenuating multipath
but loses gain to signals from lower elevation angles. As discussed in Sections
3.3 and 3.10, the minimum required beam width of the transmitting antenna
to cover the earth is
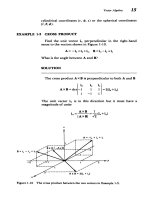
13.87 degrees. The beam width of the antenna
(2)
is 21.3
degrees, which is wider than needed to cover the earth as shown in Figure 5.1.
If the user is in an aircraft, as long as it is in the main beam of the GPS
signal and not in the shadow of the earth it can receive the signal. The signals
generated by the satellite transmitting antenna are right-hand polarized. There-
FIGURE 5.1 GPS signal main beam.
76 GPS C
/
A CODE SIGNAL STRUCTURE
fore, the receiver antenna should be right-hand polarized to achieve maximum
efficiency.
5.3 CODE DIVISION-MULTIPLE ACCESS (CDMA) SIGNALS
A signal S can be written in the following form:
S
A sin (2pft+ f)(5.2)
where A is the amplitude, f is the frequency, f is the initial phase. These three
parameters can be modulated to carry information. If A is modulated, it is
referred to as amplitude modulation. If f is modulated, it is frequency mod-
ulation. If f is modulated, it is phase modulation.
The GPS signal is a phase-modulated signal with f
j,p; this type of phase
modulation is referred to as bi-phase shift keying (BPSK). The phase change
rate is often referred to as the chip rate. The spectrum shape can be described
by the sinc function (sinx
/
x) with the spectrum width proportional to the chip
rate. For example, if the chip rate is
1 MHz, the main lobe of the spectrum has
a null-to-null width of
2 MHz. Therefore, this type of signal is also referred to
as a spread-spectrum signal. If the modulation code is a digital sequence with a
frequency higher than the data rate, the system can be called a direct-sequence
modulated system.
A code division multiple access (CDMA) signal in general is a spread-spec-
trum system. All the signals in the system use the same center frequency. The
signals are modulated by a set of orthogonal (or near-orthogonal) codes. In order
to acquire an individual signal, the code of that signal must be used to correlate
with the received signal. The GPS signal is CDMA using direct sequence to
bi-phase modulate the carrier frequency. Since the CDMA signals all use the
same carrier frequency, there is a possibility that the signals will interfere with
one another. This effect will be more prominent when strong and weak signals
are mixed together. In order to avoid the interference, all the signals should
have approximately the same power levels at the receiver. Sometimes in the
acquisition one finds that a cross-correlation peak of a strong signal is stronger
than the desired peak of a weak signal. Under this condition, the receiver may
obtain wrong information.
5.4 P CODE
(1,2)
The P code is bi-phase modulated at 10.23 MHz; therefore, the main lobe of the
spectrum is
20.46 MHz wide from null to null. The chip length is about 97.8 ns
(
1
/
10.23 MHz). The code is generated from two pseudorandom noise (PRN)
codes with the same chip rate. One PRN sequence has
15,345,000 chips, which
has a period of
1.5 seconds, the other one has 15,345,037 chips, and the dif-
5.5 C
/
A CODE AND DATA FORMAT 77
ference is 37 chips. The two numbers, 15,345,000 and 15,345,037, are relative
prime, which means there are no common factors between them. Therefore, the
code length generated by these two codes is
23,017,555.5 (1.5 × 15,345,037)
seconds, which is slightly longer than
38 weeks. However, the actual length of
the P code is
1 week as the code is reset every week. This 38-week-long code
can be divided into
37 different P codes and each satellite can use a differ-
ent portion of the code. There are a total of
32 satellite identification numbers
although only
24 of them are in the orbit. Five of the P code signals (33–37)
are reserved for other uses such as ground transmission. In order to perform
acquisition on the signal, the time of the week must be known very accurately.
Usually this time is found from the C
/
A code signal that will be discussed in
the next section. The navigation data rate carried by the P code through phase
modulation is at a
50 Hz rate.
5.5 C
/
A CODE AND DATA FORMAT
(1,2,5)
The C
/
A code is a bi-phase modulated signal with a chip rate of 1.023 MHz.
Therefore, the null-to-null bandwidth of the main lobe of the spectrum is
2.046
MHz. Each chip is about 977.5 ns (1
/
1.023 MHz) long. The transmitting band-
width of the GPS satellite in the L
1 frequency is approximately 20 MHz to
accommodate the P code signal; therefore, the C
/
A code transmitted contains
the main lobe and several sidelobes. The total code period contains
1,023 chips.
With a chip rate of
1.023 MHz, 1,023 chips last 1 ms; therefore, the C
/
A code
is
1 ms long. This code repeats itself every millisecond. The spectrum of a C
/
A
code is shown in Figure
5.2.
In order to find the beginning of a C
/
A code in the received signal only a
very limited data record is needed such as
1 ms. If there is no Doppler effect
on the received signal, then one millimeter of data contains all the
1,023 chips.
Different C
/
A codes are used for different satellites. The C
/
A code belongs to
the family of Gold codes,
(5)
which will be discussed in the next section.
Figure
5.3 shows the GPS data format. The first row shows a C
/
A code with
1,023 chips; the total length is 1 ms. The second row shows a navigation data
bit that has a data rate of
50 Hz; thus, a data bit is 20 ms long and contains
20 C
/
A codes. Thirty data bits make a word that is 600 ms long as shown in
the third row. Ten words make a subframe that is
6 seconds long as shown in
row four. The fifth row shows a page that is
30 seconds long and contains 5
subframes. Twenty-five pages make a complete data set that is 12.5 minutes
long as shown in the sixth row. The
25 pages of data can be referred to as a
superframe.
The parameters mentioned in Section
4.10 are contained in the first three
subframes of a page. If one can receive the information of these three subframes
from four or more satellites, the user location can be found. Theoretically, one
can take a minimum of about
18 seconds of data from four satellites and be
able to calculate the user position. However, the subframes from each satellite
78 GPS C
/
A CODE SIGNAL STRUCTURE
FIGURE 5.2 Spectrum of a C
/
A code.
will not reach the receiver at the same time. Besides, one does not know when
the beginning of subframe
1 will be received. A guaranteed way to receive the
first three subframes is to take
30 seconds (or one page) of data. Thus, one can
take a minimum of
30 seconds of data and calculate the user position.
5.6 GENERATION OF C
/
A CODE
(1,2,6)
The GPS C
/
A signals belong to the family of Pseudorandom noise (PRN)
codes known as the Gold codes. The signals are generated from the product
of two
1,023-bit PRN sequence G1 and G2. Both G1 and G2 are generated by
a maximum-length linear shift register of
10 stages and are driven by a 1.023
MHz clock. Figure 5.4 shows the G1 and G2 generators. Figure 5.4a shows the
G
1 generator and Figures 5.4b and 5.4c show the G2 generator. Figure 5.4c is
a simplified notation of Figure
5.4b.
The basic operating principles of these two generators are similar; therefore,
only G
2 will be discussed in detail. A maximum-length sequence (MLS) gener-
ator can be made from a shift register with proper feedback. If the shift register
has n bits, the length of the sequence generated is
2
n
1. Both shift generators
5.6 GENERATION OF C
/
A CODE 79
FIGURE 5.3 GPS data format.
in G1 and G2 have 10 bits, thus, the sequence length is 1,023 (2
10
1). The
feedback circuit is accomplished through modulo-
2 adders.
The operating rule of the modulo-
2 adder is listed in Table 5.2. When the
two inputs are the same the output is
0, otherwise it is 1. The positions of the
feedback circuit determine the output pattern of the sequence. The feedback
of G
1 is from bits 3 and 10 as shown in Figure 5.4a and the corresponding
polynomial can be written as G
1: 1 + x
3
+ x
10
. The feedback of G2 is from
bits
2, 3, 6, 8, 9, 10 as shown in Figure 5.4b and the corresponding polynomial
is G
2: 1 + x
2
+ x
3
+ x
6
+ x
8
+ x
9
+ x
10
.
In general, the output from the last bit of the shift register is the output of
the sequence as shown in Figure
5.4a. Let us refer to this output as the MLS
output. However, the G
2 generator does not use the MLS output as the output.
The output is generated from two bits which are referred to as the code phase
selections through another modulo-
2 adder as shown in Figures 5.4b and c. This
G
2 output is a delayed version of the MLS output. The delay time is determined
by the positions of the two output points selected.
80 GPS C
/
A CODE SIGNAL STRUCTURE
FIGURE 5.4 G1, G2 maximum-length sequence generators.
Figure 5.5 shows the C
/
A code generator. Another modulo-2 adder is used
to generate the C
/
A code, which uses the outputs from G1 and G2 as inputs.
The initial values of the two shift registers G
1 and G2 are all 1’s and they must
be loaded in the registers first. The satellite identification is determined by the
TABLE 5.2 Modulo-2 Addition
Input 1 Input 2 Output
000
011
101
11
0
5.6 GENERATION OF C
/
A CODE 81
FIGURE 5.5 C
/
A code generator.
two output positions of the G2 generator. There are 37 unique output positions.
Among these
37 outputs, 32 are utilized for the C
/
A codes of 32 satellites,
but only
24 satellites are in orbit. The other five outputs are reserved for other
applications such as ground transmission.
Table
5.3 lists the code phase assignments. In this table there are five
columns and the first column gives the satellite ID number, which is from
1
to 32.
The second column gives the PRN signal number; and it is from
1 to 37.
It should be noted that the C
/
A codes of PRN signal numbers 34 and 37 are
the same. The third column provides the code phase selections that are used to
form the output of the G
2 generator. The fourth column provides the code delay
measured in chips. This delay is the difference between the MLS output and the
G
2 output. This is redundant information of column 3, because once the code
phase selections are chosen this delay is determined. The last column provides
the first
10 bits of the C
/
A code generated for each satellite. These values can be
used to check whether the generated code is wrong. This number is in an octal
format.
The following example will illustrate the use of the information listed in
Table
5.3. For example, in order to generate the C
/
A code of satellite 19, the
3 and 6 tabs must be selected for the G2 generator. With this selection, the G2
output sequence is delayed 471 chips from the MLS output. The last column is
1633, which means 1 110 011 011 in binary form. If the first 10 bits generated
for satellite
19 do not match this number, the code is incorrect.
82 GPS C
/
A CODE SIGNAL STRUCTURE
TABLE 5.3 Code Phase Assignments
Satellite ID GPS PRN Code Phase Code Delay First 10 Chips
Number Signal Number Selection Chips
C
/
A Octal
112⊕ 651440
223
⊕ 7 6 1620
334
⊕ 8 7 1710
445
⊕ 981744
551
⊕ 917 1133
662
⊕ 10 18 1455
771
⊕ 8139 1131
882
⊕ 9 140 1454
993
⊕ 10 141 1626
10 10 2
⊕ 3 251 1504
11 11 3
⊕ 4 252 1642
12 12 5
⊕ 6 254 1750
13 13 6
⊕ 7 255 1764
14 14 7
⊕ 8 256 1772
15 15 8
⊕ 9 257 1775
16 16 9
⊕ 10 258 1776
17 17 1
⊕ 4469 1156
18 18 2
⊕ 5 470 1467
19 19 3
⊕ 6 471 1633
20 20 4
⊕ 7 472 1715
21 21 5
⊕ 8 473 1746
22 22 6
⊕ 9 474 1763
23 23 1
⊕ 3 509 1063
24 24 4
⊕ 6 512 1706
25 25 5
⊕ 7 513 1743
26 26 6
⊕ 8 514 1761
27 27 7
⊕ 9 515 1770
28 28 8
⊕ 10 516 1774
29 29 1
⊕ 6859 1127
30 30 2
⊕ 7 860 1453
31 31 3
⊕ 8 861 1625
32 32 4
⊕ 9 862 1712
**
33 5 ⊕ 10 863 1745
**
34
*
4 ⊕ 10 950 1713
**
35 1 ⊕ 7947 1134
**
36 2 ⊕ 8 948 1456
**
37
*
4 ⊕ 10 950 1713
*
34 and 37 have the same C
/
A code.
**
GPS satellites do not transmit these codes; they are reserved for other uses.
5.7 CORRELATION PROPERTIES OF C
/
A CODE 83
A computer program (p51) is listed at the end of this chapter to generate
both the MLS and G
2 output sequences. The program takes columns 3 and 4
of Table 5.3 as inputs and checks the time delay. If the correct data are used
as inputs, the output will show “OK,” otherwise, it will show “not match.”
A program (p52) can be used to generate the C
/
A code. The program is an
extension of the program (p51) to include the two maximum-length sequence
generators. In the program, the delay time listed in Table
5.3 is used as input
to generate the G
2 signal rather than using the code phase selections in column
3. The first 10 bits of the generated C
/
A code should be compared with the
result listed in the last column of Table
5.3.
5.7 CORRELATION PROPERTIES OF C
/
A CODE
(1,2)
One of the most important properties of the C
/
A codes is their correlation result.
High autocorrelation peak and low cross-correlation peaks can provide a wide
dynamic range for signal acquisition. In order to detect a weak signal in the
presence of strong signals, the autocorrelation peak of the weak signal must be
stronger than the cross-correlation peaks from the strong signals. If the codes
are orthogonal, the cross correlations will be zero. However, the Gold codes
are not orthogonal but near orthogonal, implying that the cross correlations are
not zero but have small values.
The cross correlation of the Gold code is listed in Table
5.4.
(1)
TABLE 5.4 Cross Correlation of Gold Code
Number of Shift Normalized Cross Probability of
Code Period Register Stages Correlation Level
Level
P
2
n
1
n odd
2
(n + 1)
/
2
+ 1
P
1
P
2
(n + 2)
/
2
1
P
0.25
0
.5
0
.24
P 2
n
1
n even
2
(n + 2)
/
2
+ 1
P
1
P
2
(n + 2)
/
2
1
P
0.125
0
.75
0.125
84 GPS C
/
A CODE SIGNAL STRUCTURE
FIGURE 5.6 Auto and cross correlation of C
/
A code.
For the C
/
A code n even 10, thus, P 1023. Using the relations in the above
table, the cross-correlation values are:
65
/
1023 (occurrence 12.5%), 1
/
1023
(75%), and 63
/
1023 (12.5%). The autocorrelation of the C
/
A codes of satellite
19 and the cross correlation of satellites 19 and 31 are shown in Figures 5.6a
and
5.6b respectively. These satellites are arbitrarily chosen.
In Figure
5.6a, the maximum of the autocorrelation peak is 1023, which
equals the C
/
A code length. The position of the maximum peak is deliberately
shifted to the center of the figure for a clear view. The rest of the correlation
has three values
63, 1, and 65. The cross-correlation shown in Figure 5.6b
also has three values
63, 1, 65.
These are the values calculated by using equations in Table
5.4. The difference
between the maximum of the autocorrelation to the cross correlation determines
the processing gain of the signal. In order to generate these figures, the outputs
from the C
/
A code generator must be 1 and 1, rather than 1 and 0. The mathe-
matical operation to generate these figures will be discussed in the Section
7.7.
5.8 NAVIGATION DATA BITS
(2,3,7)
The C
/
A code is a bi-phase coded signal which changes the carrier phase
between
0 and p at a rate of 1.023 MHz. The navigation data bit is also bi-
5.9 TELEMETRY (TLM) AND HAND OVER WORD (HOW) 85
phase code, but its rate is only 50 Hz, or each data bit is 20 ms long. Since the
C
/
A code is 1 ms, there are 20 C
/
A codes in one data bit. Thus, in one data
bit all
20 C
/
A codes have the same phase. If there is a phase transition due to
the data bit, the phases of the two adjacent C
/
A codes are different by ±p. This
information is important in signal acquisition. One can perform signal acquisi-
tion on two consecutive
10 ms of data. Between two consecutive sets of 10 ms
of data there is at most one navigation data bit phase transition. Therefore, one
set of these data will have no data bit phase transition and coherent acquisition
should produce the desired result. Thirty data bits make a navigation word and
10 words make a subframe. Figure 5.3 shows these relations.
The GPS time is given by the number of seconds in one week and this value
is reset every week at the end
/
start of a week. At end
/
start of a week the cyclic
paging to subframes
1 through 5 will restart with subframe 1 regardless of which
subframe was last transmitted prior to end
/
start of week. The cycling of the 25
pages will restart with page 1 of each of the subframes, regardless of which page
was the last to be transmitted prior to the end
/
start of week. All upload and
page cutovers will occur on frame boundaries (i.e., modulo
30 seconds relative
to end
/
start of week). Accordingly, new data in subframes 4 and 5 may start
to be transmitted with any of the
25 pages of these subframes.
In the following sections the navigation data will be discussed. Only the lim-
ited information used to determine the user position will be included. Detailed
information can be found in references
3 and 7.
5.9 TELEMETRY (TLM) AND HAND OVER WORD (HOW)
(2,3,7)
As previously mentioned, five subframes make a page. The first two words of all
the subframes are the telemetry (TLM) and hand over word (HOW). Each word
contains
30 bits and the message is transmitted from bit 1 to bit 30. These two
words are shown in Figure
5.7. The TLM word begins with an 8-bit preamble,
followed by
16 reserved bits and 6 parity bits. The bit pattern of the preamble
is shown in this figure. The bit pattern of the preamble will be used to match
the navigation data to detect the beginning of a subframe.
The HOW word can be divided into four parts.
1. The first 17 bits (1–17) are the truncated time of week (TOW) count that
provides the time of the week in units of
6 seconds. The TOW is the
truncated LSB of the Z count, which will be discussed in the next sec-
tion.
2. The next two bits (18, 19) are flag bits. For satellite configuration 001
(block II satellite) bit 18 is an alert bit and bit 19 is antispoof. Satellites
are procured in blocks. Most block I satellites are experimental ones and
all the satellites in orbit are from block II. When bit
18 1, it indicates that
the satellite user range accuracy may be worse than indicated in subframe
86 GPS C
/
A CODE SIGNAL STRUCTURE
FIGURE 5.7 TLM and HOW words.
1 and the user uses the satellite at the user’s own risk. Bit 19 1 indicates
the antispoof mode is on.
3. The following three bits (20–22) are the subframe ID and their values are
1, 2, 3, 4, and 5 or (001, 010, 011, 100, and 101) to identify one of the
five subframes. These data will be used for subframe matching.
4. The last 8 bits (23–30) are used for parity bits.
5.10 GPS TIME AND THE SATELLITE Z COUNT
(3)
GPS time is used as the primary time reference for all GPS operation. GPS
time is referenced to a universal coordinated time (UTC). The GPS zero time is
defined as midnight on the night of January
5
/
morning of January 6, 1980. The
largest unit used in stating GPS time is one week, defined as
604,800 seconds
(
7 × 24 × 3600). The GPS time may differ from UTC because GPS time is
a continuous time scale, while UTC is corrected periodically with an integer
number of leap seconds. The GPS time scale is maintained to be within one
ms of UTC (modulo of one second). This means the two times can be different
by an integer number of seconds. A history of the difference of UTC and GPS
time will be shown in Section
5.14.
In each satellite, an internally derived
1.5-second epoch, the Z count, provides
5.10 GPS TIME AND THE SATELLITE Z COUNT 87
FIGURE 5.8 Z count and TOW count.
a convenient unit for precise counting and communication time. The Z count has
29 bits consisting of two parts: the 19 least-significant bits (LSBs) referred to as
the time of the week (TOW) and the
10 most-significant bits (MSBs) as the week
number. In the actual data transmitted by the satellite, there are only
27 Z count
bits. The
10-bit week number is in the third word of subframe 1. The 17-bit TOW
is in the HOW in every subframe as discussed in the previous section. The two
LSBs are implied through multiplication of the truncated Z count.
The TOW count has a time unit of
1.5 sec and covers one week of time.
Since one week has
604,800 seconds, the TOW count is from 0 to 403,199
because 604,800
/
1.5 403,200. The epoch occurs at approximately midnight
Saturday night
/
Sunday morning, where midnight is defined as 0000 hours on
the UTC scale, which is nominally referenced to the Greenwich Meridian. Over
the years, the occurrence of the zero-state epoch differs by a few seconds from
0000 hours on the UTC scale. The 17-bit truncated version of the TOW count
covers a whole week and the time unit is
6 sec (1.5 sec × 4), which equals one
subframe time. This truncated TOW is from
0 to 100, 799, because 604,800
/
6
100,800.
The timeline is shown in Figure
5.8. In Figure 5.8 the Z count is at the
end and start of a week as shown in the upper part of the figure. The TOW
count consists of the
17 MSBs of the actual 19-bit TOW count at the start
of the next subframe as shown in the lower part of the figure. It is impor-
tant to note that since the TOW count shows the start of the next sub-
frame its value is
1 rather than 0 at the end and start of the week. Multi-
plying the truncated
17-bit TOW count by 4 converts to the actual 19-bit
88 GPS C
/
A CODE SIGNAL STRUCTURE
TOW count as shown in Figure 5.8. This operation changes the truncated TOW
from
0 to 100,799 to from 0 to 403,199, the full range of the Z count.
The
10 MSBs of the Z count is the week number (WN). It represents the
number of weeks from midnight on the night of January
5, 1980
/
morning of
January
6, 1980. The total range of WN is from 0 to 1023. At the expiration
of GPS week, the GPS week number will roll over to zero. Users must add
the previous
1,024 weeks into account when converting from GPS time to a
calendar date.
5.11 PARITY CHECK ALGORITHM
(3,7)
In this section the operation of parity bits will be discussed. From Figure 5.9
(in the following section) one can see that each word has 30 bits and 6 of these
are parity bits. These parity bits are used for parity check and to correct the
polarity of the navigation bits. If the parity check fails, the data should not be
used. In order to check parity,
8 parity bits are used. The additional two bits
are the last two bits (also the last two parity bits) from the previous word.
Let D
i
represent the data bits in a word received by a receiver where i 1, 2,
3, . . . , 24 represent the source data and i 25, 26, . . . , 30 represent the parity
bits. The parity encoding equations are listed in Table
5.5, where D
*
29
and D
*
30
are the twentyninth and thirtieth data of the previous word, ⊕ is the modulo-2
addition and its operation rule is listed in Table 5.2, D
25
through D
30
are the
parity data.
TABLE 5.5 Parity Encoding Equations
d
1
D
1
⊕ D
*
30
d
2
D
2
⊕ D
*
30
d
3
D
3
⊕ D
*
30
.
.
.
d
24
D
24
⊕ D
*
30
D
25
D
*
29
⊕ d
1
⊕ d
2
⊕ d
3
⊕ d
5
⊕ d
6
⊕ d
10
⊕ d
11
⊕ d
12
⊕ d
13
⊕ d
14
⊕ d
17
⊕ d
18
⊕d
20
⊕ d
23
D
26
D
*
30
⊕ d
2
⊕ d
3
⊕ d
4
⊕ d
6
⊕ d
7
⊕ d
11
⊕ d
12
⊕ d
13
⊕ d
14
⊕ d
15
⊕ d
18
⊕ d
19
⊕d
21
⊕ d
24
D
27
D
*
29
⊕ d
1
⊕ d
3
⊕ d
4
⊕ d
5
⊕ d
7
⊕ d
8
⊕ d
12
⊕ d
13
⊕ d
14
⊕ d
15
⊕ d
16
⊕ d
19
⊕d
20
⊕ d
22
D
28
D
*
30
⊕ d
2
⊕ d
4
⊕ d
5
⊕ d
6
⊕ d
8
⊕ d
9
⊕ d
13
⊕ d
14
⊕ d
15
⊕ d
16
⊕ d
17
⊕ d
20
⊕d
21
⊕ d
23
D
29
D
*
30
⊕ d
1
⊕ d
3
⊕ d
5
⊕ d
6
⊕ d
7
⊕ d
9
⊕ d
10
⊕ d
14
⊕ d
15
⊕ d
16
⊕ d
17
⊕ d
18
⊕d
21
⊕ d
22
⊕ d
24
D
30
D
*
29
⊕ d
3
⊕ d
5
⊕ d
6
⊕ d
8
⊕ d
9
⊕ d
10
⊕ d
11
⊕ d
13
⊕ d
15
⊕ d
19
⊕ d
22
⊕d
23
⊕ d
24
5.11 PARITY CHECK ALGORITHM 89
In using Table 5.5, the first 24 calculations must be carried out first. The
purpose is to generate a new set of data d
i
for i 1 to 24. If D
*
30
0, then
from the relation in Table
5.2 d
i
D
i
(for i 1 to 24), which means there is
no sign change. If D
*
30
1, then D
i
0 changes to d
i
1 and D
i
1 changes
to d
i
0 (for i 1 to 24). This operation changes the signs of the source bits.
These values of d
i
are used to check the parity relation given through D
25
to
D
30
.
In a receiver the polarity of the navigation data bits is usually arbitrarily
assigned. The operations listed in Table
5.5 can automatically correct the polar-
ity. If D
*
30
0, the polarity of the next 24 data bits does not change. If the D
*
30
1, the polarity of the next 24 data will change. This operation takes care of
the polarity of the bit pattern.
The equations listed in Table
5.5 can be calculated from a matrix operation.
This matrix is often referred as the parity matrix and defined as
(7)
123456789101112131415161718192021222324
H
111011000 111110011010010
011101100 011111001101001
101110110 001111100110100
010111011 000111110011010
101011101 100011111001101
001011011 110101000100111
(5.3)
This matrix matches the last six equations in Table
5.5. If a certain d
i
is present
a
1 will be placed in the matrix. If a certain d
i
does not exist, a zero will
be placed in the matrix. Note that each row in H is simply a cyclic shift of
the previous row except for the last row. In order to use the parity matrix,
the following property must be noted. The similarity between modulo-
2 and
multiplication of +
1 and 1 must be found first. The results in Table 5.2 are
listed in Table
5.6 again for comparison.
It appears that in order to use +
1, 1 multiplication to replace the modulo-2
addition the input should be converted as 0 +1 and 1 1. This operation
can extend to more than two inputs. This designation contradicts the conven-
tional approach from
0 1 and 1 +1. The following steps can be taken
to check parity:
1. Arbitrarily represent the data D
i
by 1 and 0 and change 1 1 and 0
+1.
2. Change the signs of D
i
(i 1 to 24) by multiplying them with D
*
30
. These
new data are as d
i
for i 1 to 24.
3. These values of d
i
for i 1 to 24 are used to multiply each row of the
H matrix element by element. The results are
6 rows and each row has
24 elements. Each element can be one of the three values +1, 0, and 1.
The nonzero terms, which are +
1 and 1, are multiplied together and the
90 GPS C
/
A CODE SIGNAL STRUCTURE
TABLE 5.6 Comparison of Modulo-2 Addition and +1, 1 Multiplication
Modulo-2 Addition Multiplication
Input
1 Input 2 Output Input 1 Input 2 Output
000+1 +1 +1
011
+1 1 1
101
1 +1 1
110
1 1 +1
new results should be either +1 or 1. These new results are multiplied
either by D
*
29
or D
*
30
according to last six equations in Table 5.5.
4. The final results should equal to [D
25
D
26
D
27
D
28
D
29
D
30
].
5. The last step is to convert +1, 1 back to 0 and 1 for further processing.
Subframe matching will be discussed in Section
9.4. A program with sub-
frame matching and parity check will be listed at the end of Chapter
9.
5.12 NAVIGATION DATA FROM SUBFRAME 1
(3,7)
The data contained in the first three subframes are shown in Figure 5.9. The
minimal parameters required to calculate the user position are contained in these
three subframes.
The data used for calculations of locations of the satellites and the user are
discussed below.
1. Week number (61–70): These ten bits are discussed in Section 5.9. Thus
represents the MSB of the Z counts and indicates the number of weeks
from midnight on the night of January
5, 1980
/
morning of January 6,
1980. Users must count the rollover if it is over 1,023 weeks.
2. User range accuracy (73–76): These four bits give the predicted user
range accuracy and its value N ranges from
0–15. The accuracy value X
is:
• If N is 6 or less, X 2
(1 + N
/
2)
(rounded-of-values N 1, X 2.8; N
3, X 5.7; N 5, X 11.3).
• If N is 6 or more, but less than 15, X 2
(N 2)
.
• N 15 will indicate the absence of an accuracy prediction and will
advise the user to use that satellite at the user’s risk.
3. Satellite health (77–82): These six bits represent the health indication of
the transmitting satellite. The MSB (bit
77) indicates a summary of the
health of the navigation data, where bit
77 equals:
0 All navigation data are OK.
1 Some or all navigation data are bad.
5.12 NAVIGATION DATA FROM SUBFRAME 1 91
FIGURE 5.9 Data in subframes 1, 2, and 3. ***Reserved. p: Parity bits. t: Two noninformation-bearing bits used for parity com-
putation.
92 GPS C
/
A CODE SIGNAL STRUCTURE
FIGURE 5.9 Continued.
5.12 NAVIGATION DATA FROM SUBFRAME 1 93
FIGURE 5.9 Continued.
94 GPS C
/
A CODE SIGNAL STRUCTURE
TABLE 5.7 Codes for Health of Satellite Signal Components
MSB LSB
00000 All signals OK.
11100 Satellite is temporarily out—do not use this
satellite during current pass.
11101 Satellite will be temporarily out–use with caution.
11110 Spare
11111 More than one combination would be required to
describe anomalies.
All other combinations Satellite experiencing code modulation and
/
or
signal level transmission problem—modulation
navigation data valid; however, user may
experience intermittent tracking problems if
satellite is acquired.
The five LSBs indicate the health of the signal components in Table 5.7.
Additional satellite health data are given in subframes
4 and 5. The data
given in subframe
1 may differ from that shown in subframes 4 and
/
or
5 of other satellites, since the latter may be updated at a different time.
4. Issue of data, clock (IODC) (83–84 MSB, 211–218 LSB): These 10-bit
IODC data indicate the issue number of the data set and thereby provide
the user with a convenient means of detecting any change in the correc-
tion parameters. The transmitted IODC will be different from any value
transmitted by the satellite during the preceding seven days. The rela-
tionship between IODC and IODE (in both subframes
2 and 3) will be
discussed in the next section.
5. Estimated group delay differential T
GD
(197–204): This eight-bit infor-
mation is a clock correction term to account for the effect of satellite
group delay differential. It is used in Equation (
4.38).
6. Satellite clock correction parameters: This subframe also contains the
four additional satellite clock correction parameters: t
oc
(219–234), a
f 0
(271–292), a
f 1
(249–264), and a
f 2
(241–248). They are used in Equation
(
4.37).
7. In subframe 1 there are some reserved data fields and their locations are
71–72; 91–114; 121–144; 151–174; 181–196. All reserved data fields sup-
port valid parity within their respective words.
The ephemeris parameters in subframe
1 are listed in Table 5.8.
5.13 NAVIGATION DATA FROM SUBFRAMES 2 AND 3
(3,7)
Figures 5.9b and c show the following ephemeris data contained in subframes
2 and 3:
5.13 NAVIGATION DATA FROM SUBFRAMES 2 AND 3 95
TABLE 5.8 Ephemeris Parameters in Subframe 1
Number Scale
of Factor Effective
Parameter Location Bits (LSB) Range
**
Units
WN: Week number
61-70 10 1 week
Satellite accuracy
73–76 4
Satellite health 77–82 6 1
IODC: Issue of data, clock 83–84 10
211
–218
T
GD
: Satellite group delay
differential
197–204 8
*
2
31
seconds
t
oe
: Satellite clock correction 219–234 16 2
4
604,784 seconds
a
f 2
: Satellite clock correction 241–248 8
*
2
55
sec
/
sec
2
a
f 1
: Satellite clock correction 249–264 16
*
2
43
sec
/
sec
a
f 0
: Satellite clock correction 271–292 22
*
2
31
seconds
*
Parameters so indicated are two’s complement, with the sign bit (+ or ) occupying the MSB.
**
Unless otherwise indicated in this column, effective range is the maximum range attainable with
indicated bit allocation and scale factor.
1. The issue of data, ephemeris (IODE): This parameter has 8 bits and is in
both subframes
2 (61–68) and 3 (271–278). The IODE equals the 8 LSB
of the IODC, which has
10 bits. The IODE provides the user with a con-
venient means for detecting any change in the ephemeris representation
parameters. The transmitted IODE will be different from any value trans-
mitted by the satellite during the preceding six hours. Whenever these
three terms, two IODEs from subframes
2, 3 and the 8 LSBs of the IODC,
do not match, a data set cutover has occurred and new data must be col-
lected.
Any change in the subframe
2 and 3 data will be accomplished in con-
cert with a change in both IODE words. Cutovers to new data will occur
only on hour boundaries except for the first data set of a new upload.
The first data set may be cut in at any time during the hour and therefore
may be transmitted by the satellite for less than one hour. Additionally,
the t
oe
value for at least the first data set transmitted by a satellite after
an upload will be different from that transmitted prior to the cutover.
2. The rest of the ephemeris data: These are listed in Tables 5.9 and 5.10.
3. Spare and reserved data fields: In subframe 2 bit 287 is reserved and bits
288–292 are spared. All spare and reserved data fields support valid parity
within their respective words. Contents of spare data fields are alternating
ones and zeros until they are allocated for a new function. Users are cau-
tioned that the contents of spare data fields can change without warning.
96 GPS C
/
A CODE SIGNAL STRUCTURE
TABLE 5.9 Ephemeris Parameters in Subframe 2
Number Scale
of Factor Effective
Parameter Location Bits (LSB) Range
Units
IODE
61–68 8 (see text)
C
rs
: Amplitude of 69–84 16 2
5
meters
the sine harmonic
correction terms to
the orbit radius
Dn: Mean motion
91–106 16
*
2
43
semicircles
/
difference from sec
computed value
M
0
: Mean anomaly at 107–114; 32
*
2
31
semicircle
reference time
121–144
C
uc
: Amplitude of the 151–166 16
*
2
29
radians
cosine harmonic
correction term to the
argument of latitude
of argument oflatitude
e
s
: Eccentricity 167–174; 32 2
33
dimensionless
181–204 0.03
C
us
: Amplitude of the 211–226 16
*
2
29
radians
sine harmonic correc-
tion term to the argu-
ment of latitude
a
s
: Square root of 227–234; 32 2
19
meters
1
/
2
the semimajor axis 241–264
t
oe
: Reference time
ephemeris
277–286 16 2
4
604,784 seconds
5.14 NAVIGATION DATA FROM SUBFRAMES 4 AND 5—SUPPORT
DATA
(3,7,8)
Both subframes 4 and 5 are subcommutated 25 times each. The 25 versions
of these subframes are referred to as pages
1 to 25 of each superframe. With
the possible exception of “spare” pages and explicit repeats, each page contains
different data in words
3 through 10, which are from bits 91–300. Subframe 4
has six different formats but only five of them are shown in Figure 5.10a. Five
pages,
1, 6, 11, 16, 21, are in one format. Six pages, 12, 19, 20, 22, 23, 24, are
in one format. Page
18 is in one format. Page 25 is in one format, and pages
13, 14, 15, and 17 are in one format. There are a total of 17 pages. Pages 2, 3,
4, 5, 7, 8, 9, and 10 are not shown because they have the same format as page
1 through 24 of subframe 5. Subframe 5 has two different formats as shown in
Figure
5.10b.
The information in subframes
4 and 5 and its applications are listed below:
5.14 NAVIGATION DATA FROM SUBFRAMES 4 AND 5—SUPPORT DATA 97
TABLE 5.10 Ephemeris Parameters in Subframe 3
Number Scale
of Factor Effective
Parameter Location Bits (LSB) Range
Units
C
ic
: Amplitude of the 61–76 16
*
2
29
radians
cosine harmonic
correction term to
angle of inclination
Q
e
: Longitude of 77–84;
ascending node of orbit
91–114 32
*
2
31
semicircles
plane at weekly epoch
C
is
: Amplitude of the 121–136 16
*
2
29
radians
sine harmonic correction
term to angle of inclina-
tion
i
0
: Inclination angle at 137–144; 32
*
2
31
semicircles
reference time
151–174
C
rc
: Amplitude of the 181–196 16
*
2
5
meters
sine harmonic correction
term to the orbit radius
q: Argument of perigee
197–204; 32
*
2
31
semicircles
211–234
˙
Q : Rate of right 241–264 24
*
2
43
semicircles
/
ascension sec
IDOE
271–278 (see text)
idot: Rate of inclination
279–292 14
*
2
43
semicircles
/
angle sec
1. Subframe 4:
• Pages 2, 3, 4, 5, 7, 8, 9, and 10 contain the almanac data for satellite
25 through 32. These pages may be designated for other functions. The
satellite ID of that page defines the format and content.
• Page 17 contains special messages.
• Page 18 contains ionospheric and universal coordinated time (UTC).
• Page 25 contains antispoof flag, satellite configuration for 32 satellites,
and satellite health for satellites
25–32.
• Pages 1, 6, 11, 12, 16, 19, 20, 21, 22, 23, and 24 are reserved.
• Pages 13, 14, and 15 are spares.
2. Subframe 5:
• Pages 1–24 contain almanac data for satellites 1 through 24.
• Page 25 contains satellite health for satellites 1 through 24, the almanac
reference time, and the almanac reference week number.