Essentials of Clinical Research - part 4 potx
Bạn đang xem bản rút gọn của tài liệu. Xem và tải ngay bản đầy đủ của tài liệu tại đây (225.94 KB, 36 trang )
6 The United States Federal Drug Administration (FDA) and Clinical Research 101
which it could be fairly and responsible concluded by such experts that the drug
will have the effect it purports or is represented to have under the conditions of use
prescribed, recommended, or suggested in the labeling or proposed labeling
thereof.” The argument that ensued from this definition centered on what the spe-
cific quality of evidence was in order to establish efficacy. It was the FDA’s posi-
tion that Congress intended to require at least two adequate and well-controlled
studies, each convincing on its own, to establish efficacy. There has been some
subsequent flexibility by the FDA in regard to the above as it applies to a specific
drug in development. In some cases, for example, the FDA has relied on informa-
tion from adequate and well-controlled studies published in the literature. In other
cases where it would be difficult to perform a second study due to ethical con-
cerns, the result of a single study could be accepted (as long as it was of excellent
design, provided highly reliable and statistically strong – p < 0.001 – evidence of
important clinical benefit-such as survival).
The requirement of more than 1 adequate and well-controlled investigation
reflects the need for independent substantiation of experimental results and refers
back to the question posed in Chapter 3 that asked why studies can presumably be
of similar design and yet lead to different results. Indeed, the FDA realized that any
clinical trial may be subject to unanticipated, undetected, systematic biases that
may be operative irrespective of the best intentions of sponsors and investigators.
They also note that the inherent variability in biological systems may produce a
positive trial by chance alone. In addition, results may be dependent on specific
issues related to the site or the investigator (e.g. concomitant treatments, diets etc.)
that may impact the generalizability of the results. Finally (and fortunately rarely),
favorable efficacy might be the product of scientific fraud. Independent substantia-
tion of experimental results then addresses these problems by providing consist-
ency across more than one study, thus greatly reducing the possibility that a biased,
chance, site-specific, or fraudulent result will lead to an erroneous conclusion that
a drug is effective.
The concept of independent substantiation of trial results, has often been
referred to as replication, but replication may imply precise repetition of the same
experiment. Actually, studies that are of different design, in different populations,
with different endpoints or dosage forms may provide evidence of efficacy, and
this may be even more convincing than repetition of the same study. It should be
noted, that it is usually not necessary to rely on a single study to support the effi-
cacy of a drug under development. This is because, in most situations there is a
need to explore the appropriate dose range, to study patients with differing com-
plexities and severities of disease, to compare the drug to other therapies, to per-
form safety studies, so that before marketing, most drugs will have been evaluated
in more than one study.
Another trend seen by the FDA is the increase in new drug applications from
foreign studies. In 2000, 27% of NDA’s contained pivotal data from foreign stud-
ies.
14
There is no current restriction on non-US studies being used to support an
NDA so long as they are well designed and conducted and the study sites are avail-
able for inspection.
102 S.P. Glasser et al.
FDA and Surgical Interventions
Carol M. Ashton MD MPH and Nelda P. Wray MD MPH
Whereas prescription drugs are regulated by the FDA, and for drug approval there
is the requirement that there be pre-release demonstration of efficacy and safety in
randomized trials, there are no FDA regulations governing surgical interventions.
Rather, new surgical interventions are developed based on anatomic and clinico-
pathological correlations in humans and studies in animals, and then used in
humans, with the initial experience reported as case reports or a series of cases.
Subsequent large scale dissemination of the procedure occurs as additional surgical
groups begin using it. It is only subsequently, when doubts set in about a given pro-
cedure, that its efficacy is evaluated in a randomized controlled trial. These RCTs
generally demonstrate that the procedure is less beneficial or more harmful than
originally thought, no better than a nonoperative course of action, beneficial for
only certain subgroups, or no better than a placebo (sham procedure). A classic
example of the above principles is the story of lung volume reduction surgery
(LVRS) for emphysema.
15
The first report of the use of LVRS in humans was pub-
lished in 1957
16
but the procedure did not become widely used until it was modified
in the mid 1990s by Joel Cooper.
17
Dr. Cooper reported his experience with 20 cases
in 1994 (abstract) and 1995 (paper). By 1996, 1,200 LVRS were performed in
Medicare beneficiaries, at an estimated cost of $30,000–70,000 each, not counting
physician charges. But here is where the LVRS story diverges from the typical sce-
nario. Scrutiny of LVRS by a consensus of experts as well as Medicare officials led
to concerns about the procedure’s effectiveness and safety. In a landmark deci-
sion,
18
Medicare officials decided that coverage for LVRS would only be provided
in the context of a clinical trial. This decision was challenged by Dr. Cooper and
others championing the procedure as unethical because of the “obvious benefit of
the procedure.” In record time, the NIH, Health Care Financing Administration
(now the Centers for Medicare and Medicaid Services) and the Agency for
Healthcare Research and Quality launched a randomized trial of LVRS vs. medical
therapy for severe emphysema, the National Emphysema Treatment Trial, enrolling
the first patient in 1997. The initial results, reported in 2003,
19
indicated that, in
1,219 patients followed for an average of 29 months, in certain subgroups of
patients, LVRS resulted in higher mortality rates than medical therapy. Based on the
trial results, Medicare officials limited coverage to patient subgroups that appeared
to benefit or at least not be harmed by LVRS. But the trial seems to have quenched
demand for LVRS. By 2006, as reported in the New York Times, “Medicare says it
will pay, but patients say ‘no thanks,’” only 458 Medicare claims for LVRS were
filed between January 2004 and September 2005.
20
Two other examples of this “evolutionary pattern” in the development of surgical
interventions are provided by carotid artery endarterectomy for stroke prevention;
and, arthroscopic treatment for relief of knee pain due to osteoarthritis. The first
case report of carotid artery endarterectomy in a human appeared in 1956.
21
By
1971, 15,000 carotid endarterectomies were performed in USA. By 1985, this had
increased to 107,000.
22
Criteria were then developed for the appropriate use of this
6 The United States Federal Drug Administration (FDA) and Clinical Research 103
procedure; when they were retrospectively applied to the carotid endarterectomies
performed on Medicare beneficiaries in 1981, only 35% of patients were found to
have undergone the procedure for “appropriate” reasons, and in another 32% the
reasons were equivocal.
22
Definitive randomized trials of carotid endarterectomy
were not conducted and reported until the mid 1990s.
23–25
The volume of carotid
artery endarterectomies in the US increased from 68,000 in 1990 to 134,000 in
2002, but the trials changed clinical practice: based upon the appropriateness crite-
ria, by 1999 only 8.6% could be deemed “inappropriate”.
26
On the other hand, 75%
of all carotid artery endarterectomies are now performed in asymptomatic patients,
in whom the risk:benefit ratio of the procedure is much narrower. In 2004, the FDA
approved for use the first carotid artery stent, and now carotid artery stenting is
being compared with carotid artery endarterectomy in RCTs. This fact illustrates
the fact the FDA’s role vis a vis surgical procedures is limited to regulating the vari-
ous devices that may be used in the course of performing them.
A final example of the evolution of new surgical approaches is that of arthro-
scopic lavage with or without debridement for knee pain due to osteoarthritis.
Fiberoptic arthroscopic debridement for this condition began to be used in the mid-
1970s. By 1996, more than 650,000 of these procedures were performed in US.
27
A definitive randomized trial of the efficacy of this procedure was not begun until
1995. That trial was a single site study in which 180 people were randomized in the
operating room to arthroscopic lavage, arthroscopic lavage plus debridement, or a
sham procedure (skin incisions with no entry into the joint) and followed for two
years. The study showed that arthroscopic lavage with our without debridement
was no better than the sham procedure in relieving pain and restoring function.
27
That same year, the Veterans Health Administration issued a directive that it would
no longer cover arthroscopic surgery for the relief of pain due to osteoarthritis, and
the Centers for Medicare and Medicaid shortly followed suit. Between 2000 and
2005, the volume of these procedures in VHA declined by 26%.
Clearly, there are challenges in designing an RCT to evaluate the efficacy of an
invasive therapeutic procedure. Potential randomized designs that could be used to
evaluate the efficacy of a procedure include comparing the operative procedure to
a non-operative course of therapy, the operative procedure against a sham or pla-
cebo procedure, and the operative procedure against an alternate operative proce-
dure. Evaluating an operative intervention against a non-operative comparator is by
far the most commonly used design, but blinding as to group assignment is impos-
sible, and expectancy bias on the part of patients and outcome assessors can affect
estimates of treatment effect, especially if the surgical procedure is intended to alter
subjective endpoints such as symptoms or function rather than more objective end-
points, e.g., death rates. In addition, because of participants’ and doctors’ treatment
preferences, crossovers may be a serious problem. For example, in a recent RCT of
diskectomy vs. nonoperative therapy for lumbar disk herniation, only 60% of peo-
ple randomized to surgery actually had the surgery, while 45% of those randomized
to the nonoperative arm crossed over and had the surgery.
28
The use of a sham pro-
cedure as a comparator in an RCT is limited, among other things, by the risks asso-
ciated with sham anesthesia and a sham procedure. These are dictated by the nature
104 S.P. Glasser et al.
of the active invasive procedure that is under evaluation. For many procedures, it
would be impossible to design a sham that would maintain blinding yet still be safe
for the patient. Ethical controversies about sham-procedure controlled surgical tri-
als continue to be debated.
29,30
Few placebo-controlled trials of surgical procedures
have been conducted; beside the knee arthroscopy trial already mentioned, the
Parkinson’s disease “burr hole” study is another recent example.
31
Finally, compar-
ing an invasive intervention to an invasive procedure that is part of the accepted
standard of care is that such a comparison is only of value if we are certain about
the efficacy of the comparator and if one can assume that that efficacy is the same
in the experiment to be performed as it has been in the past. Blinding as to treatment
group assignment is possible with the latter design, as it is with sham procedure
controls. As Baruch Brody has said regarding the issue of blinding in invasive
intervention trials, one needs a “…balancing of the scientific gains from blinding
against the burdens imposed on the subjects and deciding when the burdens are too
great”.
32
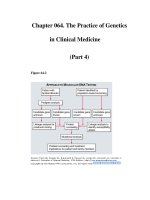
Table 6.1 summarizes the limitations of each of the above approaches.
Invasive therapeutic procedures pose other challenges in the design of rand-
omized trials to evaluate their efficacy, including:
●
The need to refine the surgical technique in humans: implications for the timing
of RCTs
●
Learning curves of individual surgeons
●
Unequal technical skill in the individual surgeon for various procedures
●
Patient – and doctor! preferences for operative vs. nonoperative intervention
●
Clinical uncertainty and equipoise: who defines these?
●
Modest effect sizes expected from most therapeutic interventions and implica-
tions for sample size and number of participating surgical centers
●
Difficulty of evaluating effects of an intervention aimed at alleviating subjective
parameters such as pain and discomfort
●
Placebo effect associated with invasive therapeutic procedures and
●
Control of expectancy bias in outcome assessments (blinding of patient, sur-
geon, outcome assessors)
Table 6.1 Choices of comparator in controlled trials of invasive therapeutic procedures
Comparator
Nonoperative Alternative invasive Sham
therapy procedure procedure
Random allocation possible Yes Yes Yes
(controls selection bias)
Blinding of patients possible No Yes Yes
(controls expectancy bias)
Blinding of outcome No Sometimes Yes
assessors possible
Minimization of crossovers No Yes Yes
(preserves best attributes of
random allocation)
6 The United States Federal Drug Administration (FDA) and Clinical Research 105
In summary, the current standard of practice is that invasive therapeutic procedures
are devised and become widely used in the public without first having been put to
scientifically valid demonstrations in humans (i.e., randomized controlled trials);
and, that their benefits exceed their harms and costs and those of alternative courses
of therapy. Additionally, “promising but unproven” procedures are performed for
decades before being tested in well planned and well conducted RCTs, and many
in common use have never been tested under such circumstances. Compared with
pre-release standards for prescription drugs, those for invasive procedures seem
antiquated at best. As Weinberg stated, “we need a way to assure the American
people that the needed evaluations of clinical theory are done in a timely way,
before plausible but wrong ideas get institutionalized into the everyday practice of
medicine”.
33
Adverse Event Reporting
The aforementioned paragraphs address the industries role in drug development,
and its lack of a role in surgical procedure development. From the FDA standpoint,
one of the more important interests is in monitoring the trials as they proceed and
to ensure patient safety during the process. Thus, for each trial, a mechanism must
be in place for a timely review of adverse events. In fact, one FDA report cited the
failure to report adverse events as required as one of the top ten problems surround-
ing clinical trials. The FDA definition of an adverse event is “any unfavorable and
unintended sign, symptom, or disease temporally associated with the use of a medi-
cal treatment or procedure regardless of whether it is considered related to the
treatment or procedure.”
Adverse drug events (ADEs) are classified by the FDA as serious when
death, life threatening occurrences, hospitalization, persistent or permanent dis-
ability, or the need for medical or surgical intervention occurs during (and up
to 30 days after) a clinical trial. An example of this is the report by
Suntharalingam et al. which occurred during a phase 1 trial. They describe the
events that occurred when six healthy volunteers received a dose of TGN1412
(a monoclonal antibody that affects T-cells). In all six subjects, a life threatening
cytokine-release syndrome developed.
There are a number of questions that address adverse event reporting as follows:
Are clinical trials powered in such a way as to address differences
in ADE’s vs. placebo or active control?
The answer to this is generally no. Phase 1–3 trials are powered based on presumed
efficacy beyond that of the control treatment, not based upon any ADE frequency.
Also, the entire drug development portfolio submitted to the FDA for drug approval
106 S.P. Glasser et al.
may consist of fewer than 5,000 patients exposed and certainly fewer than 10,000.
Most of those patients are represented by phase 3 trials, and by the time a phase 3
trial is launched common ADE’s will have already been ascertained. Given this,
ADE’s that occur even at a rate of 1 in 10,000 will not be revealed.
Does the manner in which ADE’S are ascertained matter?
This is a frequently argued point in which there is insufficient information to come
to a meaningful conclusion. Of course, most studies report ADE frequency, but the
absolute frequency depends upon whether ADE’s are ascertained verbally either by
general questions (e.g. “have you had any new symptoms since the last visit” or
specifically, e.g. “have you had any headaches since the last visit?”); or ascertained
by checklists either filled out by the patient or elicited by the study coordinator
and/or the PI. One can immediately see the strengths and weaknesses of each
approach. One of the attempts to evaluate these differences comes from the Acute
Myocardial Infarction Study (AMIS) as shown in Table 6.2. Not surprisingly, com-
pared to controls, the frequency of GI bleeding elicited by specific questions was
greater than those that were volunteered observations, but the relative difference
between the active and control treatments was nearly the same.
Does the use of surrogate endpoints affect the determination
of ADE frequency?
Recall that a surrogate endpoint is an outcome used in lieu of the real outcome of
interest, and the main reason surrogate endpoints are used is so the clinical trial will
be of shorter duration and/or have a smaller sample size. It is thus obvious that this
would decrease ones ability to uncover infrequent ADE’s. Surrogate endpoints are
more fully discussed in Chapter 3.
Table 6.2 Percentage reporting selected ADEs in AMIS
Volunteered Hematemesis Tarry stools Bloody stools
ASA 0.27 1.34 1.29
Placebo 0.09 0.67 0.45
Elicited
ASA 0.62 2.81 4.86
Placebo 0.27 1.74 2.99
The percentage is different for volunteered vs elicited; but, placebo: ASA differences
were the same
6 The United States Federal Drug Administration (FDA) and Clinical Research 107
Does the use of intention-to-treat analysis affect the determination
of ADE frequency?
As with the use of surrogate endpoints, ITT analysis can reduce ones ability to
determine the true ADE frequency. This is because, if a patient drops out from a
trial before completion, and does not receive the drug for the entire trial duration,
they will not have been fully exposed to the drug under study for the full time
period. Even if they are dropped for an ADE (which of course would be counted),
they might have had an additional ADE, had they been able to continue. Since ITT
is the primary analysis of a RCT (already a relatively short trial for the reasons
mentioned in Chapter 3) most RCTs underestimate the true ADE frequency.
The FDA and Advertising
The FDA has a clear mission of protecting the public health by assuring the safety,
efficacy, and security of human drugs…… The FDA is also responsible for advanc-
ing the public health by helping to speed innovations that make medicines more
effective, safer, and more affordable.
34
If we consider that the FDA is also respon-
sible to help the public get accurate, science-based information that is needed for
medicines to improve their health, then it is understandable that a key role of the
FDA is as a regulator and supervisor of manufacturer promotional activities.
The Division of Drug Marketing and Communications (DDMAC) in the Center
for Drug Evaluation and Research, at the US Food and Drug Administration (FDA),
is responsible for reviewing sponsor promotional materials, including prescription
drug advertising, promotional labeling, and materials prepared for prescribers.
35
The main objective of the Division is to ensure that information about prescription
drugs disseminated by sponsors to health care providers and consumers is not false
or misleading, that there is fair balance of benefit/risk information,
36
and that it is
accurately communicated.
37
Since 1962, the FDA was granted the responsibility to regulate prescription drug
advertising and labeling.
38,39
The regulations include reviewing written, printed, or
graphic material accompanying a regulated product (“promotional labeling”) and
materials published in journals and newspapers, broadcast, and telephone commu-
nications systems.
38,40
However, the FDA does not have the authority to require
sponsors to submit promotional materials for approval prior to their use.
41
According
to the Food, Drug and Cosmetics Act, manufacturers in their advertisements should
include a brief summary which truthfully communicates the product’s indication,
major side effects and contraindications, major warnings, significant precautions,
drug interactions, and they should present an adequate balance of risks and benefits.
For broadcast ads, two options are available to communicate drug information: a
brief summary or a toll-free telephone number or website.
42
Because manufacturers are not required to submit copies of advertisements at
the time of initial dissemination nor copies of advertising at the time of initial pub-
108 S.P. Glasser et al.
lication,
43
the FDA sees promotional materials only after they have been released or
broadcasted.
44
However, many manufacturers do submit their materials before air-
ing to avoid future problems. Once an advertisement is disseminated, if it contains
violative messages, the FDA can require corrective actions by means of untitled
letters, warning letters, injunctions and consent decrees, referrals for criminal
investigation, or prosecution and seizures.
44
Untitled letters or notices of violation are issued for less serious violations and
they usually require the sponsor to discontinue use of false or misleading advertis-
ing materials. Warning letters are usually issued when there are more serious viola-
tions (e.g. repetitive misconduct or there is a potential for serious health risks to the
public).
37
Warning letters contain a statement that failure to respond may result in
another regulatory action and that the FDA can initiate court proceedings for a sei-
zure, injunction, or criminal prosecution.
39
Therefore, when manufacturers receive
a warning letter, they are supposed to correct the problem immediately and dissemi-
nate the correct message using mailings and journals. However, a previous study
showed that the FDA enforcement actions against false and misleading drug ads
declined in 2002 and that there were delays in enforcement actions.
45–47
In November 2005, The Pharmaceutical Research and Manufacturers of America
(PhRMA) issued some principles on the advertising of prescription drugs but the
effect of those guidelines on warning letters is unknown. As a result of the above,
Salas et al. described the number, type, and content of warning letters for prescribed
medications and to assess if PhRMA guidelines had an effect on the number and
content of warning letters issued. They found that 25% of the overall warning letters
issued by the FDA were related directly with drugs and that 10% were focused on
drug-related promotional activities. They also found that half of the warning letters
were issued because of superiority claims which encourage prescriber’s not only to
use drugs but also to try the use of drugs for non approved indications (i.e. off-label
uses). In addition, they found an increase in warning letters issued in 1998 com-
pared to previous years, which may be an effect of changes in the 1997 law.
According to this law, the Food and Drug Administration Modernization Act of
1997 reauthorizes the Prescription Drug User Fee Act of 1992, regulating advertis-
ing of unapproved uses of approved drugs,
48
and it released a draft guidance for
direct to consumer advertising, which might have influenced an increase in the
production of promotional materials.
In summary, the USFDA has a long history of regulating new drug development,
and in trying to insure the safety of drugs both before and after they reach the mar-
ketplace. The regulatory authority granted to the FDA is a dynamic process and the
constant changes require continual updating of ones knowledge.
References
1. Lewis S, Baird P, Evans RG, et al. Dancing with the porcupine: rules for governing the
university-industry relationship. CMAJ. Sept 18, 2001; 165(6):783–785.
2. The Historical Guide to American Government. New York: Oxford Press; 1998.
3. = 73174.
6 The United States Federal Drug Administration (FDA) and Clinical Research 109
4. Swann R. History of the FDA. www.fda.gov/oc/history. Accessed May 9, 2007.
5. Guidance for Industry. www.fda.gov/cber/guidelines.
6. Thelithromycin. Wikipedia.
7. FDA Amendment Act of 2007; 2007.
8. The Mission Statement of the ICH. /> 9. Coronary Drug Project. www.fda.gov
10. Suntharalingam G, Perry MR, Ward S, et al. Cytokine storm in a phase 1 trial of the anti-CD28
monoclonal antibody TGN1412. N Engl J Med. Sept 7, 2006; 355(10):1018–1028.
11. European Medicines Agency (EMEA). http.www.emea.europa.
12. O’Donnell P. Not yet the last word on first-in-man. Appl Clin Trials. 2007; 16:34–38.
13. Palesch YY, Tilley BC, Sackett DL, Johnston KC, Woolson R. Applying a phase II futility
study design to therapeutic stroke trials. Stroke. Nov 2005; 36(11):2410–2414.
14. Henderson L. The long arm of the FDA. Appl Clin Trials. 2007.
15. Ramsey SD, Sullivan SD. Evidence, economics, and emphysema: medicare’s long journey
with lung volume reduction surgery. Health Aff (Millwood). Jan–Feb 2005; 24(1):55–66.
16. Brantigan OC, Mueller E. Surgical treatment of pulmonary emphysema. Am Surg. Sept 1957;
23(9):789–804.
17. Cooper JD, Trulock EP, Triantafillou AN, et al. Bilateral pneumectomy (volume reduction)
for chronic obstructive pulmonary disease. J Thorac Cardiovasc Surg. Jan 1995; 109(1):
106–116; discussion 116–109.
18. Tunis SR, Pearson SD. Coverage options for promising technologies: medicare’s ‘coverage
with evidence development’. Health Aff (Millwood). Sept–Oct 2006; 25(5):1218–1230.
19. Fishman A, Martinez F, Naunheim K, et al. A randomized trial comparing lung-volume-
reduction surgery with medical therapy for severe emphysema. N Engl J Med. May 22, 2003;
348(21):2059–2073.
20. Kolata G. Medicare says it will pay, but patients say ‘no thanks’. New York Times. March 3,
2006, 2006; C:1.
21. Al-Naaman YD, Carton CA, Cooley DA. Surgical treatment of arteriosclerotic occlusion of
common carotid artery. J Neurosurg. Sept 1956; 13(5):500–506.
22. Winslow CM, Solomon DH, Chassin MR, Kosecoff J, Merrick NJ, Brook RH. The appropri-
ateness of carotid endarterectomy. N Engl J Med. Mar 24, 1988; 318(12):721–727.
23. Beneficial effect of carotid endarterectomy in symptomatic patients with high-grade carotid
stenosis. North American Symptomatic Carotid Endarterectomy Trial Collaborators. N Engl
J Med. Aug 15, 1991; 325(7):445–453.
24. Endarterectomy for asymptomatic carotid artery stenosis. Executive Committee for the
Asymptomatic Carotid Atherosclerosis Study. JAMA. May 10, 1995; 273(18):1421–1428.
25. Barnett HJ, Taylor DW, Eliasziw M, et al. Benefit of carotid endarterectomy in patients with
symptomatic moderate or severe stenosis. North American Symptomatic Carotid
Endarterectomy Trial Collaborators. N Engl J Med. Nov 12, 1998; 339(20):1415–1425.
26. Halm EA, Tuhrim S, Wang JJ, Rojas M, Hannan EL, Chassin MR. Has evidence changed
practice?: appropriateness of carotid endarterectomy after the clinical trials. Neurology. Jan
16, 2007; 68(3):187–194.
27. Moseley JB, O’Malley K, Petersen NJ, et al. A controlled trial of arthroscopic surgery for
osteoarthritis of the knee. N Engl J Med. July 11, 2002; 347(2):81–88.
28. Weinstein JN, Tosteson TD, Lurie JD, et al. Surgical vs nonoperative treatment for lumbar
disk herniation: the Spine Patient Outcomes Research Trial (SPORT): a randomized trial.
JAMA. Nov 22, 2006; 296(20):2441–2450.
29. Horng S, Miller FG. Ethical framework for the use of sham procedures in clinical trials. Crit
Care Med. Mar 2003; 31(3 Suppl):S126–130.
30. Macklin R. The ethical problems with sham surgery in clinical research. N Engl J Med. Sept
23, 1999; 341(13):992–996.
31. Freed CR, Greene PE, Breeze RE, et al. Transplantation of embryonic dopamine neurons for
severe Parkinson’s disease. N Engl J Med. Mar 8, 2001; 344(10):710–719.
110 S.P. Glasser et al.
32. Brody BA. The Ethics of Biomedical Research: An International Perspective. New York:
Oxford University Press; 1998.
33. Wennberg JE. An apple a day? N Engl J Med. Sept 22, 1994, 1994; 331(12):815–816.
34. FDA Website. 6/10/07; />35. Division of Drug Marketing, Advertising, and Communications, Food and Drug Administration.
5/31/07; />36. 21 CFR Part 310 section 502(a) of the Food and Drug Administration Modernization Act of
1997. In: Department of Health and Human Services FaDA, ed. Vol 21 U.S.C. 352(a).
37. Baylor-Henry M, Drezin N. Regulation of prescription drug promotion: direct-to consumer
advertising. Clin Ther. 1998; 20(C):C86–C95.
38. Section 502(n) of the Food Drug and Cosmetics Act, and Title 21 Code of Federal Regulations.
Vol 202.1(1)(1).
39. Kessler DA, Pines WL. The federal regulation of prescription drug advertising and promotion.
JAMA. Nov 14, 1990; 264(18):2409–2415.
40. 21 CFR Part 310 section 502(a) of the Food and Drug Administration Modernization Act of
1997 (Modernization Act) In: Department of Health and Human Services FaDA, ed. Vol 21
U.S.C. 352 (n).
41. Section 502(n) of the Food Drug and Cosmetics Act, and Title 21 Code of Federal Regulations.
Vol 202.1(j)(1).
42. Section 502 (n) of the Food Drug and Cosmetics Act, and Title 21 Code of Federal
Regulations. Vol 202.1.
43. 21 CFR Part 310 section 502(a) of the Food and Drug Administration Modernization Act of
1997 (Modernization Act). Vol 21 314.81(b)(3).
44. Woodcock J. Statement by Janet Woodcock, MSD Director, Center of Drug Evaluation and
Research. US Drug Administration. Rockville, MD: Department of Health and Human
Services; 2003.
45. Gahart MT, Duhamel LM, Dievler A, Price R. Examining the FDA’s oversight of direct to
consumer advertising. Health Affairs. 2003; W3:120–123.
46. Waxman HA. Ensuring that consumers receive appropriate information from drug ads: what
is the FDA’s role? Health Affairs. 2004; W4:256–258.
47. Waxman RHA. Letter from Rep. Henry A. Waxman to the Honorable Tommy G. Thompson.
= 441. Accessed June 1, 2007.
48. Food and Drug Administration.
Accessed October 6, 2007.
Chapter 7
The Placebo and Nocebo Effect
Stephen P. Glasser and William Frishman
If a placebo were submitted to the FDA for approval, they
would no doubt be impressed with its efficacy, but would
probably not approve it due to its frequent side effects.
Anon
Abstract There are four general reasons for clinical improvement in a patient’s
condition: (1) natural history of the disease; (2) specific effects of the treatment; (3)
regression to the mean; and (4) nonspecific effects of the treatment that are attribut-
able to factors other than the specific active components. The latter effect is included
under the heading ‘placebo effect’. In this chapter the placebo effect will be discussed,
with some emphasis on regression to the mean. Placebos (‘I will please’) and their
lesser known counterpart’s nocebo’s (I will harm’) are sham treatments. The differ-
ence is in the response to the inert therapy. A beneficial response to an inert substance
is a placebo response; a side effect to an inert substance is a nocebo response.
Placebo has been cited in PubMed over 100,000 times indicating that placebo has
set the standard for how clinical research and particularly clinical trials are con-
ducted. On the other hand, some have argued that placebo effects are overstated and
can be explained by other variables (e.g. changes in the natural history of the dis-
ease, regression to the mean, methodological issues, conditioned answers, etc.).
Because of the importance, controversy, and to date inadequate study of the placebo
effect, this chapter presents more detail than many of the other chapters. In addi-
tion, the discussion of placebos requires an understanding of the ethics of clinical
trials, intention to treat analysis, surrogate endpoints and many of the other areas
that have been discussed. As such this chapter can also be used to review those
concepts.
Placebos (‘I will please’) and their lesser known counterpart’s nocebo’s (I will
harm’) are sham treatments. The difference is in the response to the inert therapy.
A beneficial response to an inert substance is a placebo response; a side effect to an
inert substance is a nocebo response.
There are four general reasons for clinical improvement in a patient’s condition:
(1) natural history of the disease; (2) specific effects of the treatment; (3) regression
S.P. Glasser (ed.), Essentials of Clinical Research, 111
© Springer Science + Business Media B.V. 2008
112 S.P. Glasser, W. Frishman
to the mean; and (4) nonspecific effects of the treatment that are attributable to fac-
tors other than the specific active components. The latter effect is included under
the heading ‘placebo effect’.
1
Each time a physician recommends a diagnostic or
therapeutic intervention for a patient, built into this clinical decision is the possibil-
ity of a placebo effect, that is, a clinical effect unrelated to the intervention itself.
2
Simple diagnostic procedures such as phlebotomy or more invasive procedures
such as cardiac catheterization have been shown to have important associated pla-
cebo effects.
3,4
Chalmers
5
has stated that a simple review of the many abandoned
therapies reveals that many patients would have benefited by being assigned to a
placebo control group. In fact, what might represent the first known clinical trial,
and one in which the absence of a placebo control group led to erroneous conclu-
sions, is a summary attributed to Galen in 250 BC, who stated that ‘some patients
that have taken this herbivore have recovered, while some have died; thus, it is obvi-
ous that this medicament fails only in incurable diseases.’
6
Placebo effects are commonly observed in patients with cardiac disease who
also receive drug and surgical therapies as treatments. Rana et al. noted the ‘tremen-
dous power of the placebo effect’ in patients with end-stage coronary disease in
clinical trials of angiogenesis and laser myocardial revascularization.
7
They also
commented on the fact that the observed improvements were not limited to ‘soft’
symptomatic endpoints but were also observed with ‘hard’ endpoints such as exer-
cise time, and in magnetic resonance imaging.
7
Rana et al. also studied the longev-
ity of the placebo effect from published clinical trials. They found that the beneficial
effects of placebo (on angina class, angina frequency, and exercise time) persisted
over the long term (up to 2 years).
Definition
Stedman’s Medical Dectionary
8
defines the word ‘placebo,’ which originates from
Latin verb meaning ‘I shall please,’ to have two meanings. First, a placebo may be
an inert substance prescribed for its suggestive value. Second, it may be an inert
substance identical in appearance with the compound being tested in experimental
research, and the use of which may or may not be known by the physician or the
patient; it is given to distinguish between the action of the compound and the sug-
gestive effect of the compound under study.
9
Currently, there is some disagreement as to the exact definition of a placebo.
8,9
Many articles on the subject include a broader definition, as given by Shapiro in
1961.
10
Any therapeutic procedure (or that component of any therapeutic procedure)
which is given deliberately to have an effect or unknowingly has an effect on a
patient, symptom, syndrome, or disease, but which is objectively without specific
activity for the condition being treated. The therapeutic procedure may be given
with or without conscious knowledge that the procedure is a placebo, may be an
7 The Placebo and Nocebo Effect 113
active (noninert) or nonactive (inert) procedure, and includes, therefore, all medi-
cal procedures no matter how specific—oral and parenteral medication, topical
preparations, inhalants, and mechanical, surgical and psychotherapeutic proce-
dures. The placebo must be differentiated from the placebo effect, which may or
may not occur and which may be favorable or unfavorable. The placebo effect is
defined as the changes produced by placebos. The placebo is also used to describe
an adequate control in research’.
A further refinement of the definition was proposed by Byerly
11
in 1976 as ‘any
change in a patient’s symptoms that are the result of the therapeutic intent and not
the specific physiochemical nature of a medical procedure.
Placebo Effect in Clinical Trials
The use of placebo controls in medical research was advocated in 1753 by Lind
12
in an evaluation of the effects of lime juice on scurvy. After World War II, research
protocols designed to assess the efficacy and safety of new pharmacologic therapies
began to include the recognition of the placebo effect. Placebos and their role in
controlled clinical trials were recognized in 1946, when the Cornell Conference on
Therapy devoted a session to placebos and double-blind methodology. At that time,
placebos were associated with increased heart rate, altered respiration patterns,
dilated pupils, and increased blood pressure.
9
In 1951, Hill
13
concluded that for a
change for better or worse in a patient to be attributable to a specific treatment, this
result must be repeatable a significant number of times in similar patients.
Otherwise, the result was due simply to the natural history of the disease or the
passage of time. He also proposed the inclusion of a control group that received
identical treatment except for the exclusion of an ‘active ingredient.’ Thus the
‘active ingredient’ was separated from the situation within which it was used. This
control group, also known as a placebo group, would help in the investigations of
new and promising pharmacologic therapies.
13
Beecher
14
was among the first investigators to promote the inclusion of placebo
controls in clinical trials. He emphasized that neither the subject nor the physician
should know what treatment the subject was receiving and referred to this strategy
as the ‘double unknown technique.’ Today, this technique is called the ‘double-
blind trial’ and ensures that the expectations and beliefs of the patient and physician
are excluded from evaluation of new therapies. In 1955, Beecher reviewed 15 stud-
ies that included 1,082 patients and found that an average of 35% of these patients
significantly benefited from placebo therapy (another third had a lesser benefit).
14
He also concluded that placebos can relieve pain from conditions with physiologic
or psychological etiologies. He described diverse objective changes with placebo
therapy. Some medical conditions improved; they included severe postoperative
wound pain, cough, drug-induced mood changes, pain from angina pectoris, head-
ache, seasickness, anxiety, tension, and the common cold.
114 S.P. Glasser, W. Frishman
Characteristics of the Placebo Effect
There appears to be an inverse relation between the number of placebo doses that
needs to be administered and treatment outcomes. In a study of patients with post-
operative wound pain, 53% of the subjects responded to one placebo dose, 40% to
two or three doses, and 15% to four doses.
14
In analyzing the demographics of those
who responded to placebo and those who did not, Lasagna et al.
15
could find no
differences in gender ratios or intelligence quotients between the two groups. They
did find significant differences in attitudes, habits, educational backgrounds, and
personality structure between consistent responders and nonresponders.
15
In
attempting to understand the reproducibility of the placebo effect, they observed
that there was no relation between an initial placebo response and subsequent
responses with repeated placebo doses of saline.
14
Beecher
14
concluded that place-
bos are most effective when stress, such as anxiety and pain, is greatest. Placebo
responses are associated with dose response characteristics, frequency of dosing,
pill color (e.g. blue vs. pink pills are more sedating, yellow vs. green more stimulat-
ing) and, “branded placebo” is more effective than generic placebo. The magnitude
of effect is difficult to quantitate due to its diverse nature but it is estimated that a
placebo effect accounts for 30–40% of an interventions benefit.
Placebos can produce both desirable and adverse reactions. Some now use the
term placebo for the beneficial effects and nocebo for the adverse effects. Beecher
et al.
14
described >35 adverse reactions from placebos; the most common are listed
in Table 7.1. These reactions were recorded without the patient’s or physician’s
knowledge that a placebo had been administered. In one study in which lactose
tablets were given as a placebo, major adverse reactions occurred in three patients
16
The first patient had overwhelming weakness, palpitation, and nausea after taking
the placebo and the test drug. In the second patient, a diffuse rash developed and
then disappeared after placebo administration was discontinued. The third patient
had epigastric pain followed by watery diarrhea, urticaria, and angioneurotic edema
of the lips after receiving the placebo and the test drug.
16
Table 7.1 Most common adverse reactions from
placebo therapy (nocebo effect)
Reaction Incidence (%)
Dry mouth 9
Nausea 10
Sensation of heaviness 18
Headache 25
Difficulty concentrating 15
Drowsiness 50
Warm glow 8
Relaxation 9
Fatigue 18
Sleep disturbance 10
7 The Placebo and Nocebo Effect 115
Indeed, because of the substantial evidence of placebo ‘efficacy’ and placebo
‘side effects,’ some investigators have wittingly suggested that if placebo were
submitted to the United States Food and Drug Administration (FDA) for approval,
that the agency, though impressed with the efficacy data, would probably recom-
mend disapproval on the basis of the high incidence of side effects. Some authors
have questioned whether placebos are truly inert. Davis
17
pointed out that part of
the problem with the placebo paradox is our failure to separate the use of an inert
medication (if there is such as substance) from the phenomenon referred to as the
placebo effect. It might help us if we could rename the placebo effect the ‘obscure
therapeutic effect.’
For instance, in trials of lactase deficiency therapy, could the amount of lactose
in placebo tablets actually cause true side effects? The small amount of lactose
makes this possibility seem unlikely. Perhaps it is more likely that allergies to some
of the so-called inert ingredients in placebos cause reactions in predisposed per-
sons, although this explanation probably could not explain more than a small per-
centage of placebo side effects.
The most recent validation of the placebo effect occurred in 1962 when the
United States enacted the Harris-Kefauver amendments to the Food, Drug, and
Cosmetic Act. These amendments required proof of efficacy and documentation of
relative safety, in terms of the risk-benefit ratio for the disease to be treated, before
an experimental agent could be approved for general use.
18
In 1970, the FDA pub-
lished rules for ‘adequate and well-controlled clinical evaluations.’ The federal
regulations identified five types of controls (placebo, dose-comparison, active, his-
torical, and no treatment) and identified use of the placebo control as an indispen-
sable tool to achieve the standard.
19
However, the FDA does not mandate placebo
controls, and in fact has stated that placebo groups are ‘desirable, but need not be
interpreted as a strict requirement…The speed with which blind comparisons with
placebo and/or positive controls can be fruitfully undertaken varies with the nature
of the compound.’
19
In the publication regarding ‘Draft Guidelines for the Clinical
Evaluation of Anti-anginal Drugs,’ the FDA further states that ‘it should be recog-
nized that there are other methods of adequately controlling studies. In some stud-
ies, and in some diseases, the use of an active control drug rather than a placebo is
desirable, primarily for ethical reasons.’
19
Regression Towards the Mean (or Towards Mediocrity)
An important statistical concept and one that many mimic a placebo response or a
clinical response is regression towards the mean or regression towards mediocrity
(RTM). RTM identifies a phenomenon that a variable that is extreme on its first
measurement will tend to be closer to the center of the distribution on a later meas-
urement. The term originated with Sir Francis Galton who studied the relationship
between the height of parents and their adult offspring. He observed that children
of tall parents were (on average) shorter than their parents; while, children of short
116 S.P. Glasser, W. Frishman
parents were taller than their parents. Galton called this regression towards medi-
ocrity.
20
Another example of RTM from Ederer, who observed that during the first
week of the 1968 baseball season the top 10 and bottom 10 batters averaged 0.414
and 0.83 respectively. The following week they hit 0.246 and 0.206 while the aver-
age for the league remained stable.
21
At least three types of studies are potentially affected by RTM: a survey in which
subjects are selected for subsequent follow-up based upon an initial extreme value,
studies with no control groups, and even controlled trials. An example is taken from
the Lipid Research Clinics Prevalence Study, a sample population who had elevated
total cholesterol was asked to return for reevaluation. It would be expected that the
second measurement would on average be lower, and this would not be so had a
randomly selected sample been chosen for reevaluation.
22
The reason that a ran-
domly selected sample would be less likely to demonstrate RTM is because the
random sample would have representative values across the spectrum of cholesterol
measurements at the start, whereas the selected sample all initially had elevated
values. In studies that lack a control group, it is difficult to estimate RTM since the
best way to evaluate for RTM is to have a placebo control. But, even in controlled
clinical trials, RTM can be problematic. For example, in many trials subjects are
identified in two stages; at first screen, subjects with extreme values are asked to
return (and invariably have lower values) for entrance into the study. The choice of
baseline from which to measure the treatment effect then becomes an issue.
There are ways to limit the RTM effect. For example one can use the control
group to estimate RTM. Also, taking at least two pretreatment measures and using
the first to classify the subject and the second for baseline comparison, or using the
average of two or more measures, will be helpful. An example of the RTM principal
comes from the National Diet-Heart Study.
23
It had been repeatedly observed that a
low cholesterol diet given to subjects with high cholesterol values results in greater
cholesterol lowering that when the same diet is given to someone with lower cho-
lesterol values. In the National Diet-Heart Study subjects with a baseline choles-
terol > 242 mg/dL had a 15% reduction while those whose baseline cholesterol was
210–241 mg/dL had a 12% reduction.
23
There are two possible explanations of this
observation: one, that the diet hypothesis holds i.e. that subjects with high choles-
terol are more responsive to cholesterol lowering treatment than those with lower
cholesterol values; and two, that independent of dietary intervention subjects with
high cholesterol will (on average) decrease more than those with lower values due
to RTM. In fact, it is likely that both could occur simultaneously.
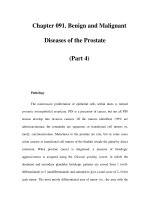
RTM then, is a phenomenon that can make a natural variation in repeated data
look like a real change. In biologic systems, most variables increase and decrease
around a mean (as, for instance, might be visualized as a sine wave). Thus, it is
likely that any value measured at a specific point in time will, by chance, either be
above or below the mean, and that a second measurement will be at a different point
around the mean and therefore different from the first measurement (Fig. 7.1). The
presumption is that this variability about the mean will be the same in the placebo
group as in the active treatment group (assuming adequate sample size and rand-
omization), so that differences between the two groups relative to regression to the
7 The Placebo and Nocebo Effect 117
mean will cancel out. When there is no placebo group, the distinction regarding
whether RTM has occurred is even more problematic. In an intervention study,
RTM cannot be observed because it is mixed into the genuine intervention effect.
This is particularly true of intervention studies where the population selected for
study generally is in the high risk groups – that is with values that are high at base-
line. Yudkin and Stratton evaluated this by analyzing a group with high baseline
cholesterol, and observing a 9% fall without any intervention.
24
These authors go
on to point out several ways of estimating the impact of RTM, and three suggested
approaches to minimizing the RTM problem. These approaches include the use of
an RCT design, since the RTM effect will be part of the total effect of the response
in both the intervention and control groups. However, the response in both groups
will be inflated by the RTM so the true impact of the intervention is not known and
is likely somewhat less that that observed. A second approach to minimizing RTM
is to obtain several measurements and average them to determine baseline. The
third approach is to use the first measurement as the basis for selection of the sub-
ject into the study, and a second measurement which will be used as the baseline
from which to assess the effect of the intervention.
The ideal comparator for a study would actually be no therapy vs. the investiga-
tional agent, however, the loss of blinding makes this problematic. There has been
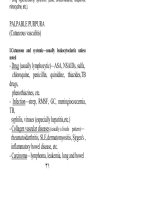
little study of the no therapy control, however, Asmar et al. did attempt to evaluate
this as part of a larger interventional trial.
25
They used a randomized cross-over
approach with a 1 month run-in followed by a 1 month placebo vs. no treatment
period. BP and ABPM were measured. The results could be then analyzed in terms
of the no treatment effect (no parameters changed in the two periods) and the RTM
effect shown in Fig. 7.2.
Time
Variable
A
B
x
y
Regression to the Mean
Fig. 7.1 If one measures a variable at its peak value (A in the example) the next measurement is
likely to be lower (B, x, or y in this example). Conversely, if one were to measure a variable at its
lowest point (B), the next measurement is likely to be higher
118 S.P. Glasser, W. Frishman
Mechanism of the Placebo Effect
Much has been discussed about the mechanism of the placebo response in patients.
However, the mechanism at the cellular level and the role of biochemical mediators
continues to escape detection.
Beecher
14
described two phases of suffering: first, the initial pain sensation or
other symptom, and second the person’s reaction to this sensation or experience by
the central nervous system. The first, or somatic, phase is associated with the source
of the pain or symptom; the second, or cortical, phase is superimposed on the pain
or symptom. An example of the influence of the effect of the mind on the body is
the ‘Anzio Effect.’ During World War II, injured soldiers at Anzio, Italy, com-
plained less of pain after surgery, than typical patients after surgery. This difference
was recognized because less than one third of the injured soldiers required mor-
phine, compared with four fifths of patients undergoing similar recovery from the
same surgery in non combatants. For the soldiers, the knowledge that they had sur-
vived, combined with the anticipation of returning home, probably reduced their
pain. Typical surgical patients are required to comply with hospital procedures,
probably producing anxiety or fear that acts to increase pain.
26
The physiologic mechanism begins when fear or anxiety activates the hypotha-
lamus-hypophysis-adrenal axis, resulting in release of catecholamines. These cate-
cholamines act on the body, which then sends feedback to the cerebral cortex via
Change During Placebo vs. No Therapy
-7
-6
-5
-4
-3
-2
-1
0
1
Change in Variables
SBP DBP MBP HR PP
Asmar et al Am J Hypertens, 2001,14;546
Asmar et al Am J Hypertens, 2001,14;546
Fig. 7.2 Change during placebo vs. no therapy
25
7 The Placebo and Nocebo Effect 119
neural connections. The thalamus in the diencephalons, which processes sensory
input before relaying it to the cerebral cortex, then sends recurrent axons to the tha-
lamus, presumably to allow modulation of the input received from the
thalamus.
26,27
One theory to explain the placebo effect is classical conditioning, the pairing of
an unconditioned stimulus with a conditioned stimulus until eventually the condi-
tioned stimulus alone elicits the same response as the unconditioned stimulus. This
effect of the environment on behavior was tested in a study by Voudouris et al.
28
They studied responses to pain stimulation with and without a placebo cream. A
visual analogue scale determined pain perception. To evaluate the effect of verbal
expectancy, the patients were informed that the placebo cream had powerful anal-
gesic properties (expectancy) or that the cream was neutral (no expectancy). To
determine the role of conditioning, the level of pain stimulus was reduced after
application of the cream (conditioning) or was maintained at the same level of pain
(no conditioning). The patients were divided into four groups: a group receiving
expectancy and conditioning, a group receiving only expectancy, a group receiving
only conditioning, and a group receiving neither. Both conditioning and verbal
expectancy were important mediators on the placebo response, but conditioning
was more powerful.
28
A second explanation for the placebo effect is response by neurohormones,
including motor or autonomic nervous systems, hormone systems, and immune
systems. Endogenous neuroendocrine polypeptides, including β-endorphins,
enkephalins, and antiopioids, are activated by many factors. These factors include
placebos, vigorous exercise, and other stressors. Modulation of the opioid system
may occur by an antiopiod system of neurotransmitters. γ-Aminobutyric acid, and
peptide neurotransmitter, is associated with the secretion of β-endorphin and
β-lipotropin.
26
The endorphin group of neurotransmitters is created from the proopiomelano-
cortitrophin peptide and is linked through β-lipotropin with the regulation of the
hypothalamus-hypophysis-adrenal axis. There is no understanding of the exact link
between the opioid-antiopioid and β-lipotropin systems of neuroendocrine pep-
tides. The brain peptides and their actions on presynaptic and postsynaptic recep-
tors on neurons also are not understood. Experiments in animals provide most of
the information about control of the genetic expression of the peptides.
26
In a double-blind study by Levine et al.,
29
patients received placebo and then
intravenous naloxone after tooth extraction. Naloxone, a partial opioid antagonist
that competes with β-endorphins for the same receptor in the brain, blocked the
placebo effect previously experienced by the patients. Levine et al.
29
concluded that
placebo activates β-endorphins in the brain and that naloxone increases the pain by
inhibiting the placebo effect.
A double-blind study by Hersh et al.
30
found ibuprofen to be more efficacious
than placebo or codeine. Naltrexone, a long-acting oral form of naloxone, given
before oral surgery reduced the analgesic response to placebo and to codeine
received after surgery. In an additional noteworthy finding, pretreatment with nal-
trexone prolonged the duration of ibuprofen’s action rather than diminishing the
120 S.P. Glasser, W. Frishman
peak analgesic response. This prolongation of ibuprofen’s action was hypothesized
to result from increased central stimulation of endogenous opiates by ibuprofen or
from competition by naltrexone for liver enzymes involved in the inactivation and
elimination of ibuprofen.
A third model of the placebo response is the ability of mental imagery to pro-
duce specific and measurable physiologic effects. This model explains the relation
between psychological and physiologic components of the placebo effect. There is
a conversion in the brain of psychological placebo-related imagery into a physio-
logic placebo response. A patient may modify his or her imagery content in
response to bodily reactions during treatment, in response to the behaviors and atti-
tudes of doctors or nurses, or in response to information about the treatment from
other sources (such as other patients, books, and journals).
31
An example of this model is described in another study.
32
Two matched groups
of patients preparing to undergo abdominal surgery received different types of care.
In one group, the anesthesiologist told the patients about the operation but not about
the postoperative pain. The other group was told about the postoperative pain and
assured that medication was available. The study found that the patients informed
about the postoperative pain needed only half the analgesic and left the hospital 2
days earlier. The authors concluded that this result showed ‘a placebo effect without
the placebo.’
32
Placebo Effect in Various Diseases
Placebo Effect in Ischemic Heart Disease and Chronic, Stable,
Exertional Angina Pectoris
The rate of improvement in the frequency of symptoms in patients with chronic, sta-
ble, exertional angina pectoris with placebo therapy has been assessed to be 30–
80%.
33
A summary of subjective and objective placebo effects in cardiovascular
disease is provided in Tables 7.2 and 7.3. Because of the magnitude of the placebo
effect, most studies of new antianginal therapies were performed with placebo con-
trol. However, the safety of this practice came under scrutiny in the late 1980s
because of concern that patients with coronary artery disease would have periods of
no drug treatment. As a result, Glasser et al.
34
explored the safety of exposing
patients with chronic, stable, exertional angina to placebos during short-term drug
trials with an average double-blind period of 10 weeks. The study samples were
taken from new drug applications submitted to the FDA. The results of these drug
trials were submitted, whether favorable or not, and all adverse events were reported.
Qualifying studies used symptom-limited exercise tolerance testing as an end point.
No antianginal medication, except sublingual nitroglycerin, was taken after a pla-
cebo-free or drug-free washout period. The placebo-controlled samples consisted of
12 studies, 6 studies using β-adrenergic blocking agents and 6 studies using calcium
7 The Placebo and Nocebo Effect 121
antagonists.
34
Of 3,161 patients who entered the studies, 197 withdrew because of
adverse cardiovascular events. Adverse events with β-Blocker therapy was not sig-
nificantly different when compared with placebo therapy, while calcium antagonist
therapy had a significantly higher rate of cardiovascular events compared with pla-
cebo therapy, This analysis by Glasser et al.
34
found evidence that supported the
safety of a placebo group in short-term drug trials for chronic, stable, exertional
angina. An analysis of the safety of a placebo control in trials of anti-hypertensive
drugs has also been published.
35
Although a slightly increased risk of reversible
symptoms was identified, there was no evidence of irreversible harm as a result of
participation in these trials. The same caveats apply as discussed in the angina trials-
that is, these were short term trials of carefully monitored and selected patients.
Table 7.2 Symptomatic placebo effects in cardiovascular disease
Placebo effect (%)
Improvement in chronic, stable 30–80
Angina pectoris
Improvement in heart failure 25–35
Table 7.3
Objective placebo effects in cardiovascular disease
Placebo effect
Heart failure
38
Exercise tolerance testing
1 or 2 baseline measurements 90–120 seconds
3–10 baseline measurements 10–30 seconds
Increase in ejection fraction of 5% 20–30% of patients
Hypertension
54
measured by noninvasive automatic 0%
ambulatory 24-hour monitoring
arrhythmia study 1
64a
A reduction in mean hourly frequency of < 65%
ventricular tachycardia
A reduction in mean hourly frequency of couplets < 75%
A reduction in mean hourly frequency of < 83%
all ventricular ectopic beats without
regard for complexity study 2
65b
Baseline VPCs > 100/hour < 3 times baseline
Baseline VPCs < 100/hour < 10 times baseline
Silent ischemic disease26 reduction in 44%
frequency of ischemic events
Reduction in ST-segment integral 50%
Reduction in duration of ST-segment depression 50%
Reduction of total peak ST-segment depression 7%
Other
68,70,73
Compliance with treatment at rate of ≥75% < 3 times baseline
VPC, ventricular premature complexes
a
Based on comparison of one control 24 hour monitoring period to one 24-hour treatment period.
Variability is so great that it may be inadvisable to pool individual patient data to detect trends in
ectopic frequency in evaluating new potential antiarrhythmic agents in groups of patients.
b
When differentiating proarrhythmia in patients with mixed cardiac disease and chronic ventricu-
lar arrhythmias from spontaneous variability, with false-positive rate of only 1%
122 S.P. Glasser, W. Frishman
The safety of using placebo in longer-term drug trials for chronic, stable, exer-
tional angina has not been established. A placebo-controlled trial by a European
group in 1986 enrolled 35 patients and made observations during a 6-month period
of placebo or short-acting nitroglycerin administration.
36
This study of the long-
term effects of placebo treatment in patients with moderately severe, stable angina
pectoris found a shift toward the highest dosage during the titration period. Seven
patients continued to receive the lowest dosage, but the average ending dosage was
65% more than the initial dosage. Compliance, when determined by pill count, for
27 patients was >80%. During the first 2.5 months of the trial, noncompliance with
the regimen or physical inability to continue to study was ascertained. No patients
died or had myocardial infarction.
36
There is a paucity of information regarding any gender differences in placebo
response. Women represented 43% of the population in the aforementioned
European study
36
and were more likely to have angina despite normal coronary
arteries. Because the placebo effect may be more pronounced in patients with nor-
mal coronary arteries, data from men were analyzed separately to compare them
with the overall results. However, the data from men were very similar to the over-
all results. In fact, the functional status of men showed more improvement attribut-
able to placebo (61%) than overall (48%) at 8 weeks. The results of this study
showed no adverse effects of long-term placebo therapy: 65% of patients reported
subjective, clinical improvement and 27% of patients reported objective, clinical
improvement in exercise performance.
36
Of note, improvement in exercise perform-
ance can occur when patients undergo repeated testing.
37
There is a problem inherent in all modern trials of antianginal therapy: because
anginal patterns vary and, with modern treatments, are infrequent, a surrogate
measure of antianginal effect has been adopted by the FDA and consists of tread-
mill walking time to the point of moderate angina. Also, just as there is a placebo
effect on angina frequency, a patient’s treadmill walking time frequently (50–75%)
improves with placebo therapy. Other potential mechanisms also partially explain
the improvement in exercise walking time in antianginal studies and are unrelated
to a treatment effect: they are the ‘learning phenomenon,’ and the ‘training effect.’
Because of the learning phenomenon, patients frequently show an improvement in
walking time between the first and second treadmill test in the absence of any treat-
ment. The presumption is that the first test is associated with anxiety and unfamili-
arity, which is reduced during the second test. Of greater importance is the training
effect, with which the frequency of treadmill testing may result in a true improve-
ment in exercise performance irrespective of treatment.
The effect of placebo on exercise tolerance in patients with angina was demon-
strated in the Transdermal Nitroglycerin Cooperative Study,
38
which analyzed vari-
ous doses of transcutaneous-patch nitroglycerin administered for 24-hour periods,
in comparison with placebo patch treatment. This study was particularly important
because it was the first large study to address the issue of nitrate tolerance with
transcutaneous patch drug delivery in outpatient ambulatory patients. The result of
the study was the demonstration of tolerance in all treated groups; the treated
groups performed no better than the placebo group at the study’s end. However,
7 The Placebo and Nocebo Effect 123
there was an equally striking improvement of 80–90 seconds in the placebo and
active treatment groups in the primary efficacy end point, walking time on a tread-
mill. This improvement in the placebo group could have masked any active treat-
ment effect, but it also demonstrated the importance of a placebo control, because
without this type of control, significant improvement could have been attributed by
deduction to active therapy.
It was once thought that internal mammary artery ligation improved angina pec-
toris until studies showed a similar benefit in patients in whom a sham operation,
consisting of skin incision with no ligation, was performed. Beecher
39
tried to ana-
lyze the effect of doctors’ personalities on clinical outcomes of internal artery liga-
tion, by comparing the results of the same placebo procedure performed by one of
two groups, the ‘enthusiasts’ or the ‘skeptics.’ His analysis indicated that the enthu-
siasts achieved nearly four times more ‘complete relief’ for patients than did the
skeptics, even though the procedure has no known specific effects.
39
Five patients
undergoing the sham operation emphatically described marked improvement.
40,41
In
objective terms, a patient undergoing the sham operation had an increase in work
tolerance from 4 to 10 minutes with no inversion of T waves on the electrocardio-
gram and no pain. The internal mammary artery ligation procedure was used in the
United States for 2 years before it was discontinued, when the procedure was dis-
proved by three small, well-planned, double-blind studies.
42
Carver and Samuels
43
also addressed the issue of sham therapy in the treatment
of coronary artery disease. They pointed out that although the pathophysiologic fea-
tures of coronary artery disease are well known, the awareness of many of the
expressions of myocardial ischemia are subjective, rendering the placebo effective
more important. This factor has resulted in several treatments that are based on tes-
timonials rather than scientific evidence and that have been touted as ‘break-
throughs.’ Among therapies cited by these authors are chelation therapy, various
vitamin therapies, and mineral supplements. Chelation therapy is an instructive
example of a widely used technique for which little scientific data are available. It
has been estimated that 500,000 patients per year in the United States are treated by
this technique. Before 1995, the data to support claims regarding the effectiveness
of chelation therapy were obtained from uncontrolled open-label studies. In 1994,
van Rij et al.
44
performed a double-blind, randomized, placebo-controlled study in
patients with intermittent claudication and demonstrated no difference in outcomes
between chelation and placebo treatments. The evaluated variables included objec-
tive and subjective measures, and improvement in many of the measures was shown
with both therapies. Again, without the use of a placebo control, the results could
have been interpreted as improvement as a result of chelation treatment.
Placebo Effect in Heart Failure
Until recently, the importance of the placebo effect in patients with congestive heart
failure (CHF) had not been recognized. In the 1970s and early 1980s, administration
124 S.P. Glasser, W. Frishman
of vasodilator therapy was given to patients in clinical trials without placebo con-
trol. Investigators believed that the cause of heart failure was predictable, so pla-
cebo-controlled trials were unnecessary. Another view of the unfavorable course of
heart failure concluded that withholding a promising new agent was unethical. The
ethical issues involved when placebo therapy is considered are addressed later in
this article.
With the inclusion of placebo controls in clinical trails, a 25–35% improvement
of patients’ symptoms was documented. This placebo response occurred in patients
with mild to severe symptoms and did not depend on the size of the study. The
assessment of left ventricular (LV) function can be determined by several methods,
including noninvasive echocardiography, radionuclide ventriculography, or inva-
sive pulmonary artery balloon-floatation catheterization. These methods measure
the patient’s response to therapy or the natural progression of the patient’s heart
failure.
45
Noninvasive measurements of LV ejection fraction vary, especially when the
ventricular function is poor and the interval between tests is 3–6 months. Packer
45
found that when a 5% increase in ejection fraction was used to determine a benefi-
cial response to a new drug, 20–30% of patients showed improvement while receiv-
ing placebo therapy. Overall, changes in noninvasive measures of LV function have
not been shown to correlate closely with observed changes in the clinical status of
patients with CHF. Most vasodilator and inotropic drugs can produce clinical bene-
fit without a change in LV ejection fraction. Conversely, LV ejection fraction may
increase significantly in patients who have heart failure and worsening clinical
status.
45
When invasive catheterization is used to evaluate the efficacy of a new drug,
interpretation must be done carefully because spontaneous fluctuations in hemody-
namic variables occur in the absence of drug therapy. To avoid the attribution of
spontaneous variability to drug therapy, postdrug effects should be assessed at fixed
times and threshold values should eliminate changes produced by spontaneous vari-
ability. Another factor that can mimic a beneficial drug response, by favorably
affecting hemodynamic measurements, is measurement performed immediately
after catheterization of the right side of the heart or after ingestion of a meal. After
intravascular instrumentation, systemic vasoconstriction occurs and resolves after
12–24 hours. When predrug measurements are done during the postcatheterization
period, any subsequent measurements will show beneficial effects because the
original measurements were taken in the vasoconstricted state. Comparative data
must be acquired after the postcatheterization vasoconstricted state has resolved.
45
In the past, one of the most common tests to evaluate drug efficacy for heart
failure was the exercise tolerance test. An increased duration of exercise tolerance
represents a benefit of therapy. However, this increased duration is also recorded
during placebo therapy and possibly results from the familiarity of the patient with
the test, as in the learning phenomenon described earlier in this article for antiangi-
nal therapy; and, the increased willingness of the physician to encourage the patient
to exercise to exhaustion. Placebo response to repeated exercise tolerance testing
can result in an increase in duration of 90–120 seconds, when only one or two
7 The Placebo and Nocebo Effect 125
baseline measurements are done. This response can be reduced to 10–30 seconds,
when 3–10 baseline measurements are performed. Another interesting finding was
that the magnitude of the placebo response was directly proportional to the number
of investigators in the study! Attempts to eliminate the placebo response, including
the use of gas exchange measurements during exercise tolerance testing, have
failed.
45
Because all methods used to measure the efficacy of a treatment for heart failure
include placebo effects, studies must include controls for placebos to prove the
efficacy of a new drug therapy. Statistical analysis of placebo-controlled studies
must compare results between groups for statistical significance. ‘Between groups’
refers to comparison of the change in one group, such as one receiving a new drug
therapy, with the change in another group, such one receiving as a placebo.
45
In 1992, Archer and Leier
46
reported that placebo therapy for 8 weeks in 15
patients with CHF resulted in a mean improvement in exercise duration of 81 sec-
onds, to 30% above baseline. This result was statistically significant compared with
the 12-second improvement in the nine patients in the nonplacebo control group.
There were no statistically significant differences between the placebo and nonpla-
cebo groups at baseline or at week 8 of treatment by between-group statistical
analysis. Echocardiography showed no significant improvement in either group and
no significant differences between the two groups at baseline or during the treat-
ment period. To prove the existence of and to quantitate the therapeutic power of
placebo treatment in CHF, all studies were performed by the same principal inves-
tigator with identical study methods and conditions, and all patients were familiar-
ized similarly with the treadmill testing procedure before baseline measurements.
Also, the study used a well-matched, nonplacebo control group and this illustrated
the spontaneous variability of CHF.
46
Placebo Effect in Hypertension
Some studies of the placebo response in patients with hypertension have shown a
lowering of blood pressure,
47–52
but others have not.
53–57
In a Medical Research
Council study, when active treatment was compared with placebo therapy (given to
patients with mild hypertension for several months) similar results were produced
in the two groups, an initial decrease in blood pressure followed by stabilization.
47
Of historical note is a study by Goldring et al.
58
published in 1956. These authors
fabricated a sham therapeutic ‘electron gun’ designed to be as ‘dramatic as possi-
ble, but without any known physiologic action other than a psychogenic one.’ Initial
exposure to ‘the gun’ lasted 1–3 minutes and was increased to 5 minutes three times
daily. The investigators noticed substantially decreased blood pressure during ther-
apy compared with pretherapy. In six of nine hospitalized patients there was a
systolic/diastolic blood pressure reduction of 39/28 mmHg.
An important factor to consider is the method used to measure blood pressure.
With the use of standard sphygmomanometry, blood pressure initially decreases. In