Essentials of Neuroimaging for Clinical Practice - part 2 pdf
Bạn đang xem bản rút gọn của tài liệu. Xem và tải ngay bản đầy đủ của tài liệu tại đây (1.14 MB, 17 trang )
xvii
Introduction
Neuroimaging technology has progressed consider-
ably during recent decades. Neuroimaging studies can
be an invaluable part of the diagnostic workup of psy-
chiatric patients. However, it can be difficult to deter-
mine which clinical situations call for the use of neuro-
imaging studies and which do not. In addition, it is
often unclear what type of neuroimaging study should
be ordered. Should contrast be used during the study?
Are there specific acquisition parameters that may be
useful in a particular clinical situation? The goal of this
volume is to describe the currently available neuro-
imaging technologies and to discuss their appropriate
use in the clinical psychiatric setting. The potential fu-
ture clinical utility of these techniques will be ad-
dressed as well.
Structural neuroimaging modalities such as com-
puted tomography (CT) and magnetic resonance imag-
ing (MRI) have revolutionized the practice of medicine
in recent decades. In the first chapter, Park and Gonza-
lez describe the history of CT, how CT works, and
which clinical situations call for the use of CT. The
chapter also provides a number of CT images as exam-
ples of radiological findings associated with specific
diagnoses. Goldstein and Price present similar detail
in their chapter on MRI. This chapter summarizes the
state of the art in MRI technology and offers specific
guidelines for ordering MRI studies.
Functional neuroimaging techniques developed af-
ter the advent of structural neuroimaging and show
great promise for both clinical use and neuroscience
research. Positron emission tomography (PET) and sin-
gle photon emission computed tomography (SPECT)
have demonstrated the greatest clinical utility of all
functional neuroimaging methods to date. The chapter
by Dougherty, Rauch, and Fischman reviews the phys-
ics underlying PET and SPECT and highlights the use-
fulness of these technologies in clinical situations.
Functional magnetic resonance imaging (fMRI) has
limited clinical utility in psychiatry at present, but it is
a powerful tool that shows great potential for future
application. Savoy and Gollub provide an understand-
able and lucid description of fMRI and discuss possible
future clinical uses. Magnetic resonance spectroscopy
(MRS) is another technology that uses unique MRI
acquisition parameters to assess in vivo brain neuro-
chemistry. Bolo and Renshaw delineate the current ca-
pabilities of MRS and consider future potential uses.
Electroencephalography (EEG) has been used for
almost a century to measure cortical electrical activity.
Kuperberg outlines recent developments in the EEG
field, including quantitative EEG and event-related po-
tentials. This chapter also describes a related technol-
ogy, magnetoencephalography.
Finally, Rauch offers a perspective on the future of
neuroimaging in psychiatric practice as well as in re-
search. This chapter clearly characterizes the tremen-
dous potential that these methods hold for advances in
our field.
xviii ESSENTIALS OF NEUROIMAGING FOR CLINICAL PRACTICE
Acknowledgments
We would like to acknowledge our mentors and collab-
orators; in particular, we wish to express our apprecia-
tion to Michael A. Jenike, M.D., Nathaniel M. Alpert,
Ph.D., Alan J. Fischman, M.D., Ph.D., Robert H. Rubin,
M.D., and Ned Cassem, M.D. Finally, we wish to thank
the editorial and production staff of American Psychi-
atric Publishing, Inc., for their expertise, support, and
patience.
1
1
Computed Tomography
Lawrence T. Park, M.D.
Ramon Gilberto Gonzalez, M.D.
Computed tomography (CT), or computerized axial
tomography (CAT), was one of the first noninvasive im-
aging techniques for three-dimensional (3D) visualiza-
tion of neuroanatomic structure. Before CT, the main
modes of imaging cerebral structure, ventriculography
and pneumoencephalography, relied on plain-film
technology and were quite invasive. The advent of CT
revolutionized the field of neuropsychiatry and ush-
ered in a new era of neuroimaging. CT provided a tool
to create reliable and accurate representations of inter-
nal structure using noninvasive techniques and, as a re-
sult, fostered an acceleration in the growth of the neuro-
sciences (as well as other medical fields). Despite the
development of other imaging technologies (such as
magnetic resonance imaging [MRI]), CT continues to
play an important role in the practice of clinical neuro-
psychiatry. CT offers distinct advantages over other im-
aging modalities. CT provides excellent image quality
and rapid acquisition time at relatively low cost. More-
over, CT is widely available, with approximately 75%
of all U.S. hospitals having access to CT. In many clini-
cal situations, CT remains the diagnostic study of first
choice. In this chapter we examine the history and de-
velopment of CT, technical aspects of CT imaging, nor-
mal and abnormal findings in CT imaging, and clinical
indications for neuroimaging in general, and we offer
guidance for selecting between CT and MRI.
History and Development
The first CT images were produced in the late 1960s by
Sir Godfrey Hounsfield of Electro-Musical Instruments
(EMI) Limited. Hounsfield, an engineer with the Brit-
ish music label, elaborated concepts underlying CT im-
aging and created the technology necessary to collect
the needed data for imaging. Following principles of
image reconstruction described by Radon in the early
1900s and tissue attenuation principles initially set
forth by Cormack in the 1950s, Hounsfield proposed
theories that supported the possibility of assessing in-
ternal structure through a series of X-ray transmissions
and measurements around the periphery of a body
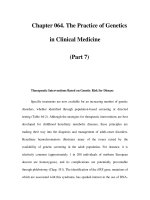
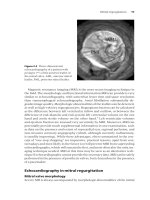
(Figure 1–1). From these principles, Hounsfield con-
structed the first CT scanner and, for his groundbreak-
ing work, received the Nobel Prize in Medicine in 1979
(with Cormack). The first scans acquired 28,800 inde-
2 ESSENTIALS OF NEUROIMAGING FOR CLINICAL PRACTICE
pendent measurements, requiring 9 hours of acquisi-
tion time. The final image consisted of an 80 × 80 matrix
(6,400 voxels), which took 9 days to reconstruct from
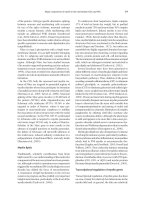
the initial measurements (Figure 1–2). The first com-
mercially available machines were produced in 1973 by
EMI; these were capable of reconstructing an 80 × 80–
voxel image in 10 minutes.
Since that time, CT technology has advanced signif-
icantly, providing higher-resolution images and faster
scanning times. Current high-speed (helical, spiral, or
multidetector) scanners can acquire data for full-body
imaging in less than 3 minutes and provide images
with spatial resolution of less than 1 square millimeter.
In addition, other CT-based technologies have been de-
veloped (Table 1–1). CT angiography and other 3D re-
construction techniques have been developed and of-
fer high-resolution 3D representations of vascular (or
other anatomic) structure. CT myelography remains a
valuable technique for evaluating the spinal cord and
related structures. Single photon emission computed
tomography (SPECT; see Chapter 3 in this volume)
provides functional representations of cerebral physi-
ology and, like other functional imaging techniques
(e.g., positron emission tomography [PET]; see Chap-
ter 3), is based on common imaging principles that
make use of radioactive markers paired with physio-
logical correlates of function to provide functional rep-
resentations of cerebral physiology.
Technical Considerations
CT uses essentially the same basic technology as plain-
film X rays. In plain-film radiography, an X-ray source
transmits gamma rays through a part of the body, and a
detector (e.g., the film) on the other side measures the
amount of radiation not absorbed by the body. As the
X rays pass through the body, different tissues absorb ra-
diation in varying degrees (X-ray absorption is generally
related to electron density of the tissue). For example, in
a plain film of the chest, X rays pass through different
structures of the thorax. When X rays pass through
denser structures such as bone, relatively more radiation
is absorbed (i.e., there is greater attenuation of the initial
X-ray transmission), resulting in less exposure of the film
on the other side of the chest. Less exposure of the film
corresponds to a bright (or white) representation on the
film. When X rays pass through lung tissue (a less dense
Figure 1–1. CT data acquisition techniques: rotating source and detector around a body.
Source. Reprinted from Hounsfield GN: “Computerized Transverse Axial Scanning (Tomography), Part I: Description of System.”
British Journal of Radiology 46:1016–1022, 1973. Copyright 1973, British Institute of Radiology. Used with permission.
Table 1–1. CT–based imaging technologies
High-speed multidetector CT
Three-dimensional reconstruction
CT angiography
CT myelography
Single photon emission CT (SPECT)
Computed Tomography 3
Figure 1–2. Early CT imaging.
A, Horizontal sections of normal human brain. B, Early CT images at the corresponding transverse plane.
Source. Reprinted from Ambrose J: “Computerized Transverse Axial Scanning (Tomography), Part 2: Clinical Application.”
British Journal of Radiology 46:1023–1047, 1973. Copyright 1973, British Institute of Radiology. Used with permission.
4 ESSENTIALS OF NEUROIMAGING FOR CLINICAL PRACTICE
tissue), relatively less radiation is absorbed, leading to
greater exposure of the film and a darker (or black) image.
When X rays pass through heart tissue or muscle (interme-
diate density), there is intermediate absorption, and the
resulting image is an intermediate one (shade of gray).
The plain radiographic film represents equally all
structures through which X rays pass and superim-
poses all images on a two-dimensional surface (the
film itself). In contrast, whereas a tomogram makes use
of the same basic method of X-ray transmission, the re-
sulting image is focused in a specific plane of the body
through which the X rays traversed. Tomograms pro-
vide the sharpest images in that one plane, with super-
imposed blurred images of structures lying on either
side of that plane.
CT scanning consists of a series of tomograms, or
slices, through sections of the body. However, its method
of image acquisition differs from that used in conven-
tional tomography. In CT, instead of transmitting X
rays perpendicularly through the body and then tak-
ing measurements in a focused plane with conven-
tional radiological film, a series of transmissions and
measurements are performed around the periphery of
a body. Rotating around a body, X rays are transmitted
by an X-ray emitter, pass through the body, and are
measured by a detector on the opposite side. Measure-
ment is accomplished with a paired X-ray source and
detector positioned 180 degrees from each other. This
apparatus rotates around one plane of the head, and
X-ray attenuation is measured at multiple points
throughout a 360-degree arc around the body (Figure
1–3, A and B). By means of computer-assisted algo-
rithms, an image of the somatic structure within the
slice is constructed from the multiple measurements
taken around the body. The slice through which the X
rays traverse is separated into a grid, with each box in
the grid (voxel or pixel) representing a small area of
the body. By analyzing the X-ray attenuation of each
of the data points around the body, an attenuation
value for each voxel within the body may be calcu-
lated. Each voxel is assigned an attenuation value
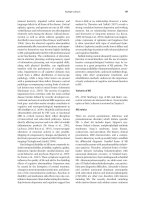
from +500 to –500 (called Hounsfield units). By conven-
tion, water is assigned a value of zero (Figure 1–4). The
representation of the attenuation for all the voxels of
the grid produces a structural image within that plane.
The use of intravenous radio-opaque contrast sig-
nificantly improves the ability of CT to visualize cer-
tain normal and abnormal structures. Contrast high-
lights vascular structures as well as lesions that lead
to compromise of the blood–brain barrier. As a result,
vascular abnormalities such as aneurysms, dissections,
and arteriovenous malformations will be more easily
visualized (although angiography remains the study of
choice when these lesions are suspected). Contrast will
also highlight lesions that lead to gross disruption of
the blood–brain barrier. Such lesions include inflam-
matory processes of the brain (e.g., infection) and tu-
mors (Table 1–2).
Figure 1–3. CT image acquisition.
A, Motion of frame and detectors for producing two continuous slices. B, Illustration of scanning sequence.
Source. Reprinted from Hounsfield GN: “Computerized Transverse Axial Scanning (Tomography), Part 1: Description of System.”
British Journal of Radiology 46:1016–1022, 1973. Copyright 1973, British Institute of Radiology. Used with permission.
Computed Tomography 5
Two types of contrast material are currently in use:
ionic and non-ionic. Ionic contrast is manufactured from
iodinated compounds and is high in osmolarity. Ionic
contrast is more commonly used and comparatively less
expensive than non-ionic contrast and is generally indi-
cated unless there is a history of adverse reaction. Non-
ionic contrast, which is less allergenic, is manufactured
from low-osmolarity compounds such as iohexol or io-
pamidol and is significantly more expensive.
Adverse reactions to ionic contrast include chemo-
toxic reactions and idiosyncratic reactions. Chemotoxic
reactions may affect the brain or kidneys. Chemotoxic
reactions of the brain manifest as an increased risk of
seizures. The baseline risk of seizures with ionic con-
trast administration is 1 in 10,000 if the blood–brain
barrier is intact and slightly higher if the blood–brain
barrier is compromised. Chemotoxic reactions may
also affect the kidneys and may lead to renal dysfunc-
tion (from azotemia to renal failure). There is a 1% risk
Density Tissue Hounsfield units Visual representation
High Mineral/bone +1 to +500 White
Medium Water/fluid 0 Gray
Low Air/lung –1 to –500 Black
Figure 1–4. Attenuation values of various tissue types: Hounsfield units.
Illustration of machine sensitivity. The scale on the right is an arbitrary scale used on the printout and is related
to water=0, air=–500 units. It can be seen that most materials to be detected fall within 20 units above zero and
can be covered by the adjustable 4% “window.”
Source. Reprinted from Hounsfield GN: “Computerized Transverse Axial Scanning (Tomography): Part 1. Description of System.”
British Journal of Radiology 46:1016–1022, 1973. Copyright 1973, British Institute of Radiology. Used with permission.
{
{
{
Bone
calcification
Congealed
blood
Gray matter
White matter
Blood
Water
Fat
Printout scale
+500
+400
+300
+200
+100+100
0
−100
−200
−300
−400
−500
0
−50
6
12
18
20
30
500
+100%
Fat BoneTissueWater
Variations of
tissue within
this percentage
{
4%
WHITE
BLACK
Tone range
on picture
Machine
accuracy
½%
Air 500−
%
120
110
100
90
80
70
6060
50
40
30
20
10
−10
0
−20
−30
−40
−50
−60
−70
−80
−90
−100
Air
% Absorption coefficient greater than water
10%
Table 1–2. Indications for use of intravenous contrast
with specific lesions
Intravenous contrast study indicated
Aneurysms
Dissections
Inflammatory processes of meninges
Infection/abscess
Tumors
Noncontrast study indicated
Acute or unstable situations
Hemorrhage
Hydrocephalus
Cerebral edema
Fractures
Pneumocephalus
Calcifications
Metal/foreign body
6 ESSENTIALS OF NEUROIMAGING FOR CLINICAL PRACTICE
of decreased renal function with ionic contrast adminis-
tration in patients with normal serum creatinine levels
(<1.5 mg/dL). However, the risk increases to approxi-
mately one-third for those with a serum creatinine level
greater than 4.5 mg/dL. The risk of renal dysfunction
is also higher for individuals with a history of diabetes
mellitus. Idiosyncratic reactions may also occur in up
to 5% of patients receiving ionic contrast. Symptoms
include hypotension, nausea, flushing, rash, urticaria,
and anaphylaxis. Risk factors for idiosyncratic reac-
tions include age less than 1 year, age greater than 60
years, history of asthma, significant history of allergies,
and past adverse reaction to ionic contrast (Table 1–3).
As a rule of thumb, a known history of ionic contrast
reaction, a creatinine level greater than 2.0 mg/dL, or
the presence of active renal failure serve as contraindi-
cations to administration of ionic contrast. In these
cases, non-ionic contrast should be considered the me-
dium of choice.
Normal and Abnormal
Findings
A typical CT scan of the head consists of a scout view
(similar to a plain film X ray in coronal and/or sagittal
section) and a series of transverse tomograms (Figure
1–5). One can vary the width of the slice, as well as the
distance between slices. In addition, by varying the
acquisition parameters, different visualization tech-
niques can allow for more sensitive assessment of cer-
tain types of tissue. For example, brain windows provide
Table 1–3. Risk factors for adverse reaction to ionic
contrast
Previous adverse reaction to ionic contrast
Creatinine level >2.0 mg/dL
History of diabetes mellitus
Age <1 year
Age >60 years
History of asthma
History of allergies
Figure 1–5. Typical CT scan, including scout film (A) and series of axial tomograms (B).
Computed Tomography 7
optimal visualization of brain tissue, whereas bone win-
dows provide optimal visualization of bony structures.
CT bone windows are the best imaging technique for
assessing the integrity of the cortical bone structure; CT
brain windows provide optimal viewing of brain pa-
renchyma and vascular structure.
CT generally provides excellent visualization of
normal structures of the brain. Figure 1–6 demonstrates
a transverse view of a normal brain at the level of the
frontal horns of the lateral ventricle. In the CT image,
there is excellent visualization of the cortical bone struc-
ture as well as the ventricular system. Bone in these im-
ages is seen as bright (white). The cerebrospinal fluid
(CSF)–filled ventricular system is dark (black). The
brain parenchyma is well visualized, although there is
limited differentiation between gray and white matter.
Gray matter is seen as lighter gray, whereas white mat-
ter, being less dense, appears slightly darker. In Figure
1–7, brain and bone windows are represented. Taken
from the level of the base of the skull, these images
demonstrate the optic structures, sinuses, mastoid air
cells, and other otic structures. The bone windows high-
light these structures. The brain windows provide bet-
ter visualization of the parenchymal structures. At this
level, one can observe the limited visualization of the
cerebellum and brain stem due to streaks (artifact) pro-
duced by the thick surrounding bone.
Pathology that is best visualized by CT includes
acute hemorrhage (particularly subarachnoid hemor-
rhage), calcified lesions, and certain types of bony le-
sions. Bony lesions well visualized by CT include frac-
tures (Figure 1–8) and lytic (or blastic) lesions. Single
lytic lesions may represent a single meningioma, he-
mangioma, or metastasis. Multiple lytic lesions may
represent Paget’s disease, multiple myeloma, or mul-
tiple metastases.
Subdural hematoma typically appears as a crescen-
tic lesion between the skull and brain (Figure 1–9). De-
pending on the temporal aspects of the lesions, sub-
dural hematoma lesions may appear differently. In the
acute setting (less than 1 week), hematomas character-
istically appear as high-density (bright) lesions. As the
hematoma evolves over time, the lesion becomes pro-
gressively less dense. In the subacute setting (1 week to
several weeks), the lesion appears as isodense (gray).
In the chronic setting (over a period of months), the le-
sion may appear as hypodense (dark) or may be reab-
sorbed, leaving a cavity in the space once occupied by
the hematoma. The temporal evolution of the appear-
ance of blood on CT is presented in Table 1–4.
Epidural hematoma is typically seen as a rapidly
developing, high-density (bright) biconvex lesion be-
tween the skull and brain, which often displaces cor-
tical matter (Figure 1–10). The majority of epidural hema-
tomas occur as a result of traumatic dissection of a
branch of the middle meningeal artery, and associated
findings may include temporal bone fracture. Sub-
arachnoid hemorrhage appears as a thin line of high-
density (bright) signal that outlines the area between
the surface of the brain and regions of CSF (e.g., sulci,
fissures, basal cistern) (Figure 1–11). CT (with contrast)
is quite sensitive for acute subarachnoid hemorrhage
and remains an important tool for its initial detection.
In contrast to subdural hematoma, subarachnoid hem-
orrhage may evolve relatively quickly over time and
may not be visible by CT several days after the initial
hemorrhage.
Contusions are often seen as hypodense (dark) le-
sions within the brain parenchyma. They are fre-
quently located in frontal or temporal lobes and are
typically caused by traumatic injury in that area (Fig-
ure 1–12). Contracoup contusions may be seen as hypo-
dense lesions located on the opposite side of traumatic
Figure 1–6. CT scan showing transverse view of
normal brain at the level of the basal ganglia.
Arrows demonstrate the frontal and posterior horns
of the lateral ventricle.
8 ESSENTIALS OF NEUROIMAGING FOR CLINICAL PRACTICE
Figure 1–7. CT scan of a normal brain: brain and bone windows at the level of the mastoid air cells.
Figure 1–8. CT scan: bone windows demonstrat-
ing a facial fracture.
Figure 1–9. Subdural hematoma, subacute phase.
Hematoma indicated by white arrows; mass effect
indicated by black arrow.
Computed Tomography 9
injury (e.g., occipital lesion in association with frontal/
temporal injury).
CT is also useful for the evaluation of stroke. In fact,
because of its widespread availability and speed, CT is
the initial diagnostic study of choice in many stroke
protocols. In the acute setting, if thrombolytic therapy
is being considered for an embolic event, CT is nearly
as sensitive as MRI in assessing hemorrhagic stroke.
Hemorrhagic stroke is seen as hyperdense (bright) ar-
eas representing blood and neighboring hypodense
(dark) areas representing parenchymal edema (Figure
1–13). Embolic stroke can be assessed with CT, al-
though diffusion-weighted MRI studies (see Chapter 2
in this volume for a more detailed description of diffu-
sion-weighted MRI) are the preferred imaging modal-
ity if ischemia or infarct is suspected. When CT is used
in the acute setting (less than 48 hours after the event), is-
chemia or infarct appears as a hypodense (dark) intra-
parenchymal lesion (Figure 1–14). Mass effect or sulcal
effacement around the area of the lesions may be an
associated finding. As these lesions evolve over time,
they may appear isodense at approximately 1 week
and then return to a hypodense (dark) appearance at
approximately 3 weeks. Intravenous contrast is useful
in enhancing hemorrhage or ischemia after 1–2 days.
The temporal evolution of the CT appearance of is-
chemic strokes is presented in Table 1–5.
CT can also be useful for the detection of brain tu-
mors. Although MRI is the preferred study for central
nervous system (CNS) tumors, CT with contrast can
detect larger lesions (Figure 1–15). CT with contrast is
fairly sensitive for primary CNS lesions such as astro-
cytomas or meningiomas. On the other hand, smaller
Table 1–4. Temporal evolution of blood on CT
Setting Time Density Appearance Other
Acute Less than 1 week Hyperdense Bright
Subacute Up to several weeks Isodense Gray
Chronic More than several
weeks
Hypodense Dark Blood may reabsorb
Figure 1–10. Epidural hematoma, acute, with
contrast.
Figure 1–11. Subarachnoid hemorrhage, acute.
Thin bright line highlighted with arrows represents
bleeding.
10 ESSENTIALS OF NEUROIMAGING FOR CLINICAL PRACTICE
lesions (e.g., metastatic disease) and posterior fossa tu-
mors are more easily missed on CT. In general, solitary
lesions suggest a primary CNS lesion, whereas mul-
tiple lesions suggest metastatic disease (Figure 1–16).
On CT, tumors are often seen as a hypodense (dark) or
isodense (gray) lesion that disturbs the normal ana-
tomic structure of the brain. This disturbance, called
mass effect, may be represented as displacement of ana-
tomic structures, sulcal effacement, or midline shift.
For tumors, use of contrast is helpful, because lesions
will then be visible as a hyperdense (bright) area or
with ring-enhancing brightness. In addition, edema is
often seen as a hypodense (dark) area around the site
of the tumor.
Certain types of acute infection may also produce
characteristic findings on CT. By using CT with con-
trast, abscesses (typically from bacterial infection) may
be seen as a ring-enhancing cavity within brain paren-
chyma (Figure 1–17). Toxoplasmosis may present as
single or multiple ring-enhancing lesions (Figure 1–
18). Viral infections may also be associated with certain
presentations; for example, ventricular enlargement
and cortical atrophy may be seen with human immu-
nodeficiency virus (HIV) encephalopathy. Temporal
lobe findings, such as edema or atrophy, may be asso-
Figure 1–12. Contusion.
Figure 1–13. Hemorrhagic stroke of the putamen.
Bright lesion (indicated by arrow) represents acute
bleeding; surrounding dark area represents parenchy-
mal edema. Note mass effect of lesion on frontal horn
and blood in posterior horn of the lateral ventricle.
Figure 1–14. Acute embolic stroke.
Hypodense lesion is indicated by arrow.
Computed Tomography 11
ciated with herpes simplex encephalitis (Figure 1–19).
In hydrocephalus, the production, flow, or absorp-
tion of CSF within the ventricular system is abnormal.
As a result, the third ventricle and lateral ventricles
often become significantly enlarged (Figure 1–20). In
obstructive hydrocephalus, lateral ventricles become
enlarged and may be accompanied by effacement of
the sulci. Often, the space of the third or fourth ventri-
cle may be obliterated (a compressing lesion may be
seen) (Figure 1–21). Obliteration of the fourth ventricle
constitutes a neurological emergency. In communicat-
ing hydrocephalus, all ventricular spaces will be en-
larged (including the third and fourth ventricles). Ef-
facement of the cortical sulci may be seen as well.
Normal-pressure hydrocephalus, which presents clini-
cally with the classic triad of dementia, incontinence,
and gait apraxia, typically resembles other types of
communicating hydrocephalus. On CT, one sees dila-
tation of the lateral ventricles and normal or com-
pressed sulci. Hydrocephalus ex vacuo does not arise
from a problem of CSF production, flow, or absorption;
rather, it arises from volume loss. While resembling the
structure of other types of hydrocephalus on imaging,
hydrocephalus ex vacuo is characterized by enlarged
ventricles and widened sulci resulting from atrophy of
brain tissue (Figure 1–22).
In severe cases of cerebral pathology, herniation of
brain tissue may occur. Generally, herniation occurs
when a portion of brain parenchyma becomes dis-
placed across the tentorium cerebelli or falx cerebri.
Table 1–5. Temporal evolution of ischemia on CT
Setting Time Density Appearance Other
Acute Up to several days Hypodense Dark May be associated with mass effect, sulcal widening;
may see decreased gray–white matter differentiation
Subacute Up to several weeks Isodense Gray Short period of hypodensity, with or without ring
enhancement with contrast
Chronic More than several weeks Hypodense Dark May see volume loss with sulcal or ventricular
widening
Figure 1–15. Posterior fossa tumor.
Figure 1–16. Metastatic lesions as seen on CT
with contrast.
12 ESSENTIALS OF NEUROIMAGING FOR CLINICAL PRACTICE
Subfalcine herniation occurs when the cingulate gyrus
is displaced across the midline under the falx cerebri
(Figure 1–23). Transtentorial herniation occurs when
the diencephalon is displaced inferiorly across the ten-
torium cerebelli or the brain stem is displaced superi-
orly across the tentorium cerebelli. One type of trans-
tentorial herniation is uncal herniation, which occurs
when the uncus (the inferior aspect of the temporal
lobe) is displaced across the tentorium cerebelli (Figure
1–24). Table 1–6 lists typical CT findings for common
intracranial pathologies; it also indicates which study
is preferred in the case of each type of suspected lesion
and whether the use of contrast is recommended.
Figure 1–17. Pyogenic abscess as seen on CT with contrast, T1-weighted magnetic resonance imaging (MRI)
with gadolinium contrast, and T2-weighted MRI.
Figure 1–18. Toxoplasmosis as seen on CT with
contrast.
Figure 1–19. Temporal lobe atrophy consistent
with herpes simplex encephalitis.
Computed Tomography 13
Computed Tomography–Based
Research of Neuropsychiatric
Disorders
After the introduction of CT, its great potential as a re-
search tool quickly became apparent. In the 1970s, a
significant amount of research using CT was aimed at
uncovering the underlying structural biology of neuro-
psychiatric disorders. Initial CT studies of general psy-
chiatric populations yielded little, with the majority
(more than 80%) of psychiatric patients having normal
CT findings. A small percentage of patients (less than
10%) demonstrated nonspecific structural abnormali-
ties such as cerebral and cerebellar atrophy, ventricular
enlargement, basal ganglia infarction, and subdural
hematoma (Evans 1982; Beresford et al. 1986).
Specific psychiatric disorders were also studied
with the use of CT. With the exception of studies of
schizophrenia, CT studies revealed little about the
structural neurobiology of psychiatric disorders. In
the study of schizophrenia, however, CT played an im-
portant initial role in implicating an underlying bio-
logical substrate for the disorder. Multiple studies of
schizophrenia patients demonstrated fairly consistent
structural changes, with lateral ventricle enlargement
(Johnstone et al. 1976; Weinberger et al. 1979) and ce-
rebral atrophy (Nasrallah et al. 1982) being the most
reproducible findings.
Although CT-based research has never fully real-
ized the goal of elaborating the connection between
physical and mental states, it served as the foundation
for a paradigm of research examining mind–body cor-
relates through neuroimaging. Newer techniques such
as MRI and functional imaging (i.e., fMRI, SPECT, PET)
have taken over where CT left off and have revealed
much about the biological underpinnings of neuropsy-
Figure 1–20. Enlarged lateral ventricles seen in
hydrocephalus.
Figure 1–21. Obstructive hydrocephalus (ascend-
ing planes top to bottom [A–C]).
Note fourth ventricle evident at lower levels (A); oblit-
eration of fourth ventricle around foramen of Monro
(B) by mass lesion; and resulting hydrocephalus (C).
14 ESSENTIALS OF NEUROIMAGING FOR CLINICAL PRACTICE
chiatric disease (see other chapters in this volume for
further elaboration of these additional research tech-
niques). Although CT is not the most sensitive imaging
modality for identifying such underlying changes, cer-
tain psychiatric and neuropsychiatric presentations
may be associated with lesions detectable on CT. Table
1–7 catalogs findings that may be visible on CT.
Clinical Indications for
Neuroimaging
Neuroimaging is indicated in a variety of clinical set-
tings, ranging from emergencies to nonacute screen-
ing situations. In the emergency setting, CT is the pre-
ferred study for evaluating abrupt change in mental
status or head injury or for ruling out acute intracra-
nial hemorrhage. In any acute clinical situation or if
medical stability is tenuous, CT should be the initial
imaging study used, because it takes much less time to
Figure 1–22. Hydrocephalus ex vacuo.
White arrows indicate enlarged ventricles; black ar-
rows indicate widened sulci.
Figure 1–23. Subfalcine herniation. Right-to-left
shift under falx cerebri is due to hemorrhagic process.
Figure 1–24. Uncal herniation.
Arrows indicate area of downward displacement of
right temporal lobe across tentorium cerebelli.
Computed Tomography 15
obtain and is most sensitive for suspected pathologies,
such as acute intracranial hemorrhage. A recent his-
tory of head trauma accompanied by loss of con-
sciousness or a Glasgow Coma Scale (GCS) score of
less than 15 warrants a CT scan. Any patient with a re-
cent change in mental status in the presence of head
trauma, age greater than 50 years, or focal neurologi-
cal symptoms warrants a CT scan. In cases of cranial
trauma in which fracture is suspected, time should not
be spent obtaining plain-film X rays of the skull, given
that CT studies (scout film and bone windows) are su-
perior for identifying any bony lesion. MRI should not
be the first study obtained, given the amount of time
needed for these scans and the potential medical insta-
bility of the patient. MRI may be ordered as follow-up
after CT results have been obtained and medical sta-
bility is assured. In addition, serial scanning is indi-
cated if it is suspected that the pathological process is
evolving (progressing) over time. For example, sub-
dural hematoma, cerebral contusion, stroke, or edema
may develop over a period of hours to days. The use
of serial CT (or of CT with MRI follow-up) over time
is indicated if suspicion for these types of lesions is
high or if the alteration in mental status does not im-
prove (or worsens). Subsequent CT scans may be ob-
tained at the time of acute clinical deterioration or at
regular intervals (e.g., every 24–48 hours) after presen-
tation.
CT imaging is an important diagnostic tool in the
acute assessment of stroke. Although some stroke pro-
tocols employ MRI as the initial study, many protocols
rely on CT as the initial study. The general rule in
stroke management is to image early and often. Early
use of CT can determine if the underlying disease pro-
cess is hemorrhagic or embolic in nature. In addition,
CT angiography (or CT myelography) may be used to
assess the patency of larger vessels. Distinguishing be-
tween hemorrhagic and embolic stroke is critical, be-
cause the underlying process determines the acute
management of the disease. If CT does not demon-
Table 1–6. CT findings for common pathological processes
Lesion CT findings
Preferred
study Contrast
Subdural hematoma Crescentic lesion between skull and brain (density varies with
age of lesion)
CT –
Epidural hematoma Biconvex lesion between skull and brain (hyperdense) CT –
Subarachnoid hemorrhage Thin lesion outlining surface of brain and CSF regions
(hyperdense)
CT –
Hemorrhagic stroke Intraparenchymal edema (hypodense) and acute blood
(hyperdense)
CT or MRI –
a
+
b
Embolic stroke Hypodense intraparenchymal lesion (acute setting) MRI +
Tumor Variable-density (hypo- or isodense) lesion disrupting normal
anatomy; with contrast, ring-enhancing lesion
MRI +
Contusion Hypodense intraparenchymal lesion (acute setting) MRI +
Infection—bacterial abscess Intraparenchymal cavitary lesion; with contrast, ring-
enhancing lesion
CT or MRI +
Toxoplasmosis Multiple ring-enhancing lesions (with contrast) CT or MRI +
Infection—HIV with chronic
CNS involvement
Ventricular enlargement, cortical atrophy, white matter
hypodensities
MRI +
Infection—herpes simplex virus Temporal lobe edema, atrophy, uncal herniation MRI +
Hydrocephalus—obstructive Lateral ventricles enlarged; third or fourth ventricles may be
obliterated; effacement of sulci
CT –
Hydrocephalus—communicating All ventricular spaces enlarged; effacement of sulci CT –
Normal-pressure hydrocephalus Dilatation of lateral ventricles; normal or effaced sulci CT –
Hydrocephalus ex vacuo All ventricular spaces enlarged; widened sulci; volume loss CT –
Herniation—subfalcine Cingulate gyrus displaced across the midline under falx cerebri CT –
Herniation—transtentorial Diencephalon displaced inferiorly across tentorium cerebelli CT –
Herniation—uncal Uncus displaced across tentorium cerebelli CT –
Note. +=with contrast; –=without contrast. CNS=central nervous system; CSF=cerebrospinal fluid; CT=computed tomography;
HIV=human immunodeficiency virus; MRI=magnetic resonance imaging.
a
acute;
b
subacute (>1–2 days).