Essentials of Neuroimaging for Clinical Practice - part 5 pps
Bạn đang xem bản rút gọn của tài liệu. Xem và tải ngay bản đầy đủ của tài liệu tại đây (1.25 MB, 17 trang )
50 ESSENTIALS OF NEUROIMAGING FOR CLINICAL PRACTICE
Table 2–6. Examples of MRI-detectable brain pathology that can manifest clinically as psychiatric disturbance
Pathological class Syndrome MRI modality Example finding
Ventricular system/CSF
volume abnormalities
Hydrocephalus
Ex vacuo (e.g., atrophy)
Communicating (e.g., NPH)
Obstructive
Axial T1, T2; sagittal T1 Variable ventricular dilatation
Cerebrovascular Hemorrhagic
Epidural GE Expanding subcranial hypointensity
Subdural GE, T2, FLAIR Convexity abnormality
Subarachnoid GE Subarachnoid hypointensities
Intraparenchymal GE Variable hypointensities
Ischemic
Small-vessel lacunar Acute: DWI, FLAIR Focal punctate subcortical
hyperintensity
Chronic: FLAIR Scattered small subcortical
hyperintensities
Large-vessel thromboembolic Acute: DWI, FLAIR Large focal cortical hyperintensity
Chronic: FLAIR Large focal cortical hyperintensity
Old: T1 Focal encephalomalacia, atrophy
Aneurysm MRA Vascular abnormality
Arteriovenous malformation MRA Vascular abnormality
Dural venous thrombosis MRV Flow deficit
Metabolic Wilson’s disease Coronal T1, FLAIR Cystic putamenal lesions
Mitochondrial encephalopathy
lactic acidosis and stroke
(MELAS)
FLAIR Variable infarcts
Inflammatory White matter (e.g., multiple
sclerosis)
Sagittal FLAIR Dawson’s fingers (in multiple
sclerosis)
Vasculature (e.g., vasculitis) FLAIR, MRA Focal punctate lesions
Idiopathic (e.g., sarcoidosis) T1, T1 + gad Variable enhancement
Neoplastic Tumor
Primary
Metastatic
T1, T1 + gad, FLAIR
T1, T1 + gad, FLAIR
Variably enhancing mass lesions
Variably enhancing mass lesions
Leptomeningeal disease T1, T1 + gad, FLAIR Leptomeningeal enhancement
Infectious Encephalitis T1, T1 + gad, FLAIR Variable enhancement, edema
Meningitis T1, T1 + gad Edema, enhancement
Abscess T1, T1 + gad Ring-enhancing mass
Toxic Alcohol Axial T1 Cerebellar vermis atrophy
Heavy metal Coronal T1, T2, FLAIR Basal ganglia abnormalities
Trauma Acute T1, DWI, GE, FLAIR Acute hemorrhage, edema
Chronic T1, GE, FLAIR Petechial hemosiderin deposits,
encephalomalacia
Neurodegenerative Alzheimer’s disease Coronal T1 Hippocampal atrophy ± temporal/
parietal/generalized atrophy
Dementia with Lewy bodies Axial, coronal T1 Similar to Alzheimer’s disease
Frontotemporal dementia Sagittal T1 Frontal and/or temporal gyral knife-
edge atrophy
Huntington’s disease Coronal T1 Bilateral caudate atrophy
Note. CSF = cerebrospinal fluid; DWI = diffusion-weighted imaging; FLAIR = fluid-attenuated inversion recovery; gad = gadolin-
ium contrast; GE = gradient echo; MRA = magnetic resonance angiography; MRV = magnetic resonance venography; NPH = normal-
pressure hydrocephalus.
Magnetic Resonance Imaging 51
atric patient populations (e.g., poorly controlled bipolar
disorder) (Soares and Mann 1997). The ultimate clinical
significance of such findings is the subject of ongoing in-
vestigation and debate (Campbell and Coffey 2001).
There remain no pathognomonic structural MRI
findings for primary psychiatric diseases (indeed, the
search for such data has been a major driving force in the
development of functional MRI in psychiatric neuro-
science). However, a brief review of the literature in re-
gard to the more common—albeit inconsistent—trends
found in the structural imaging of psychiatric disease
can help inform clinical efforts.
Schizophrenia
Interest in the neurobiology of schizophrenia was re-
kindled in the late 1970s, in large part due to CT studies
of schizophrenia that provided initially compelling
evidence that a substantial fraction of patients with
schizophrenia had reduced cerebral volume, as re-
vealed by enlarged ventricles and cortical sulci (con-
firming earlier pneumoencephalographic data) (John-
stone et al. 1976). These findings led to a proliferation
of CT and subsequent MRI studies of schizophrenia
(Shenton et al. 2001).
Beginning with one of the first MRI study of schizo-
phrenia by Smith et al. in 1984, investigators have col-
lected an impressive inventory of brain abnormalities
in schizophrenia. Shenton et al. (2001) performed a
comprehensive review and synthesis of structural MRI
findings in schizophrenia, surveying almost 200 peer-
reviewed MRI studies reported between 1988 and Au-
gust 2000. Many of the schizophrenia-related brain ab-
normalities discovered by MRI converge with earlier
postmortem findings.
In the Shenton et al. (2001) review, more frequent
MRI findings in schizophrenia included ventricular en-
largement (80% of studies reviewed), cavum septum
pellucidum (92% of studies reviewed), third-ventricle
enlargement (73% of studies reviewed), and medial
temporal abnormalities (74% of studies reviewed), in-
cluding the amygdala, hippocampus, parahippocam-
pal gyrus, and neocortical temporal regions (e.g., su-
perior temporal gyrus in 100% of studies reviewed).
Principal findings of Shenton and colleagues’ review
are summarized in Table 2–8.
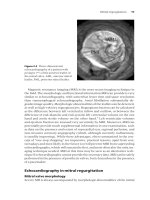
A sample finding is illustrated in Figure 2–33. Note
the enlarged lateral ventricles, increased CSF (black) in
the left Sylvian fissure (right side of scan), increased CSF
in the left temporal horn surrounding the left amyg-
dala (white arrow), and tissue reduction in the left supe-
rior temporal gyrus in the patient with schizophrenia,
compared with the healthy control subject (Shenton et
al. 1992).
The timing of such abnormalities has not yet been
determined. Many are evident in patients early in the
disease course, suggesting that these structural changes
do not entirely derive from disease progression (Shen-
ton et al. 2001). Notwithstanding, there is evidence indi-
Table 2–7. MRI results in 6,200 psychiatric
inpatients: unexpected and potentially treatable findings
MRI finding N Percentage
Multiple sclerosis
a
26 0.4
Hemorrhage 26 0.4
Temporal lobe cyst 22 0.4
Tumor 15 0.2
Vascular malformation 6 0.1
Hydrocephalus 4 0.1
Totals 99 1.6
a
White matter abnormalities inferred as multiple sclerosis.
Source. Adapted from Rauch and Renshaw 1995.
Table 2–8. Summary of structural MRI study findings
in schizophrenia (1988–2000)
Brain region
No.
of
studies
Percentage
with
positive
findings
Percentage
with
negative
findings
Whole brain 50 22 78
Lateral ventricles 55 80 20
Third ventricles 33 73 27
Fourth ventricle 5 20 80
Whole temporal lobe 51 61 39
Medial temporal lobe 49 74 26
Superior temporal gyrus,
gray matter
12 100 0
Superior temporal gyrus,
gray matter, and white
matter
15 67 33
Planum temporale 10 60 40
Frontal lobe 50 60 40
Parietal lobe 15 60 40
Occipital lobe 9 44 56
Cerebellum 13 31 69
Basal ganglia 25 68 32
Thalamus 12 42 58
Corpus callosum 27 63 37
Cavum septum
pellucidum
12 92 8
Source. Adapted from Shenton et al. 2001.
52 ESSENTIALS OF NEUROIMAGING FOR CLINICAL PRACTICE
cating that at least a subset of pathological features are
progressive (Shenton et al. 2001).
Iatrogenic influences can complicate interpretation
of MRI findings. For example, enlargement of the cau-
date volume has been reported early in the course of
illness, but multiple studies suggest that this enlarge-
ment may be secondary to treatment with dopamine
receptor antagonists (i.e., neuroleptics). Data support-
ing neuropathological changes over time in schizo-
phrenia are summarized in Table 2–9.
Affective Disorders
Although there are no pathognomonic structural MRI
findings as yet associated with affective disorders, a
complex and inconsistent variety of structural MRI–
discernible changes have been reported.
Data suggesting smaller volumes of the frontal lobes,
amygdala, caudate, putamen, hippocampus, and cerebel-
lum have been reported in some populations of patients
with unipolar recurrent major depression (Renshaw
and Parow 2002). On the basis of these observations,
neuroanatomic models of mood regulation involving
specific frontosubcortical circuits have been proposed
for research using functional imaging techniques.
In patients with bipolar disorder, the most com-
monly reported findings have been increased white
matter hyperintensities (Stoll et al. 2000) and enlarged
ventricles (especially third), although it should be
noted that the latter finding is controversial (Stoll et al.
2000). Select regional volume changes (e.g., prefrontal,
temporal, cerebellar) have been less frequently re-
ported (Drevets et al. 1997; Renshaw and Parow 2002;
Soares and Mann 1997).
Obsessive-Compulsive Disorder
Because of theoretical models implicating caudate
involvement and an early report of right caudate en-
largement in patients with obsessive-compulsive disor-
der (OCD) (Scarone et al. 1992), several MRI studies of
OCD have focused on the basal ganglia and frontostri-
atal circuits (Saxena et al. 1998). Evidence suggesting an
association between striatal structural pathology and
OCD includes an early report by Weilburg et al. (1989)
of a patient with OCD whose MRI demonstrated left
caudate atrophy and a left putamen cavitary lesion.
Support for structural MRI reports associating cau-
date pathology with OCD has come from multiple
functional neuroimaging investigations of OCD. Nev-
ertheless, structural MRI fails to reveal specific pathol-
ogy in the majority of OCD patients.
Figure 2–33. Healthy control subject (A) and patient with schizophrenia (B) approximately anatomically co-
registered, as seen on coronal T1-weighted MRI.
Source. Reprinted from Shenton ME, Kikinis R, Jolesz FA, et al.: “Abnormalities of the Left Temporal Lobe and Thought Disorder
in Schizophrenia. A Quantitative Magnetic Resonance Imaging Study.” New England Journal of Medicine 327:604-612, 1992. Copy-
right 1992, The Massachusetts Medical Society. Used with permission.
Magnetic Resonance Imaging 53
Table 2–9. MRI studies of progressive volume changes in schizophrenia
Patient sample Study N Region of interest
Follow-up
period Findings
First-episode
schizophrenia
Chakos et al. 1994 21 Caudate 18 months Increased caudate volume with typical antipsychotics;
volume correlated with dose, inversely correlated
with age at onset
Schizophrenia Chakos et al. 1995 15 Caudate 12 months Reduced caudate volume with atypical antipsychotics
Chronic schizophrenia Corson et al. 1999 19 Caudate, lenticular nucleus 2 years Typical antipsychotics increased size of caudate,
lenticular nucleus; atypical antipsychotics decreased
size
First-episode
schizophrenia
Degreef et al. 1991 13 Cortical volume, ventricular volume 1–2 years No difference in rate of change
First-episode
schizophrenia
DeLisi et al. 1992 50 Temporal lobes, ventricular volume 2 years No difference in temporal lobe or ventricular volume
First-episode
schizophrenia
DeLisi et al. 1995 20 Cerebral hemispheres, medial temporal lobe,
temporal lobe, lateral ventricles, caudate
nucleus, corpus callosum
4 years Rate of change greater in patients for left lateral
ventricle
First-episode
schizophrenia
DeLisi et al. 1997 50 Cerebral hemispheres, medial temporal lobe,
temporal lobe, lateral ventricles, cerebellum,
caudate, corpus callosum, Sylvian fissure
≥4 years Rate of change greater in patients for left and right
hemispheres, right cerebellum, corpus callosum, and
ventricles
First-episode
schizophrenia
DeLisi et al. 1998 50 Cerebral hemisphere ventricles 5 years Larger ventricles at baseline correlated with poorer
premorbid functioning; larger ventricles at baseline
also showed less of an increase in size at follow-up,
compared with smaller ventricles at baseline
First-episode
schizophrenia
Gur et al. 1998 20 Whole-brain CSF, frontal lobes, temporal
lobes
2–3 years Rate of change of frontal lobe volume increased;
reduction in temporal lobe volume
Chronic schizophrenia Gur et al. 1998 20 Whole-brain CSF, frontal lobes, temporal
lobes
2–3 years Rate of change of frontal lobe volume increased;
reduction in temporal lobe volume
Childhood-onset
schizophrenia
Jacobsen et al. 1998 10 Cerebral volume; superior, anterior temporal
lobe; amygdala; hippocampus
2 years Rate of change of total cerebral volume and temporal
lobe structures increased in schizophrenia
First-episode psychosis Keshavan et al. 1998 17 Cerebral volume, superior temporal gyrus,
cerebellum
1 year Volume of superior temporal gyrus inversely correlated
with prodrome and psychosis duration; rate of change
of superior temporal gyrus volume greater in patients;
superior temporal gyrus volume enlarged with
treatment in some patients (i.e., reversal of volume
reduction after 1 year)
54 ESSENTIALS OF NEUROIMAGING FOR CLINICAL PRACTICE
First-episode
schizophrenia or
schizoaffective disorder
Lieberman et al.
1996
62 Qualitative measure of lateral ventricles,
third ventricle, frontal/parietal cortex,
medial temporal lobe
18 months Patients who had poor response to treatment showed
more ventricular enlargement and reduced cortical
volumes in comparison with patients who had better
response to treatment
Childhood-onset
schizophrenia
Rapoport et al. 1997 16 Ventricular volume; thalamic area; caudate
nucleus; putamen; globus pallidus
2 years Rate of change of ventricular volume and thalamic area
increased in schizophrenia
Childhood-onset
schizophrenia
Rapoport et al. 1999 15 Gray and white matter volume (frontal,
temporal, parietal, occipital)
4 years Rate of change of gray but not white matter in frontal,
temporal, and parietal lobes increased in
schizophrenia
Note. CSF=cerebrospinal fluid; MRI=magnetic resonance imaging.
Source. Adapted from Shenton ME, Dickey CC, Frumin M, et al.: “A Review of MRI Findings in Schizophrenia.” Schizophrenia Research 49(1–2):1–52, 2001. Copyright 2001, Elsevier
Science (www.elsevier.com). Used with permission.
Table 2–9. MRI studies of progressive volume changes in schizophrenia (continued)
Patient sample Study N Region of interest
Follow-up
period Findings
Magnetic Resonance Imaging 55
Posttraumatic Stress Disorder
Multiple studies have found moderate evidence for gen-
eralized cortical atrophy (e.g., sulcal widening) and spe-
cific hippocampal volume reduction (Figure 2–34) asso-
ciated with severe long-standing posttraumatic stress
disorder (PTSD). Intensive investigations are under way
to better characterize these changes through functional
neuroimaging.
Attention-Deficit/Hyperactivity
Disorder
Many structural MRI studies of attention-deficit/hy-
peractivity disorder (ADHD) have been performed.
Several have found smaller total brain volumes in
ADHD subjects, representing an equal global reduc-
tion of gray and white matter (Rapoport et al. 2001). A
sampling of subcortical structural MRI findings in
ADHD are summarized in Table 2–10.
Longitudinal studies suggest that these changes in
ADHD are fixed rather than progressive (Rapoport et
al. 2001). Many of these findings support theoretical
models of ADHD mechanisms implicating frontostri-
atal circuits; cerebellar contributions are intriguing and
require further theoretical refinement.
Borderline Personality Disorder
Borderline personality disorder is increasingly a target
of functional neuroimaging research, and there have
been scattered reports of structural abnormalities in
patients with this disorder. In a structural MRI study
comparing 25 borderline personality disorder patients
with age-matched control subjects, Lyoo et al. (1998)
found smaller frontal lobe volumes in the patients.
Other reports have described inconsistent findings.
Cognitive Disorders
Neuroimaging can be an essential aid in determining
the etiology of cognitive dysfunction. Both primary
neurodegenerative dementias and secondary processes
can have associated structural abnormalities potentially
discernible by MRI. For secondary processes, epidemi-
ological studies have found the likelihood of detecting
a clinically significant but covert (i.e., no noncognitive
signs or symptoms indicating a lesion’s presence) struc-
tural lesion (e.g., neoplasm, subdural hematoma, nor-
mal-pressure hydrocephalus) to be approximately 5%
(Freter et al. 1998; Van Crevel et al. 1999).
Although we discuss the following primary neuro-
degenerative (e.g., AD, Pick’s disease) and secondary
processes (e.g., vascular dementia, human immunode-
ficiency virus [HIV] encephalopathy) under the cate-
gory of cognitive disorders, it should be emphasized that
because all of these diseases also have the potential to produce
a full range of psychiatric manifestations, the relevant neuro-
imaging discussion equally applies to evaluating affective,
delusional, hallucinatory, and other psychiatric clinical ex-
pressions of these processes. For example, frontal and tha-
lamic strokes are known to be frequently associated
with a variety of affective disorders, with important lat-
erality considerations.
Primary Neurodegenerative Processes
Alzheimer’s Disease. Alzheimer’s-associated struc-
tural changes potentially demonstrable on MRI in-
clude temporal, parietal, and generalized atrophy (Fig-
ure 2–35). Coronal T1 images are best for specifically
evaluating hippocampal atrophy.
Figure 2–34. Patients (both combat veterans) with
(A) and without (B) posttraumatic stress disorder, as
seen on coronal T1-weighted MRI.
Source. Reprinted from Gurvits TV, Shenton ME, Hokama
H, et al.: “Magnetic Resonance Imaging Study of Hippocam-
pal Volume in Chronic Combat-Related Posttraumatic Stress
Disorder.” Biological Psychiatry 40:1091–1099, 1996. Copyright
1996, Elsevier Science (www.elsevier.com). Used with per-
mission.
56 ESSENTIALS OF NEUROIMAGING FOR CLINICAL PRACTICE
The hippocampus, parahippocampal gyrus, and
temporal lobe in general are among brain regions most
consistently implicated in neurodegenerative demen-
tias, especially AD, even at an early stage (Scheltens
1999; Steffens et al. 2002). Neuropsychological assess-
ments of recent memory are highly correlated with
visually rated hippocampal atrophy, and hippocam-
pal volume loss is strongly associated with neurofib-
rillary pathology in AD (Bobinski et al. 1996; Scheltens
1999).
Combining volumetric data with other potentially
informative markers (e.g., apolipoprotein E genotyp-
ing, functional neuroimaging) may offer potential for
improving diagnostic accuracy. For clinical purposes,
volumetric measurements are helpful but are not re-
quired; visual inspection is usually sufficient.
Clinical studies of mild cognitive impairment, in-
creasingly conceptualized as a harbinger of AD, have
focused on early recognition to facilitate prompt inter-
vention in an attempt to delay AD progression. Stud-
ies need to be performed to better characterize those
structural imaging changes that are specifically associ-
ated with mild cognitive impairment, thus offering
potential use as signifiers of future cognitive decline.
However, given that atrophy is seen only after a sub-
stantial proportion of neurons have died, more sensi-
tive methods (e.g., functional neuroimaging) for de-
tecting such states will need to be developed for earlier
diagnosis.
Frontotemporal Lobe Dementias. Structural neuroimag-
ing usually—but not always—demonstrates bilateral
and relatively symmetric frontal and/or temporal gyral
atrophy in frontotemporal lobe dementias (FTLDs)
(Gregory et al. 1999). This can be strikingly demon-
strated on sagittal T1 images, especially medial sagittal
Table 2–10. Subcortical MRI abnormalities reported in attention-deficit/hyperactivity disorder (ADHD)
Brain region Study Findings
Basal ganglia Aylward et al. 1996 Left globus pallidus volume smaller in ADHD
Castellanos et al. 1996 Symmetry in prefrontal brain, caudate, globus pallidus significantly
decreased in ADHD
Filipek et al. 1997 Left caudate smaller in ADHD; right anterior superior white matter
diminished; posterior white matter volumes decreased only in stimulant
nonresponders
Mataro et al. 1997 Right caudate larger in ADHD
Cerebellum Berquin et al. 1998 Posterior inferior cerebellar vermis volume significantly smaller in ADHD
Mostofsky et al. 1998 Posterior inferior cerebellar vermis significantly smaller in ADHD
Castellanos et al. 2001 Posterior inferior cerebellar vermis volume significantly smaller in ADHD
Note. MRI=magnetic resonance imaging.
Source. Adapted from Rapoport JL, Castellanos FX, Gogate N, et al.: “Imaging Normal and Abnormal Brain Development: New Per-
spectives for Child Psychiatry.” Australian and New Zealand Journal of Psychiatry 35:272–281, 2001. Copyright 2001, Blackwell Publish-
ing. Used with permission.
Figure 2–35. Alzheimer’s disease as seen on axial T1-weighted MRI.
Magnetic Resonance Imaging 57
images, which can reveal the “knife-edge” atrophy fre-
quently seen at later stages of this disease (Miller and
Gearhart 1999) (Figure 2–36).
In the semantic dementia variant of FTLD, MRI can
reveal anterior temporal neocortical atrophy, with infe-
rior and middle temporal gyri predominantly affected
(Miller and Gearhart 1999). Asymmetries of temporal
involvement can reflect relative severity of impairment
for verbal versus visual concepts (word meaning versus
object recognition) (Miller and Gearhart 1999). In the
progressive nonfluent aphasia variant of FTLD, MRI
can show Sylvian fissure widening with atrophy of the
insula, inferior frontal, and superior temporal lobes
(dominant greater than nondominant hemisphere).
Dementia With Lewy Bodies. Nonspecific atrophy is
the only typical MRI finding in dementia with Lewy
bodies. Some patients show less temporal lobe atrophy
than do patients with AD (Papka et al. 1998).
Posterior Cortical Atrophy. Posterior cortical atrophy
is a selective lobar dementia characterized by initial
disturbances of visual perception and integration (Ben-
son et al. 1988). Involvement of the occipito-parietal
region produces visuospatial and attentional distur-
bances (sometimes including Balint’s syndrome), with
relative sparing of personality, insight, and memory
(Benson et al. 1988). Axial and sagittal T1 MR images
can demonstrate the selective atrophy of posterior cor-
tical structures (Figure 2–37).
Huntington’s Disease. Huntington’s disease is a proto-
typical subcortical neurodegenerative disorder, with
multiple neuropsychiatric clinical manifestations. MRI
findings, which are most discernible on coronal T1 im-
ages, include basal ganglia atrophy (primarily caudate).
Secondary Processes
Structural
Normal-Pressure Hydrocephalus. The neuroradiologi-
cal correlate of the clinical syndrome of normal-pres-
sure hydrocephalus (classically marked by the triad of
mental status change, gait apraxia, and urinary inconti-
nence) is communicating (also called nonobstructive)
hydrocephalus. It can often be challenging to distin-
guish genuine communicating hydrocephalus from
Figure 2–36. Frontotemporal lobar dementia as
seen on sagittal T1-weighted MRI.
Source. Reprinted from Zimmerman RA, Gibby WA, Carmody
RF (eds.): “The Aging Brain and Neurodegenerative Disorders,”
in Neuroimaging: Clinical and Physical Principles. New York,
Springer, 2000, p. 960. Copyright 2000. Used with permission.
Figure 2–37. Posterior cortical atrophy as seen on axial T1-weighted MRI.
58 ESSENTIALS OF NEUROIMAGING FOR CLINICAL PRACTICE
ventricular dilatation proportionate to cerebral atrophy
(hydrocephalus ex vacuo). Features supporting an in-
terpretation of communicating hydrocephalus include
ventricular enlargement disproportionate to cortical
sulci depth, anterior third ventricle enlargement, bow-
ing of the corpus callosum, and a flow void in the fourth
ventricle on T2-weighted MRI (Figure 2–38) (Hurley et
al. 1999).
Subdural Hematoma. Subdural hematoma can often
be visualized on MRI as an extraneuraxial crescent-
shaped abnormality. Typically involving a portion of—
or, less commonly, an entire—cerebral convexity, sub-
dural hematoma can also occur below tentorial dural
regions. When subdural hematoma is convexity-based,
ipsilateral obliteration of cortical sulci is usually seen
(Figure 2–39). If the hematoma is large, mass effects
such as ventricular compression can occur. It should
be emphasized that subdural hematoma, particularly
in the elderly, can present solely as a mental status
change.
Metabolic
Wilson’s Disease. In Wilson’s disease, MRI often dem-
onstrates bilateral cortical and basal ganglia abnormal-
ities, including atrophy, with compensatory ventricular
dilatation (Nazer et al. 1993; Thomas et al. 1993). Incon-
sistently present but relatively unique characteristics
visualized on structural neuroimaging include basal
ganglia cystic degeneration and cavitary necrosis.
Hepatic Encephalopathy. MRI findings in hepatic en-
cephalopathy can include generalized atrophy and
basal ganglia T1 hyperintensities (Maeda et al. 1997).
The latter phenomenon appears to be in part secondary
to deposition of paramagnetic substances (e.g., manga-
nese) (Figure 2–40).
Toxic
Alcoholism. Chronic alcoholism can be associated with
cerebellar (especially vermis) and generalized atrophy.
Wernicke-Korsakov syndrome can be associated with
mammillary body, thalamic, and midbrain abnormali-
ties (e.g., FLAIR hyperintensities) (Figure 2–41).
Cerebrovascular
Strokes—small and large, ischemic and hemorrhagic,
cortical and subcortical—represent the second most
common cause of cognitive dysfunction, and laterality
has long been known to have implications for affective
function (e.g., association of left-hemisphere infarcts
with depression and right-hemisphere infarcts with
manic-like symptoms) (Robinson 1998).
Figure 2–38. Normal-pressure hydrocephalus as
seen on axial T2-weighted MRI (A) and sagittal T1-
weighted MRI (B).
Source. Image A reprinted from Prockop LD: “Disorders of
cerebrospinal and brain fluids,” in Merritt’s Textbook of Neu-
rology, 9th Edition. Edited by Merritt HH, Rowland LP. Balti-
more, MD, Williams & Wilkins, 1994, p. 299. Copyright 1995,
Williams & Wilkins. Used with permission.
Image B reprinted from Hurley RA, Bradley WG Jr, Latifi HT,
et al.: “Normal Pressure Hydrocephalus: Significance of MRI
in a Potentially Treatable Dementia.” Journal of Neuropsychiatry
and Clinical Neurosciences 11:297–300, 1999. Copyright 1999,
American Psychiatric Publishing, Inc. Used with permission.
Magnetic Resonance Imaging 59
One of the most important uses of FLAIR MRI is for
distinguishing subcortical and cortical ischemic dis-
ease in the differential diagnosis of cortical versus sub-
cortical dysfunction. Cortical infarcts can be distin-
guished from subcortical ischemic disease, and subcor-
tical disease can be separated into gray matter (e.g.,
basal ganglia) lesions and white matter lesions. More-
over, white matter disease can be further subdivided,
with critical implications for neuropsychiatric func-
tion. For example, periventricular white matter disease
(e.g., consistent with small-vessel pathology secondary
to long-standing chronic hypertensive disease) can be
distinguished from more extensive deep white matter
pathology (e.g., consistent with more malignant cere-
brovascular hypertension). Multiple small infarctions
of subcortical white matter pathways, disconnecting
circuitry among cognitively important cortical and
subcortical centers, causes a subcortical microvascu-
lar leukoencephalopathy previously known as Bins-
wanger’s disease. MRI can also be invaluable in help-
Figure 2–39. Subdural hematoma as seen on axial T1-weighted postcontrast MRI.
Figure 2–40. Hepatic encephalography (note basal ganglia hyperintensities) as seen on axial T1-weighted
MRI (A) and coronal T1-weighted MRI (B).
Source. Reprinted from Maeda H, Sato M, Yoshikawa A, et al.: “Brain MR Imaging in Patients With Hepatic Cirrhosis: Relationship
Between High Intensity Signal in Basal Ganglia on T1-Weighted Images and Elemental Concentrations in Brain.” Neuroradiology
39:546–550, 1997. Copyright 1997, Springer-Verlag Heidelberg. Used with permission.
60 ESSENTIALS OF NEUROIMAGING FOR CLINICAL PRACTICE
ing to diagnose syndromes that, although relatively
rare, can produce prominent psychiatric symptoms
(e.g., mitochondrial encephalopathy lactic acidosis and
stroke [MELAS]). Sample MR images of cerebrovascu-
lar disease are presented in Figure 2–42.
Neoplastic
MRI is the gold standard for detecting primary and
metastatic tumors (Figure 2–43). Even slow-growing
benign tumors (e.g., meningioma), especially in frontal
locations, can sometimes have psychiatric symptoms
as their sole clinical expression (Lampl et al. 1995). Lep-
tomeningeal disease can also be visualized as weaving
of contrast enhancement into the sulci. Paraneoplastic
limbic encephalitis can sometimes be visualized on
FLAIR images, especially as medial temporal hyperin-
tensities (Gultekin et al. 2000).
Radiation Necrosis
MRI often demonstrates leukoencephalopathy in pa-
tients who have undergone radiation therapy of the
brain as treatment for intracranial malignancies (Fig-
ure 2–44). This effect can be delayed—in pathogenesis,
clinical expression, and neuroradiological manifesta-
tions—for many years after treatment delivery.
Inflammatory
Multiple Sclerosis. MRI greatly facilitates the diagno-
sis of multiple sclerosis. FLAIR images are especially
useful, and sagittal FLAIR images in particular can be
essential for diagnosis, because multiple sclerosis–
related white matter plaques tend to originate perical-
losally with medial centrifugal radiation, creating a
characteristic pattern known as Dawson’s fingers (Fig-
ure 2–45). Demonstration of this pattern, best observed
with a sagittal orientation, helps differentiate such le-
sions from the multiple other causes (frequently be-
nign and/or idiopathic) of white matter lesions visual-
ized on FLAIR.
Neurosarcoidosis. Central nervous system (CNS) sar-
coidosis can manifest as nodular leptomeningeal en-
hancement and/or multifocal parenchymal lesions, in-
cluding hypothalamic involvement. Neurosarcoidosis
is also included in the wide differential diagnosis of
subcortical T2 hyperintensities.
Infectious
Lyme Disease. Lyme disease can be associated with
variable primarily subcortical abnormalities, which are
best visualized by FLAIR images.
Neurosyphilis. Tertiary syphilis can manifest in the
CNS as a meningovascular inflammation, producing
variable cortical and, more commonly, subcortical
FLAIR-detectable lesions.
Herpes Encephalitis. In herpes encephalitis, MRI can re-
veal temporal lobe pathology—including loss of gray–
white differentiation, edema, hemorrhagic components,
and/or abnormal contrast enhancement (Figure 2–46)—
during the first week of disease (Schroth et al. 1987).
Human Immunodeficiency Virus. Multiple potential
primary (e.g., nonspecific atrophy) and secondary (e.g.,
opportunistic infections) HIV-related pathologies can
be visualized on MRI (Figure 2–47).
Creutzfeldt-Jakob Disease. MRI often demonstrates a
characteristic “cortical ribboning” on diffusion-weighted
imaging (Figure 2–48).
Figure 2–41. Alcoholism complicated by Wer-
nicke-Korsakov syndrome, as seen on axial FLAIR
MRI.
Source. Reprinted from Chu K, Kang DW, Kim HJ, et al.:
“Diffusion-Weighted Imaging Abnormalities in Wernicke En-
cephalopathy: Reversible Cytotoxic Edema?” Archives of Neu-
rology 59:123–127, 2002. Copyright 2002, American Medical
Association. Used with permission.
Magnetic Resonance Imaging 61
Figure 2–42. Cerebrovascular disease as seen on axial T1-weighted MRI (A), axial T2-weighted MRI (B), axial
FLAIR MRI (C), and axial DWI MRI (D).
62 ESSENTIALS OF NEUROIMAGING FOR CLINICAL PRACTICE
Figure 2–43. Neoplastic tumors. A, As seen on sagittal T1-weighted MRI.
Magnetic Resonance Imaging 63
Figure 2–43 (continued). Neoplastic tumors. B, As seen on sagittal T1-weighted postcontrast MRI.
64 ESSENTIALS OF NEUROIMAGING FOR CLINICAL PRACTICE
Figure 2–43 (continued). Neoplastic tumors. C, As seen on coronal T1-weighted postcontrast MRI.
Figure 2–44. Radiation necrosis as seen on axial FLAIR MRI.
Magnetic Resonance Imaging 65
Figure 2–45. Multiple sclerosis as seen on axial T2-weighted MRI (A) and revealing Dawson’s fingers on
sagittal FLAIR MRI (B).
Source. Image A reprinted from Loevner LA: Brain Imaging. St. Louis, MO, CV Mosby, 1999, p. 27. Copyright 1999, Elsevier Science
Inc. (www.elsevier.com). Used with permission.
66 ESSENTIALS OF NEUROIMAGING FOR CLINICAL PRACTICE
Figure 2–46. Herpes simplex encephalitis as seen
on coronal T2-weighted MRI.
Source. Reprinted from Schroth G, Gawehn J, Thron A, et al.:
“Early Diagnosis of Herpes Simplex Encephalitis by MRI.”
Neurology 37:179–183, 1987. Copyright 1987, Lippincott Will-
iams & Wilkins (www.lww.com). Used with permission.
Figure 2–47. HIV-related leukoencephalopathy
(progressive multifocal leukoencephalopathy) as seen
on axial T2-weighted MRI.
Source. Reprinted from Loevner LA: Brain Imaging. St. Louis,
MO, CV Mosby, 1999, p. 89. Copyright 1999, Elsevier Science
Inc. (www. elsevier.com). Used with permission.
Figure 2–48. Creutzfeldt-Jakob disease as seen on axial DWI MRI.