Oxford Handbook of Critical Care - part 3 ppsx
Bạn đang xem bản rút gọn của tài liệu. Xem và tải ngay bản đầy đủ của tài liệu tại đây (540.86 KB, 26 trang )
Ovid: Oxford Handbook of Critical Care file:///C:/Documents%20and%20Settings/MVP/Application%20Data/Mozilla/Firefox/Profiles/2
52 из 254 07.11.2006 1:04
P.120
P.121
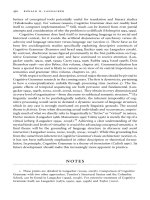
Pulmonary artery catheter—insertion
Insertion
Insert 8Fr central venous introducer sheath under strict aseptic technique. Pulmonary artery catheterisation is
easier via internal jugular or subclavian veins.
1.
Prepare catheter pre-insertion—3-way taps on all lumens, flush lumens with crystalloid, inflate balloon with
1.6ml air and check for concentric inflation and leaks, place transparent sleeve over catheter to maintain future
sterility, pressure transduce distal lumen and zero to a reference point (usually mid-axillary line). Depending on
catheter type, other pre-insertion calibration steps may be required, e.g. oxygen saturation.
2.
Insert catheter 15cm (i.e. beyond the length of the introducer sheath) before inflating balloon. Advance catheter
smoothly through the right heart chambers. Pause to record pressures and note waveform shape in RA, RV and
PA. When a characteristic PAWP waveform is obtained, stop advancing catheter, deflate balloon and ensure that
PA waveform reappears. If not, withdraw catheter by a few cm.
3.
Slowly re-inflate balloon, observing waveform trace. The wedge recording should not be obtained until at least
1.3ml of air has been injected into the balloon. If not, withdraw catheter 1–2cm and repeat. If ‘overwedged’
(pressure continues to climb on inflation), catheter is inserted too far and balloon has inflated forward over
distal lumen. Immediately deflate, withdraw catheter 1–2cm and repeat.
4.
After insertion, a CXR is usually performed to verify catheter position and to exclude pneumothorax.5.
Contraindications/cautions
Coagulopathy
Tricuspid valve prosthesis or disease
Complications
Problems of central venous catheterisation
Arrhythmias (especially when traversing tricuspid valve)
Infection (including endocarditis)
Pulmonary artery rupture
Pulmonary infarction
Knotting of catheter
Valve damage (do not withdraw catheter unless balloon deflated)
Troubleshooting
Excessive catheter length in a heart chamber causes coiling and a risk of knotting. No more than 15–20cm should be
passed before the waveform changes. If not, deflate balloon, withdraw catheter, repeat. A knot can be managed by
(i) ‘unknotting’ with an intraluminal wire, (ii) pulling taut and removing catheter + introducer sheath together, or
(iii) surgical or angiographic intervention.
If catheter fails to advance to next chamber, consider ‘stiffening’ catheter by injecting iced crystalloid through distal
lumen, rolling patient to left lateral position or advancing catheter slowly with balloon deflated.
The catheter should never be withdrawn with the balloon inflated.
Arrhythmias on insertion usually occur when the catheter tip is at the tricuspid valve. These usually resolve on
withdrawing the catheter or, occasionally, after a slow bolus of 1.5mg/kg lidocaine.
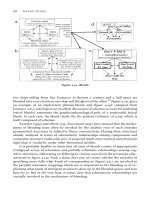
Waveforms
Ovid: Oxford Handbook of Critical Care file:///C:/Documents%20and%20Settings/MVP/Application%20Data/Mozilla/Firefox/Profiles/2
53 из 254 07.11.2006 1:04
P.122
P.123
P.124
Figure. No Caption Available.
See also:
Central venous catheter—insertion, p116; Pulmonary artery catheter—use, p118; Pneumothorax, p300; Haemothorax,
p302; Tachyarrhythmias, p316
Cardiac output—thermodilution
Thermodilution is the technique utilised by the pulmonary artery catheter to measure right ventricular cardiac output.
The principle is a modification of the Fick principle whereby a bolus of cooled 5% glucose is injected through the
proximal lumen into the central circulation (right atrium) and the temperature change is detected by a thermistor at
the catheter tip, some 30cm distal. A modification of the Hamilton–Stewart equation, utilising the volume,
temperature and specific heat of the injectate, enables cardiac output to be calculated by an on-line computer from a
curve measuring temperature change in the pulmonary artery.
Continuous thermodilution measurement uses a modified catheter that emits heat pulses from a thermal filament
lying within the right ventricle and right atrium, 14–25cm from the tip. 7.5W of heat are added to the blood
intermittently every 30–60s and these temperature changes are measured by a thermistor 4cm from the tip. Though
updated frequently, the cardiac output displayed is usually an average of the previous 3–6min.
Thermodilution injection technique
The computer constant must be set for the volume and temperature of the 5% glucose used. 10ml of ice-cold glucose
provides the most accurate measure. 5ml of room temperature injectate is sufficiently precise for normal and high
output states however its accuracy does worsen at low output values.
Press ‘Start’ button on computer.1.
Inject fluid smoothly over 2–3s.2.
Repeat at least twice more at random points in the respiratory cycle.3.
Average 3 measurements falling within 10% of each other. Reject outputs gained from curves that are
irregular/non-smooth.
4.
Erroneous readings
Valve lesions—tricuspid regurgitation will allow some of the injectate to reflux back into the right atrium. Aortic
incompetence produces a higher left ventricular output as a proportion will regurgitate back into the left
ventricle.
Septal defects.
Loss of injectate. Check that connections are tight and do not leak.
Advantages
Most commonly used and familiar ICU technique, computer warnings of poor curves.
Disadvantages
Non-continuous (by injection technique).
5–10% inter- and intraobserver variability.
Erroneous readings with tricuspid regurgitation, intracardiac shunts.
Frequently repeated measurements may result in considerable volumes of 5% glucose being injected.
See also:
Pulmonary artery catheter—use, p118; Cardiac output—other invasive, p124; Cardiac output—non-invasive (1), p146;
Cardiac output—non-invasive (2), p146; Fluid challenge, p274; Hypotension, p312; Heart failure—assessment, p324;
Systemic inflammation/multi-organ failure, p484; Burns—fluid management, p510
Cardiac output—other invasive
Dye dilution
Mixing of a given volume of indicator to an unknown volume of fluid allows calculation of this volume from the degree
of indicator dilution. The time elapsed for the indicator to pass some distance in the cardiovascular system yields a
Ovid: Oxford Handbook of Critical Care file:///C:/Documents%20and%20Settings/MVP/Application%20Data/Mozilla/Firefox/Profiles/2
54 из 254 07.11.2006 1:04
P.125
P.126
cardiac output value, calculated as:
…where I is the amount of indicator injected, C
m
is the mean concentration of the indicator and t is the total duration
of the curve. The traditional dye dilution technique is to inject indocyanine green into a central vein followed by
repeated sampling of arterial blood to enable construction of a time–concentration curve with a rapid upstroke and an
exponential decay. Plotting the dye decay curve semilogarithmically and extrapolating values to the origin produces
the cardiac output. The COLD-Pulsion device measures the concentration decay directly from an indwelling arterial
probe, thus computing cardiac output. Alternatively, this device may use the thermodilution approach, avoiding
pulmonary artery catheterisation. The LiDCO device is based on a similar principle using lithium as the ‘dye’.
Advantages
Reasonably accurate, less invasive than pulmonary artery catheter placement.
Disadvantages
Invasive, recirculation of dye prevents multiple repeated measurements, lengthy, underestimates low output values.
Inaccurate with moderate/ severe valvular regurgitation. Use of paralysing agents may interfere with lithium
measurement.
Direct Fick
The amount of substance passing into a flowing system is equal to the difference in concentration of the substance on
each side of the system multiplied by the flow within the system. Cardiac output is thus usually calculated by
dividing total body oxygen consumption by the difference in oxygen content between arterial and mixed venous
blood. Alternatively, CO
2
production can be used instead of VO
2
as the indicator. Arterial CO
2
can be derived
non-invasively from end-tidal CO
2
while mixed venous CO
2
can be determined by rapid rebreathing into a bag until
CO
2
levels have equilibrated.
Advantages
‘Gold standard’ for cardiac output estimation.
Disadvantages
For VO
2
: Invasive (requires measurement of mixed venous blood), requires leak-free open circuit or an unwieldy
closed circuit technique. Oxygen consumption measurements via metabolic cart unreliable if FIO
2
is high. Lung
oxygen consumption not measured by pulmonary artery catheter technique (may be high in ARDS, pneumonia…).
For CO
2
: Non-invasive but requires normal lung function and is thus not generally applicable in ICU patients.
See also:
CO
2
monitoring, p92; Blood gas analysis, p100; Extravascular lung water measurement, p104; Pulmonary artery
catheter—use, p118; Cardiac output—thermodilution, p122; Cardiac output—non-invasive (1), p126; Cardiac
output—non-invasive (2), p128; Indirect calorimetry, p168; Fluid challenge, p274; Hypotension, p312; Heart
failure—assessment, p324; Systemic inflammation/multi-organ failure, p484; Burns—fluid management, p510
Cardiac output—non-invasive (1)
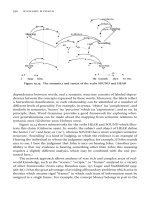
Doppler ultrasound
An ultrasound beam of known frequency is reflected by moving red blood corpuscles with a shift in frequency
proportional to the blood flow velocity. The actual velocity can be calculated from the Doppler equation which
requires the cosine of the vector between the direction of the ultrasound beam and that of blood flow. This has been
applied to blood flow in the ascending aorta and aortic arch (via a suprasternal approach), descending thoracic aorta
(oesophageal approach) and intracardiac flow (e.g. transmitral from an apical approach). Spectral analysis of the
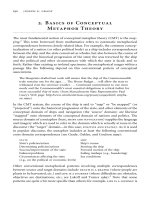
Doppler frequency shifts produces velocity–time waveforms, the area of which represents the ‘stroke distance’, i.e.
the distance travelled by a column of blood with each left ventricular systole (see figure opposite). The product of
stroke distance and aortic (or mitral valve) cross-sectional area is stroke volume. Cross-sectional area can be
measured echocardiographically; however, as both operator expertise and equipment is required, this additional
measurement can be either ignored or assumed from nomograms to provide a reasonable estimate of stroke volume.
Advantages
Quick, safe, minimally invasive, reasonably accurate, continuous (via oesophageal approach), other information on
contractility, preload and afterload from waveform shape (see figure opposite).
Disadvantages
Non-continuous (unless via oesophagus), learning curve, operator dependent.
Echocardiography
Combines structural as well as dynamic assessment of the heart using ultrasound reflected off various interfaces.
Transthoracic or transoesophageal probes provide information on valve integrity, global (diastolic and systolic) and
Ovid: Oxford Handbook of Critical Care file:///C:/Documents%20and%20Settings/MVP/Application%20Data/Mozilla/Firefox/Profiles/2
55 из 254 07.11.2006 1:04
P.127
P.128
regional ventricular function, wall thickness, pericardial fluid or thickening, aortic dissection, ventricular volumes and
ejection fraction, and pulmonary pressures. Often combined with integral Doppler ultrasound for cardiac output
estimation derived from combined measurement of aortic diameter plus flow at various sites, e.g. left ventricular
outflow tract, aorta, transmitral. Analytic software or formulae can also enable computation of cardiac output from
estimations of ventricular volumes.
Advantages
Non-invasive, safe, relatively quick. Provides other useful information on cardiac structure and function.
Disadvantages
Expensive equipment, lengthy learning curve and interobserver variability. Body habitus or pathology (e.g.
emphysema) may impair image quality.
Doppler blood flow velocity waveform variables
Figure. No Caption Available.
Changes in Doppler flow velocity waveform shape
Figure. No Caption Available.
See also:
Cardiac output—thermodilution, p122; Cardiac output—other invasive, p124; Cardiac output—non-invasive (2), p128;
Fluid challenge, p274; Hypotension, p312; Heart failure—assessment, p324; Systemic inflammation/multi-organ
failure, p484; Burns—fluid management, p510
Cardiac output—non-invasive (2)
Pulse contour analysis
The concept of this technique is that the contour of the arterial pressure waveform is proportional to stroke volume.
However, it is also influenced by aortic impedance so another cardiac output measuring technique (e.g. commercial
devices utilising COLD-Pulsion or LiDCO) must be used in tandem for initial calibration. Although it can then be used
as a means of continuous cardiac output monitoring, frequent re-calibration should be performed against the
reference technique. This is particularly important when changes in impedance occur, e.g. with changes in cardiac
Ovid: Oxford Handbook of Critical Care file:///C:/Documents%20and%20Settings/MVP/Application%20Data/Mozilla/Firefox/Profiles/2
56 из 254 07.11.2006 1:04
P.129
P.130
output, vascular tone, body temperature.
Advantages
Continuous flow monitoring, uses data from arterial cannula already in situ for pressure monitoring.
Disadvantages
Changes in vascular compliance will affect accuracy requiring frequent recalibration. Requires a good quality,
non-obstructed and non-damped arterial waveform. There is debate about the relative quality of signal from radial vs.
femoral artery.
Thoracic bioimpedance
Impedance changes originate in the thoracic aorta when blood is ejected from the left ventricle. This effect is used to
determine stroke volume from formulae utilising the electrical field size of the thorax, baseline thoracic impedance
and fluctuation related to systole, and ventricular ejection time. A correction factor for sex, height and weight is also
introduced. The technique simply utilises four pairs of electrodes placed in proscribed positions on the neck and
thorax; these are connected to a dedicated monitor which measures thoracic impedance to a low amplitude, high
(70kHz) frequency 2.5mA current applied across the electrodes.
Advantages
Quick, safe, totally non-invasive, reasonably accurate in normal, spontaneously breathing subjects.
Disadvantages
Discrepancies in critically ill patients (especially those with arrhythmias, tachycardias, intrathoracic fluid shifts,
anatomical deformities, aortic regurgitation), metal within the thorax, inability to verify signal.
See also:
Cardiac output—thermodilution, p122; Cardiac output—other invasive, p124; Cardiac output—non-invasive (1), p126;
Fluid challenge, p274; Hypotension, p312; Heart failure—assessment, p324; Systemic inflammation/multi-organ
failure, p484; Burns—fluid management, p510
Gut tonometry
A gas permeable silicone balloon attached to a sampling tube is passed into the lumen of the gut. Devices exist for
tonometry in the stomach or sigmoid colon. The tonometer allows indirect measurement of the PCO
2
of the gut
mucosa and calculation of the pH of the mucosa.
Indications
Gut mucosal hypoperfusion is an early consequence of hypovolaemia. Covert circulatory inadequacy due to
hypovolaemia may be detected as gut mucosal acidosis and has been related to post-operative complications after
major surgery. In critically ill patients there is some evidence that prevention of gut mucosal acidosis improves
outcome. The sigmoid colon tonometer is useful to detect ischaemic colitis early (e.g. after abdominal vascular
surgery).
Technique
Saline tonometry
In the original technique the tonometer balloon was prepared by degassing and filling with 2.5ml 0.9% saline. The
saline was withdrawn into a syringe connected to the sampling tube prior to insertion. After insertion the saline was
passed back into the balloon. The PCO
2
of the saline in the balloon equilibrated with the PCO
2
of the gut lumen over a
period of 30–90min. At steady state it was assumed that the PCO
2
of the gut lumen and gut mucosa were in
equilibrium. Time correction factors were derived for partial equilibration between the balloon saline and the gut
lumen. The measurement was completed by sampling the saline from the balloon and an arterial blood sample for
measurement of arterial [HCO
3
-
].
Gas tonometry
Using air in the tonometry balloon allows more rapid equilibration between the tonometer and the luminal PCO
2
. A
modified capnometer automatically fills the balloon with air and samples the PCO
2
after 5–10min equilibration.
Subsequent cycles of balloon filling do not use fresh air so CO
2
equilibration is quicker. Tonometric PCO
2
may be
compared with end-tidal PCO
2
(measured with the same capnometer) as an estimate of arterial PCO
2
. With a normal
capnogram, a balloon PCO
2
significantly higher than end-tidal PCO
2
implies gut mucosal hypoperfusion.
pH versus regional PCO
2
The pH of the gut mucosa (pHi) may be calculated using a modified Henderson–Hasselbach equation:
where K is the time dependent equilibration constant. However, most of the variation in the measurement is due to
variation in regional PCO
2
. Comparing regional PCO
2
with PaCO
2
gives as much information as making the calculation
Ovid: Oxford Handbook of Critical Care file:///C:/Documents%20and%20Settings/MVP/Application%20Data/Mozilla/Firefox/Profiles/2
57 из 254 07.11.2006 1:04
P.131
P.135
P.136
of pHi and overcomes the problematic assumption that arterial [HCO
3
-
] is equivalent to mucosal capillary [HCO
3
-
].
See also:
CO
2
monitoring, p92; Blood gas analysis, p100
Ovid: Oxford Handbook of Critical Care
Editors: Singer, Mervyn; Webb, Andrew R.
Title: Oxford Handbook of Critical Care, 2nd Edition
Copyright ©1997,2005 M. Singer and A. R. Webb, 1997, 2005. Published in the United States by Oxford University
Press Inc
> Table of Contents > Neurological Monitoring
Neurological Monitoring
Intracranial pressure monitoring
Indications
To confirm the diagnosis of raised intracranial pressure (ICP) and monitor treatment. May be used in cases of head
injury particularly if ventilated, Glasgow Coma Score ≤8, or with an abnormal CT scan. Also used in encephalopathy,
post-neurosurgery and in selected cases of intracranial haemorrhage. Although a raised ICP can be related to poor
prognosis after head injury, the converse is not true. Sustained reduction of raised ICP (or maintenance of cerebral
perfusion pressure) in head injury may improve outcome although large controlled trials are lacking.
Methods of monitoring intracranial pressure
Ventricular monitoring
A catheter is inserted into the lateral ventricle via a burr hole. The catheter may be connected to a pressure
transducer or may contain a fibreoptic pressure monitoring device. Fibreoptic catheters require regular calibration
according to the manufacturer's instructions. Both systems should be tested for patency and damping by temporarily
raising intracranial pressure (e.g. with a cough or by occluding a jugular vein). CSF may be drained through the
ventricular catheter to reduce intracranial pressure.
Subdural monitoring
The dura is opened via a burr hole and a hollow bolt inserted into the skull. The bolt may be connected to a pressure
transducer or admit a fibreoptic or hi-fidelity pressure monitoring device. A subdural bolt is easier to insert than
ventricular monitors. The main disadvantages of subdural monitoring are a tendency to underestimate ICP and
damping effects. Again calibration and patency testing should be performed regularly.
Complications
Infection—particularly after 5 days
Haemorrhage—particularly with coagulopathy or difficult insertion
Using ICP monitoring
Normal ICP is <10mmHg. A raised ICP is usually treated when >25mmHg in head injury. As ICP increases, there are
often sustained rises in ICP to 50–100mmHg lasting for 5–20min, increasing with frequency as the baseline ICP rises.
This is associated with a 60% mortality. Cerebral perfusion pressure (CPP) is the difference between mean BP and
mean ICP. Treatment aimed at reducing ICP may also reduce mean BP. It is important to maintain CPP >50–60mmHg.
See also:
Intracranial haemorrhage, p376; Subarachnoid haemorrhage, p378; Raised intracranial pressure, p382; Head injury
(1), p504; Head injury (2), p506
Jugular venous bulb saturation
Retrograde passage of a fibre-optic catheter from the internal jugular vein into the jugular bulb enables continuous
monitoring of jugular venous bulb saturation (SjO
2
). This can be used in conjunction with other monitors of cerebral
haemodynamics such as middle cerebral blood flow, cerebral arteriovenous lactate difference and intracranial
pressure to direct management.
Principles of SjO
2
management
Normal values are approximately 65–70%. In the absence of anaemia and with maintenance of normal SaO
2
values,
values of SjO
2
>75% suggest luxury perfusion or global infarction with oxygen not being utilised; values <54%
correspond to cerebral hypoperfusion while values <40% suggest global ischaemia and are usually associated with
Ovid: Oxford Handbook of Critical Care file:///C:/Documents%20and%20Settings/MVP/Application%20Data/Mozilla/Firefox/Profiles/2
58 из 254 07.11.2006 1:04
P.137
P.138
increased cerebral lactate production. Knowledge of SjO
2
allows optimisation of brain blood flow to avoid (i) either
excessive or inadequate perfusion and (ii) iatrogenically induced hypoperfusion through treating raised intracranial
pressure aggressively with diuretics and hyperventilation. Studies in trauma patients have found (i) a higher
mortality with episodes of jugular venous desaturation and (ii) a significant relationship between cerebral perfusion
pressure (CPP) and SjO
2
when the CPP was <70mmHg. A falling SjO
2
may be an indication to increase CPP though no
prospective randomised trial has yet been performed to study the effect on outcome.
Approximately 85% of cerebral venous drainage passes down one of the internal jugular veins (usually the right).
SjO
2
usually represents drainage from both hemispheres and is equal on both sides; however, after focal injury, this
pattern of drainage may alter.
Insertion technique
Insert introducer sheath rostrally in internal jugular vein.1.
Calibrate fibreoptic catheter pre-insertion.2.
Insert catheter via introducer sheath; advance to jugular bulb.3.
Withdraw introducer sheath.4.
Confirm (i) free aspiration of blood via catheter, (ii) satisfactory light intensity reading, (iii) satisfactory
positioning of catheter tip by lateral cervical X-ray (high in jugular bulb, above level of 2nd cervical vertebra).
5.
Perform in vivo calibration, repeat calibration 12-hrly.6.
Troubleshooting
If the catheter is sited too low in the jugular bulb, erroneous SjO
2
values may result from mixing of intracerebral and
extracerebral venous blood. This could be particularly pertinent when cerebral blood flow is low.
Ensure light intensity reading is satisfactory; if too high the catheter may be abutting against a wall, and if low the
catheter may not be patent or have a small clot over the tip. Before treating the patient, always confirm the veracity
of low readings against a blood sample drawn from the catheter and measured in a co-oximeter.
Formulae
where SjO
2
= jugular bulb oxygen saturation
SaO
2
(%) = arterial oxygen saturation
CMRO
2
= cerebral metabolism of oxygen
CBF = cerebral blood flow
cerebral perfusion pressure =mean systemic BP -intracranial pressure
See also:
Intracranial pressure monitoring, p134; Other neurological monitoring, p140; Intracranial haemorrhage, p376;
Subarachnoid haemorrhage, p378; Raised intracranial pressure, p382; Head injury (1), p504; Head injury (2), p506
EEG/CFM monitoring
EEG monitoring
The EEG reflects changes in cortical electrical function. This, in turn, is dependent on cerebral perfusion and
oxygenation. EEG monitoring can be useful to assess epileptiform activity as well as cerebral well-being in patients
who are sedated and paralysed. The conventional EEG can be used intermittently but data reduction and artefact
suppression are necessary to allow successful use of EEG recordings in the ICU.
Bispectral index (BIS) monitor
BIS is a statistical index derived from the EEG and expressed as a score between 0 and 100. Scores below 50 have
been reliably associated with anaesthesia-induced unconsciousness. Assessment in the critically ill patient may be
complicated by various confounding factors such as septic encephalopathy, head trauma and hypoperfusion. A low
score is related to deep or excessive sedation, and may allow dose reduction (or cessation) of sedative agents,
especially in paralysed patients.
Ovid: Oxford Handbook of Critical Care file:///C:/Documents%20and%20Settings/MVP/Application%20Data/Mozilla/Firefox/Profiles/2
59 из 254 07.11.2006 1:04
P.139
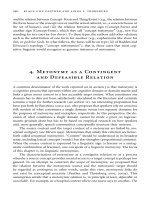
Cerebral function monitor (CFM)
The CFM is a single channel, filtered trace from 2 recording electrodes placed over the parietal regions of the scalp. A
third electrode may be used in the midline to help with interference detection. The parietal recording electrodes are
usually placed close to watershed areas of the brain in order to allow maximum sensitivity for ischaemia detection.
Voltage is displayed against time on a chart running at 6–30cm/h.
Figure. No Caption Available.
Use of CFM
The CFM may detect cerebral ischaemia; burst suppression (periods of increasingly prolonged electrical silence)
provide an early warning.
Sedation produces a fall in baseline to <5µV, equivalent to burst suppression. This is equivalent to maximum
reduction in cerebral VO
2
and no further benefit would be gained from additional sedation.
Seizure activity may be detected in patients despite apparently adequate clinical control or where muscle relaxants
have been used.
Typical CFM patterns
Ovid: Oxford Handbook of Critical Care file:///C:/Documents%20and%20Settings/MVP/Application%20Data/Mozilla/Firefox/Profiles/2
60 из 254 07.11.2006 1:04
P.140
Figure. No Caption Available.
Other neurological monitoring
Cerebral blood flow (CBF)
CBF can be measured by radioisotopic techniques utilising tracers such as xenon-133 given intravenously or by
inhalation. This remains a research tool in view of the radioactivity exposure and the usual need to move the patient
to a gamma-camera. However, portable monitors are now available. Middle cerebral artery (MCA) blood flow can be
determined non-invasively by transcranial Doppler ultrasonography. The pulsatility index (PI) relates to
cerebrovascular resistance with a rise in PI indicating a rise in resistance and cerebral vasospasm.
Vasospasm can also be designated when the MCA blood flow velocity exceeds 120cm/s and severe vasospasm when
velocities >200cm/s. Low values of common carotid end-diastolic blood flow and velocity have been shown to be
highly discriminating predictors of brain death. Impaired reactivity of CBF to changes in PCO
2
(in normals 3–5% per
mmHg PCO
2
change) is another marker of poor outcome.
Near-infra red spectroscopy (NIRS)
Near-infrared (700–1000nm) light propagated across the head is absorbed by haemoglobin (oxy- and de-oxy),
myoglobin and oxidised cytochrome aa
3
(the terminal part of the respiratory chain involved in oxidative
Ovid: Oxford Handbook of Critical Care file:///C:/Documents%20and%20Settings/MVP/Application%20Data/Mozilla/Firefox/Profiles/2
61 из 254 07.11.2006 1:04
P.141
phosphorylation).
The sum of (oxy- + deoxy-) haemoglobin is considered an index of cerebral blood volume (CBV) change, and the
difference as an index of change in haemoglobin saturation assuming no variation occurs in CBV. CBV and flow
can be quantified by changing the FIO
2
and measuring the response.
Cerebral blood flow is measured by a modification of the Fick principle. Oxyhaemoglobin is the intravascular
non-diffusible tracer, its accumulation being proportional to the arterial inflow of tracer. Good correlations have
been found with the xenon-133 technique.
Cytochrome aa
3
cannot be quantified by NIRS but its redox status may be followed to provide some indication of
mitochondrial function.
Movement artefact must be avoided and some devices require reduction of ambient lighting.
Lactate
The brain normally utilises lactate as a fuel; however, in states of severely impaired cerebral perfusion the brain may
become a net lactate producer with the venous lactate rising above the arterial value. A lactate oxygen index can be
derived by dividing the venous–arterial lactate difference by the arterio-jugular venous oxygen difference. Values
>0.08 are consistently seen with cerebral ischaemia.
See also:
Lactate, p170; Intracranial haemorrhage, p376; Subarachnoid haemorrhage, p378; Raised intracranial pressure,
p382; Head injury (1), p504; Head injury (2), p506; Brain stem death, p548
Ovid: Oxford Handbook of Critical Care
Editors: Singer, Mervyn; Webb, Andrew R.
Title: Oxford Handbook of Critical Care, 2nd Edition
Copyright ©1997,2005 M. Singer and A. R. Webb, 1997, 2005. Published in the United States by Oxford University
Press Inc
> Table of Contents > Laboratory Monitoring
Laboratory Monitoring
Urea and creatinine
Measured in blood, urine and, occasionally, in other fluids such as abdominal drain fluid (e.g. ureteric disruption,
fistulae)
Urea
A product of the urea cycle resulting from ammonia breakdown, it depends upon adequate liver function for its
synthesis and adequate renal function for its excretion. Low levels are thus seen in cirrhosis and high levels in renal
failure. Uraemia is a clinical syndrome including lethargy, drowsiness, confusion, pruritus and pericarditis resulting
from high plasma levels of urea (or, more correctly, nitrogenous waste products—azotaemia).
The ratio of urine:plasma urea may be useful in distinguishing oliguria of renal or pre-renal origins. Higher ratios
(>10:1) are seen in pre-renal conditions, e.g. hypovolaemia, whereas low levels (<4:1) occur with direct renal
causes.
24-h measurement of urinary urea (or nitrogen) excretion has been previously used as a guide to nutritional protein
replacement but is currently not considered a useful routine tool.
Creatinine
A product of creatine breakdown, it is predominantly derived from skeletal muscle and is also renally excreted. Low
levels are found with malnutrition and high levels with muscle breakdown (rhabdomyolysis) and impaired excretion
(renal failure). In the latter case, a creatinine value >120 µmol/l suggests a creatinine clearance <25ml/min.
The usual ratio for plasma urea (mmol/l) to creatinine (µmol/l) is approximately 1:10. A much lower ratio in a
critically ill patient is suggestive of rhabdomyolysis whereas higher ratios are seen in cirrhosis, malnutrition,
hypovolaemia and hepatic failure.
The ratio of urine:plasma creatinine may help distinguish between oliguria of renal or pre-renal origins. Higher ratios
(>40) are seen in pre-renal conditions and low levels (<20) with direct renal causes.
Creatinine clearance is a measure of glomerular filtration. Once filtered, only small amounts of creatinine are
reabsorbed. Normally it exceeds 100ml/min.
Normal plasma ranges
Ovid: Oxford Handbook of Critical Care file:///C:/Documents%20and%20Settings/MVP/Application%20Data/Mozilla/Firefox/Profiles/2
62 из 254 07.11.2006 1:04
P.145
P.146
Urea 2.5–6.5mmol/l
Creatinine 70–120µmol/l (depends on lean body mass)
See also:
Haemo(dia)filtration (1), p62; Haemo(dia)filtration (2), p64; Peritoneal dialysis, p6; Nutrition—use and indications;
Urinalysis, p166; Acute failure renal failure—diagnosis, p332; Acute renal failure—management, p334;
Rhabdomyolysis, p528
Electrolytes (Na
+
, K
+
, Cl
-
, HCO
3
-
)
Measured accurately by direct-reading ion-specific electrodes from plasma or urine, though are sensitive to
interference by excess liquid heparin.
Sodium, potassium
Plasma levels may be elevated but poorly reflect intracellular (approximately 3–5mmol/l for Na
+
, 140–150mmol/l for
K
+
) or total body levels. Plasma potassium levels are affected by plasma H
+
levels; a metabolic acidosis reduces
urinary potassium excretion while an alkalosis will increase excretion.
Older measuring devices such as flame photometry or indirect-reading ion-specific electrodes gave spuriously low
plasma Na
+
levels with concurrent hyperproteinaemia or hypertriglyceridaemia.
Urinary excretion depends on intake, total body balance, acid–base balance, hormones (including anti–diuretic
hormone, aldosterone, corticosteroids, atrial natriuretic peptide), drugs (particularly diuretics, non-steroidal
anti-inflammatories and ACE inhibitors), and renal function.
In oliguria, a urinary Na
+
level <10mmol/l suggests a pre-renal cause whereas >20mmol/l is seen with direct renal
damage. This does not apply if diuretics have been given previously.
Chloride, bicarbonate
Bicarbonate levels vary with acid–base balance.
In the kidney, Cl
-
reabsorption is increased when HCO
3
-
reabsorption is decreased, and vice versa. Plasma [Cl
-
] thus
tends to vary inversely with plasma [HCO
3
-
], keeping the total anion concentration normal. A raised [Cl
-
] (producing
a hyperchloraemic metabolic acidosis) may be seen with administration of large volumes of isotonic saline or isotonic
saline-containing colloid solutions. Hyperchloraemia is also found with experimental salt water drowning but rarely
seen in actual cases.
Anion gap
The anion gap is the difference between unestimated anions (e.g. phosphate, ketones, lactate) and cations.
In metabolic acidosis an increased anion gap occurs with renal failure, ingestion of acid, ketoacidosis and
hyperlactataemia, whereas a normal anion gap (usually associated with hyperchloraemia) is found with decreased
acid excretion (e.g. Addison's disease, renal tubular acidosis) and loss of base (e.g. diarrhoea, pancreatic/biliary
fistula, acetazolamide, ureterosigmoidostomy).
Normal plasma ranges
Sodium 135–145mmol/l
Potassium 3.5–5.3mmol/l
Chloride 95–105mmol/l
Bicarbonate 23–28mmol/l
Anion gap = plasma [Na
+
] + [K
+
] - [HCO3
-
] - [Cl
-
]
Ovid: Oxford Handbook of Critical Care file:///C:/Documents%20and%20Settings/MVP/Application%20Data/Mozilla/Firefox/Profiles/2
63 из 254 07.11.2006 1:04
P.147
P.148
P.149
P.150
Normal range 8–16mmol
See also:
Haemo(dia)filtration (1), p62; Haemo(dia)filtration (2), p64; Peritoneal dialysis, p66; Nutrition—use and indications,
p78; Urinalysis, p166; Crystalloids, p176; Diuretics, p212; Tachyarrhythmias, p316; Bradyarrhythmias, p318; Acute
renal failure—diagnosis, p332; Acute renal failure—management, p334; Vomiting/gastric stasis, p338; Diarrhoea,
p340; Acute liver failure, p360; Hypernatraemia, p416; Hyponatraemia, p418; Hyperkalaemia, p420; Hypokalaemia,
p422; Metabolic acidosis, p434; Metabolic alkalosis, p436; Diabetic ketoacidosis, p442; Hyperosmolar diabetic
emergencies, p444; Hypoadrenal crisis, p448; Poisoning—general principles, p452; Rhabdomyolysis, p528
Calcium, magnesium and phosphate
Calcium
Plasma calcium levels have been traditionally corrected to plasma albumin levels; this is now considered irrelevant,
particularly at the low albumin levels seen in critically ill patients. Measurement of the ionised fraction is now
considered more pertinent since it is the ionised fraction that is responsible for the extracellular actions of calcium,
with changes in the ionised fraction being responsible for the symptomatology.
High calcium levels occur with hyperparathyroidism, certain malignancies and sarcoidosis while low levels are seen in
renal failure, severe pancreatitis and hypoparathyroidism.
Magnesium
Plasma levels poorly reflect intracellular or whole body stores, 65% of which is in bone and 35% in cells. The ionised
fraction is approximately 50% of the total level.
High magnesium levels are seen with renal failure and excessive administration; this rarely requires treatment unless
serious cardiac conduction problems or neurological complications (respiratory paralysis, coma) intervene.
Low levels occur following severe diarrhoea, diuretic therapy, alcohol abuse, and accompany hypocalcaemia.
Magnesium is used therapeutically for a number of conditions including ventricular and supraventricular arrhythmias,
eclampsia, seizures, asthma and after myocardial infarction. Supranormal plasma levels of 1.5–2.0mmol/l are often
sought.
Phosphate
High levels are seen with renal failure and in the presence of an ischaemic bowel. Low levels (sometimes
<0.1mmol/l) occur with critical illness, chronic alcoholism and diuretic usage and may possibly result in muscle
weakness, failure to wean and myocardial dysfunction.
Normal plasma ranges
Calcium 2.2–2.6mmol/l
Ionised calcium 1.05–1.2mmol/l
Magnesium 0.7–1.0mmol/l
Phosphate 0.7–1.4mmol/l
See also:
IPPV—assessment of weaning, p18; Plasma exchange, p68; Nutrition—use and indications, p78; Tachyarrhythmias,
p316; Pancreatitis, p354; Generalised seizures, p372; Hypomagnesaemia, p424; Hypercalcaemia, p426;
Hypocalcaemia, p428; Hypophosphataemia, p430; Pre-eclampsia and eclampsia, p538
Cardiac function tests
The importance of biochemical markers of myocardial necrosis has been emphasised by a consensus document from
the European Society of Cardiology and American College of Cardiology. The diagnosis of myocardial infarction was
redefined as a typical rise and fall in troponin, or a more rapid rise and fall in CK-MB, with at least one of the
following:
Ovid: Oxford Handbook of Critical Care file:///C:/Documents%20and%20Settings/MVP/Application%20Data/Mozilla/Firefox/Profiles/2
64 из 254 07.11.2006 1:04
P.151
Ischaemic symptoms
Development of pathological Q waves on ECG
ECG ST elevation or depression
Coronary intervention
Troponins
Troponins are bound to the actin filament within muscles and are involved in excitation–contraction coupling. Both
cardiac troponin T and troponin I are coded by specific genes and are immunologically distinct from those in skeletal
muscle. Neither is detectable in normal healthy individuals but both are released into the bloodstream from
cardiomyocytes damaged by necrosis, toxins and inflammation. They become detectable by 4–6h after myocardial
injury, peak at 14–18h, and persist for up to 12 days. Current assays are highly specific as they use recombinant
human cardiac tropinin T as a standard.
Due to their high sensitivity, plasma levels rise with other cardiac insults, e.g. tachycardia (SVT/VT), pericarditis,
myocarditis, sepsis, heart failure, severe exertion and pulmonary embolism. The degree of rise post-MI or during
critical illness correlates with a worse outcome.
A positive test is when the cardiac troponin T or I value exceeds the 99th percentile of values for a control group on
≥1 occasion during the first 24h after the index clinical event. For cardiac troponin T this is quoted as 0.05–0.1ng/ml
though many labs now consider values >0.03ng/ml as positive. Values for cardiac troponin I depend on the particular
assay used (usually >0.5–1.5ng/ml). The negative predictive value after an acute MI is probably strongest after 6h.
Sensitivity peaks at 12h but at the expense of a lower specificity. With renal dysfunction, higher levels are needed to
diagnose myocardial damage due to impaired excretion.
Cardiac enzymes
Creatine kinase (CK) is detectable in plasma within a few hours of myocardial injury. The cardiac-specific isoform
(CK-MB) can be measured if there is concurrent skeletal muscle injury. CK and aspartate aminotransferase (AST)
peak by 24h and fall over 2–3 days whereas the rise and subsequent fall in plasma lactate dehydrogenase takes 1–2
days longer.
Brain (or B-type) natriuretic peptide (BNP)
Cardiomyocytes produce and secrete cardiac natriuretic peptides. Plasma levels rise in a variety of conditions but
high levels are predominantly associated with heart failure, and increase in relation to severity. A sensitivity of
90–100% is claimed, whereas specificity is approximately 70–80%. Numerous commercial assays for B-type
natriuretic peptide (BNP) or proBNP are now available, each with their own diagnostic range. They are useful as a
screening tool for patients presenting with dyspnoea, for prognostication, and for titration of therapy. Levels rise in
the elderly, in renal failure, and in pulmonary diseases causing right ventricular overload (e.g. pulmonary embolus).
Figure. No Caption Available.
Key paper
Antman E et al. Myocardial infarction redefined—a consensus document of The Joint European Society of
Cardiology/American College of Cardiology committee for the redefinition of myocardial infarction. J Am Coll Cardiol
2000; 36:959–69
McCullough PA, et al. B-type natriuretic peptide and clinical judgment in emergency diagnosis of heart failure:
analysis from Breathing Not Properly (BNP) Multinational Study. Circulation 2002; 106:416–22
See also:
Ovid: Oxford Handbook of Critical Care file:///C:/Documents%20and%20Settings/MVP/Application%20Data/Mozilla/Firefox/Profiles/2
65 из 254 07.11.2006 1:04
P.152
P.153
Acute coronary syndrome (1), p320; Acute coronary syndrome (2), p322; Heart failure—assessment, p324
Liver function tests
Hepatic metabolism proceeds via Phase I enzymes (oxidation and phosphorylation) and then subsequently to Phase II
enzymes (glucuronidation, sulphation, acetylation). Phase I enzyme reactions involve cytochrome P450.
Markers of hepatic damage
Alanine aminotransferase (ALT)
Aspartate aminotransferase (AST)
Lactate dehydrogenase (LDH)
Patterns and ratios of various enzymes are variable and unreliable diagnostic indicators. Measurement of ALT alone is
usually sufficient. It is more liver-specific but less sensitive than AST and has a longer half-life.
AST is not liver-specific but is a sensitive indicator of hepatic damage. The plasma level is proportional to the degree
of hepatocellular damage. Low levels occur in extrahepatic obstruction and inactive cirrhosis.
LDH is insensitive and non-specific. Isoenzyme electrophoresis is needed to distinguish cardiac, erythrocyte, skeletal
muscle and liver injury.
Acute phase reactants such as C-reactive protein (CRP) are also produced by the liver. Levels increase during critical
illness and following hepatocellular injury.
Markers of cholestasis
Bilirubin
Alkaline phosphatase
Gamma-glutamyl transferase (γ-GT)
Bilirubin is derived from Hb released from erythrocyte breakdown and conjugated with glucuronide by the
hepatocytes. The conjugated fraction is water-soluble whereas the unconjugated fraction is lipid-soluble. Levels are
increased with intra- and extrahepatic biliary obstruction (predominantly conjugated), hepatocellular damage and
haemolysis (usually mixed picture). Jaundice is detected when levels >45µmol/l.
Alkaline phosphatase is released from bone, liver, intestine and placenta. In the absence of bone disease (check Ca
2+
and PO
4
3-
) and pregnancy, raised levels usually indicate biliary tract dysfunction.
A raised γ-GT is a highly sensitive marker of hepatobiliary disease. Increased synthesis is induced by obstructive
cholestasis, alcohol, various drugs and toxins, acute and chronic hepatic inflammation.
Markers of reduced synthetic function
Albumin
Clotting factors
Cholinesterase
Albumin levels fall during critical illness due to protein catabolism, capillary leak, decreased synthesis, dilution with
artificial colloids.
Coagulation factors II, VII, IX and X are liver-synthesised. Over 33% of functional hepatic mass must be lost before
any abnormality is seen.
Indicators of function
Lidocaine metabolites (MegX)
Indicators of hepatic blood flow
Indocyanine green clearance
Bromosulphthalein clearance
Normal plasma ranges
Ovid: Oxford Handbook of Critical Care file:///C:/Documents%20and%20Settings/MVP/Application%20Data/Mozilla/Firefox/Profiles/2
66 из 254 07.11.2006 1:04
P.154
Albumin 35–53g/l
Bilirubin 3–17µmol/l
Conjugated bilirubin 0–6µmol/l
Alanine aminotransferase 5–50U/l
Alkaline phosphatase 100–280U/l
Aspartate aminotransferase 11–55U/l
Cholinesterase 2.3–9.0KU/l
γ-glutamyl-transferase 5–37U/l
Lactate dehydrogenase 230–460U/l
See also:
Parenteral nutrition, p82; Jaundice, p358; Acute liver failure, p360; Chronic liver failure, p364; Paracetamol
poisoning, p456; HELLP syndrome, p540
Full blood count
Haemoglobin
A raised haemoglobin occurs in polycythaemia (primary and secondary to chronic hypoxaemia) and in
haemoconcentration. Anaemia may be due to reduced red cell mass (decreased red cell production or survival) or
haemodilution. The latter is common in critically ill patients. In severe anaemia there may be a hyperdynamic
circulation which, if severe, may decompensate to cardiac failure. In this case, blood transfusion must be performed
with extreme care to avoid fluid overload, or in association with plasmapheresis. Differential diagnosis of anaemia
includes:
Reduced MCV
Iron deficiency (anisocytosis and poikilocytosis)
Raised MCV
Vitamin B
12
or folate deficiency
Alcohol excess
Liver disease
Hypothyroidism
Normal MCV
Anaemia of chronic disease
Bone marrow failure (e.g. acute folate deficiency)
Hypothyroidism
Haemolysis (increased reticulocytes and bilirubin)
White blood cells
A raised white cell count is extremely common in critical illness. Causes of changes in the differential count include:
Ovid: Oxford Handbook of Critical Care file:///C:/Documents%20and%20Settings/MVP/Application%20Data/Mozilla/Firefox/Profiles/2
67 из 254 07.11.2006 1:04
P.155
Neutrophilia Lymphocytosis Eosinophilia
Bacterial infection Brucellosis Asthma
Trauma and surgery Typhoid Allergic conditions
Burns Myasthenia gravis Parasitaemia
Haemorrhage Hyperthyroidism
Inflammation Leukaemia
Steroid therapy
Leukaemia
Neutropenia Lymphopenia
Viral infections Steroid therapy
Brucellosis SLE
Typhoid Legionnaire's disease
Tuberculosis AIDS
Sulphonamide treatment
Severe sepsis
Hypersplenism
Bone marrow failure
Barrier nursing may be used for neutropenia <1.0 ×10
9
/l.
Platelets
Correct interpretation of platelet counts requires blood to be taken by a venepuncture. Arterial blood is commonly
taken from an indwelling cannula but is not ideal. Thrombocytopenia is due to decreased platelet production (bone
marrow failure, vitamin B
12
or folate deficiency), decreased platelet survival (ITP, TTP, infection, hypersplenism,
heparin therapy), increased platelet consumption (haemorrhage, DIC) or in vivo aggregation giving an apparent
thrombocytopenia; this should be checked on a blood film. Spontaneous bleeding is associated with platelet counts
<20 ×10
9
/l and platelet cover is required for procedures or traumatic bleeds at counts <50 ×10
9
/l.
Normal ranges
Ovid: Oxford Handbook of Critical Care file:///C:/Documents%20and%20Settings/MVP/Application%20Data/Mozilla/Firefox/Profiles/2
68 из 254 07.11.2006 1:04
P.156
Haemoglobin 13–17g/dl (men), 12–16g/dl (women)
MCV 76–96fl
White cell count
4–11 ×10
9
/l
Neutrophils
2–7.5 ×10
9
/l
Lymphocytes
1.3–3.5 ×10
9
/l
Eosinophils
0.04–0.44 ×10
9
/l
Basophils
0–0.1 ×10
9
/l
Monocytes
0.2–0.8 ×10
9
/l
Platelets
150–400 ×10
9
/l
See also:
Blood transfusion, p182; Blood products, p252; Haemothorax, p302; Haemoptysis, p304; Upper gastrointestinal
haemorrhage, p344; Bleeding varices, p346; Lower intestinal bleeding and colitis, p348; Bleeding disorders, p396;
Anaemia, p400; Sickle cell disease, p402; Haemolysis, p404; Platelet disorders, p406; Neutropenia, p408;
Leukaemia, p410; Malaria, p490; Vasculitides, p494; Multiple trauma (1), p500; Multiple trauma (2), p502;
Burns—fluid management, p510; Post-partum haemorrhage, p542
Coagulation monitoring
Basic coagulation screen
The basic screen consists of a platelet count, prothrombin time, activated partial thromboplastin time and thrombin
time. Close attention to blood sampling technique is very important for correct interpretation of coagulation tests.
Drawing blood from indwelling catheters should, ideally, be avoided since samples may be diluted or contaminated
with heparin. The correct volume of blood must be placed in the sample tube to avoid dilution errors. Laboratory
coagulation tests are usually performed on citrated plasma samples taken into glass tubes.
Specific coagulation tests
Activated clotting time (ACT)
Sample tube contains celite, a diatomaceous earth, which activates the contact system; thus the ACT predominantly
tests the intrinsic pathway. The ACT is prolonged by heparin therapy, thrombocytopenia, hypothermia, haemodilution,
fibrinolysis and high dose aprotinin. Normal is 100–140s.
Thrombin time (TT)
Sample tube contains lyophilised thrombin and calcium. Thrombin bypasses the intrinsic and extrinsic pathways such
that the coagulation time tests the common pathway with conversion of fibrinogen to fibrin. The TT is prolonged by
fibrinogen depletion, e.g. fibrinolysis or thrombolysis, and heparin via antithrombin III dependent interaction with
thrombin. A high dose TT is more sensitive to heparin anticoagulation than fibrinogen levels. Normal range is 12–16s.
Prothrombin time (PT)
Sample tube contains tissue factor and calcium. Tissue factor activates the extrinsic pathway. The PT is prolonged
with coumarin anticoagulants, liver disease and vitamin K deficiency. Normal range is 12–16s. The International
Normalised Ratio (INR) relates PT to control and is normally 1.
Activated partial thromboplastin time (APTT)
Sample tube contains kaolin and cephalin as a platelet substitute to activate the intrinsic pathway. The APTT is
prolonged by heparin therapy, DIC, severe fibrinolysis, von Willebrand factor, factor VIII, factor X1 or factor XIII
deficiencies. Normal range is 30–40s.
D-dimers and fibrin degradation products (FDPs)
Fibrin fragments are released by plasmin lysis. FDPs can be assayed by an immunological method; they are often
measured in the critically ill to confirm disseminated intravascular coagulation. A level of 20–40µg/ml is common
Ovid: Oxford Handbook of Critical Care file:///C:/Documents%20and%20Settings/MVP/Application%20Data/Mozilla/Firefox/Profiles/2
69 из 254 07.11.2006 1:04
P.157
P.158
post-operatively, in sepsis, trauma, renal failure and DVT. Raised levels do not distinguish fibrinogenolysis and
fibrinolysis. Assay of the d-dimer fragment is more specific for fibrinolysis, e.g. in DIC, since it is only released after
fibrin is formed.
Coagulation factor assays
Assays are available for all coagulation factors and may be used for diagnosis of specific defects. As heparins inhibit
factor Xa activity, the factor Xa assay is therefore the most specific method of controlling low molecular weight
heparin therapy. Since this assay is not dependent on contact system activation, it also avoids the effects of
aprotinin when monitoring heparin therapy.
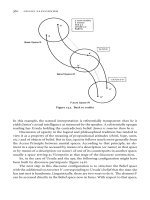
The coagulation cascade – new concept
Figure. No Caption Available.
The traditional coagulation cascade consisting of extrinsic, intrinsic and common pathways is now considered
outmoded, inconsistent with clinical observations, and inadequate to explain the pathways leading to haemostasis in
vivo. This schema has been replaced recently by a cell-based model with the major initiating haemostasis event in
vivo being the action of factor VIIa and tissue factor (TF) at the site of injury.
See also:
Haemo(dia)filtration (1), p62; Haemo(dia)filtration (2), p64; Anticoagulants, p248; Thrombolytics, p250; Blood
products, p252; Coagulants and antifibrinolytics, p254; Aprotinin, p256; Haemothorax, p302; Haemoptysis, p304;
Acute coronary syndrome (1), p320; Acute coronary syndrome (2), p322; Upper gastrointestinal haemorrhage, p344;
Bleeding varices, p346; Lower intestinal bleeding and colitis, p348; Acute liver failure, p360; Bleeding disorders,
p396; Clotting disorders, p398; Platelet disorders, p406; Paracetamol poisoning, p456; Post-operative intensive care,
p534; HELLP syndrome, p540
Bacteriology
Microbiology samples should, if possible, be taken prior to commencement of antimicrobial therapy. In severe
infections, broad spectrum antimicrobials should be started without awaiting results. Sampling sites include those
suspected clinically of harbouring infection or, if a specific site cannot be identified clinically, blood, urine and
sputum samples. In severe infection, indwelling intravascular catheters should be replaced and the catheter tips sent
for culture. Samples should be sent to the laboratory promptly to allow early incubation and to prevent potentially
misleading growth. Swabs must be sent in the appropriate transport media.
Blood cultures
In order to avoid skin contamination, the skin should be cleaned with alcohol and allowed to dry thoroughly before
venepuncture. A 5–20ml blood sample is withdrawn and divided into anaerobic and aerobic culture bottles. In
addition, cultures should be taken through indwelling intravascular catheters if catheter-related sepsis is suspected.
All samples must be clearly labelled. Culture bottles are incubated and examined frequently for bacterial growth.
Positive cultures must be interpreted in light of the clinical picture; an early pure growth from multiple bottles is
likely to be significant, although cultures from critically ill patients may appear later or not at all due to antibiotic
therapy. Any Gram negative isolates or Staph. aureus are usually taken as significant.
Urine
Catheter specimens are usually obtained from the critically ill. The sampling site should be prepared aseptically prior
to sampling. The specimen should be sent to the laboratory immediately and examined microscopically for organisms,
casts and crystals. Urine is plated onto culture medium with a calibrated loop and incubated for 18–24h prior to
examination. Bacteria >10
8
/l (or a pure growth of 10
5
/l) represent a significant growth. All catheter specimens show
bacterial growth if the catheter has been in place for >2days. Isolation of the same organism from blood confirms a
significant culture.
Ovid: Oxford Handbook of Critical Care file:///C:/Documents%20and%20Settings/MVP/Application%20Data/Mozilla/Firefox/Profiles/2
70 из 254 07.11.2006 1:04
P.159
P.160
Sputum
Sputum samples are easily contaminated during collection, particularly specimens from non-intubated patients.
Suction specimens from intubated patients can be taken via a sterile suction catheter, protected catheter brush or
from specific lung segments via a bronchoscope. Gram negative bacteria are frequently isolated from tracheal
aspirates of intubated patients; only deep suction specimens are significant. Blood cultures should accompany sputum
specimens in the diagnosis of pneumonia. Samples should be sent to the laboratory immediately.
Pus samples and wound swabs
Aspirated pus must be sent to the laboratory immediately or a swab sample may be taken and sent in transport
medium. Pus is preferable for bacterial isolation.
Typical ICU-acquired nosocomial infections
Pneumonia due to Pseudomonas aeruginosa, Staph. aureus, Klebsiella spp., Enterobacter spp.
Urinary infection with E. coli, Ps. aeruginosa, Klebsiella spp., Proteus spp.
Catheter related sepsis—Staph. aureus, coagulase negative staphylococci
See also:
Pleural aspiration, p44; Fibreoptic bronchoscopy, p46; Chest physiotherapy, p48; Virology, serology and assays,
p160; Urinalysis, p166; Antimicrobials, p260; Atelectasis and pulmonary collapse, p284; Acute chest infection (1),
p288; Acute chest infection (2), p290; Abdominal sepsis, p350; Pancreatitis, p354; Meningitis, p374; Tetanus, p390;
Neutropenia, p408; Infection—diagnosis, p480; Infection—treatment, p482; Sepsis and septic shock—treatment,
p486; HIV related disease, p488; Malaria, p490; Burns—general management, p512; Pyrexia (1), p518; Pyrexia (2),
p520
Virology, serology and assays
Antibiotic assays
Antibiotic assays are usually performed for drugs with a narrow therapeutic range, such as aminoglycosides and
vancomycin. It is not usual to request an assay on day 1 of treatment. Thereafter, samples are taken daily prior to
giving a dose and at 1h after an intravenous injection or infusion.
Serology
A clotted blood specimen allows antibodies to viral and atypical antigens to be assayed. It is usual to send acute and
convalescent (14 days) serum to determine rising antibody titres. Single sample titres may be used to determine
previous exposure and carrier status.
Hepatitis B
Serology includes hepatitis B surface antigen as a screening test and hepatitis B core antigen to determine
infectivity. There is a 10% carrier rate in South East Asians. Serology should be sent in all high risk patients, e.g.
jaundice, IV drug abuse, homosexuals, prostitutes, those with tattoos or unexplained hepatic enzyme abnormalities.
In addition, hepatitis B status should be known in staff who suffer accidental exposure to body fluids, e.g. through
needlestick injury. Those who are not immune may be treated with immunoglobulin.
HIV
Since HIV positive status carries consequences for lifestyle and insurance, it should rarely be assessed without prior
counselling and consent. The CD4 count may be used to assess the likelihood of symtomatology being AIDS-related,
although this will fall further with acute critical illness; again, consent should usually be sought pre-testing. High risk
patients should be considered for testing, e.g. homosexual males, intravenous drug abusers, haemophiliacs, Central
African origin. In critically ill patients such consent can rarely be obtained and unconsented testing may be used
where management may change significantly with knowledge of the HIV status, or where organ donation is being
considered. Most AIDS-related infections can be adequately treated without knowledge of the HIV status. Patients or
staff who are recipients of a needlestick injury can be treated with antiretroviral therapies if risk is high.
Viral culture
Most commonly used for CMV. Samples of blood, urine or bronchial aspirate may be sent for DEAFF (detection of early
antigen fluorescent foci). Herpes virus infections may be detected by electron microscopy of samples (including
pustule fluid) and adenovirus in immunosuppressed patients with a chest infection.
Fungi
Candida and Aspergillus can be assessed by culture ± antigen tests. Cryptococcus can be detected by Indian ink stain
in biopsy samples.
Other tests
Ovid: Oxford Handbook of Critical Care file:///C:/Documents%20and%20Settings/MVP/Application%20Data/Mozilla/Firefox/Profiles/2
71 из 254 07.11.2006 1:04
P.161
P.162
P.163
Other tests available to make microbiological diagnoses include antigen testing for certain bacteria (e.g.
pneumococcus), and PCR (polymerase chain reaction) which amplifies the microbial DNA. PCR is an extremely
sensitive test for specific organisms. However, it is prone to environmental contamination (e.g. from airborne spores)
and it cannot distinguish between colonisation and infection.
Common serology for critically ill patients
Hepatitis A
Hepatitis B
Hepatitis C
HIV
CMV
Mycoplasma pneumoniae
Legionella pneumophila
Antibiotic therapeutic levels
Trough (mg/l) Peak (mg/l)
Amikacin <8 30
Gentamicin <2 4–10*
Tobramycin <2 4–10
Vancomycin <8 20–30
*Seek microbiological advice if once daily gentamicin is used
See also:
Bacteriology, p158; Urinalysis, p166; Antimicrobials, p260; Acute chest infection (1), p288; Acute chest infection (2),
p290; Jaundice, p358; Acute liver failure, p360; Tetanus, p390; Botulism, p392; HIV related disease, p488; Pyrexia
(1), p518; Pyrexia (2), p520
Toxicology
Purpose
Samples taken from blood, urine, vomitus or gastric lavage (depending on drug or poison ingested) for:
Monitoring of therapeutic drug levels (usually plasma) and avoidance of toxicity, e.g. digoxin, aminoglycosides,
lithium, phenytoin
Identification of unknown toxic substances (e.g. cyanide, amphetamines, opiates) causing symptomatology
and/or pathology. Always take a urine sample for analysis.
Confirmation of toxic plasma levels and monitoring of treatment effect, e.g. paracetamol, aspirin
Medicolegal, e.g. alcohol, recreational drugs following road trauma
Samples
Confirm with chemistry laboratory ± local poisons unit as to which, how, and when body fluid samples should be
taken for analysis, e.g. peak/trough levels for aminoglycosides, urine samples for out-of-hospital poisoning, repeat
paracetamol levels to monitor efficacy of treatment
See also:
Virology, serology and assays, p160; Poisoning—general principles, p45
Ovid: Oxford Handbook of Critical Care
Editors: Singer, Mervyn; Webb, Andrew R.
Title: Oxford Handbook of Critical Care, 2nd Edition
Ovid: Oxford Handbook of Critical Care file:///C:/Documents%20and%20Settings/MVP/Application%20Data/Mozilla/Firefox/Profiles/2
72 из 254 07.11.2006 1:04
P.167
Copyright ©1997,2005 M. Singer and A. R. Webb, 1997, 2005. Published in the United States by Oxford University
Press Inc
> Table of Contents > Miscellaneous Monitoring
Miscellaneous Monitoring
Urinalysis
Techniques
Biochemical/metabolic:
colorimetric ‘dipsticks’ read manually from reference chart or by automated machine within 15s—2min of
dipping in urine (see manufacturer's instructions). Usually performed at the bedside.
i.
sodium and potassium levels can be measured in most analysers used for plasma electrolyte measurement.
Recalibration of the machine or special dilution techniques may be required.
ii.
laboratory analysisiii.
Haematological—either by dipstick or laboratory testing
Microbiological—microscopy, culture, sensitivity; antigen tests
Renal disease—usually by microscopy + laboratory testing
Associated tests
Some of the above investigations are performed in conjunction with a blood test, e.g. urine:plasma ratios of urea,
creatinine and osmolality to distinguish renal from pre-renal causes of oliguria, 24h urine collection plus plasma
creatinine for creatinine clearance estimation.
Cautions
White blood cells, proteinuria and mixed bacterial growths are routine findings in catheterised patients and do
not necessarily indicate infection.
A ‘positive’ dipstick test for blood does not differentiate between haematuria, haemoglobinuria or myoglobinuria.
Only conjugated bilirubin is excreted into the urine.
Urinary sodium and potassium levels are increased by diuretic usage.
Urinalysis tests
Ovid: Oxford Handbook of Critical Care file:///C:/Documents%20and%20Settings/MVP/Application%20Data/Mozilla/Firefox/Profiles/2
73 из 254 07.11.2006 1:04
P.168
Biochemical/metabolic:
pH dipstick
glucose dipstick
ketones dipstick
protein dipstick, laboratory
bilirubin dipstick
sodium, potassium electrolyte analyser, laboratory
urea, creatinine, nitrogen laboratory
osmolality laboratory
specific gravity bedside gravimeter, laboratory
myoglobin laboratory, positive dipstick to blood
drugs, poisons sent to Poisons Reference Laboratory
Haematological:
red blood cells microscopy, positive dipstick to blood
haemoglobin laboratory, positive dipstick to blood
neutrophils dipstick, laboratory
Microbiological:
bacteriuria microscopy, culture
TB microscopy, culture (early morning specimens)
Legionnaire's disease laboratory
Nephro-urological:
haematuria microscopy
granular casts microscopy
protein laboratory
sodium, potassium electrolyte analyser, laboratory
malignant cells cytology
See also:
Nutrition—use and indications, p78; Bacteriology, p158; Virology, serology and assays, p160; Acute renal
failure—diagnosis, p332; Hypernatraemia, p416; Hyponatraemia, p418; Hyperkalaemia, p420; Hypokalaemia, p422;
Diabetic ketoacidosis, p442; Poisoning—general principles, p452; Infection—diagnosis, p480; Rhabdomyolysis, p528
Ovid: Oxford Handbook of Critical Care file:///C:/Documents%20and%20Settings/MVP/Application%20Data/Mozilla/Firefox/Profiles/2
74 из 254 07.11.2006 1:04
P.169
Indirect calorimetry
Calorimetry refers to the measurement of energy production. Direct calorimetry is the measurement of heat
production in a sealed chamber but is impractical for critically ill patients. Indirect calorimetry measures the rate of
oxidation of metabolic fuels by detecting the volume of O
2
consumed and CO
2
produced. The ratio of CO
2
production
to O
2
utilisation (respiratory quotient or RQ) defines which fuels are being utilised (see table). Knowledge of the
oxygen utilisation by the various fuels allows the calculation of energy production. Carbohydrate and fat are oxidised
to CO2 and water producing 15–17 and 38–39kJ/g respectively. Protein is oxidised to CO2, water and nitrogen
(subsequently excreted as urea) producing 15–17kJ/g.
Technique of indirect calorimetry
Inspiratory and mixed expiratory gases must be sampled. O
2
concentration may be measured by a fuel cell sensor or
a fast response, paramagnetic sensor. CO
2
is usually measured by infrared absorption. Sensors may be calibrated
with reference to known concentrations of standard gas or by burning a pure fuel with a predictable O
2
consumption.
Measurements are usually made at ambient temperature, pressure and humidity prior to conversion to standard
temperature, pressure and humidity. In order to calculate metabolic rate (energy expenditure) inspired and expired
minute volumes are required. It is common for one minute volume to be measured and the other derived from a
Haldane transformation:
The nitrogen concentrations are assumed to be the concentration of gas which is not O
2
or CO
2
. Calculation of energy
expenditure utilises a modification of the de Weir formula Energy expenditure = (3.94 VO
2
+ 1.11 VCO
2
) × 1.44
Although it is possible to calculate the rate of protein metabolism by reference to the urinary urea concentration, and
therefore to separate non-protein from protein energy expenditure, the resulting modification of the above formula is
not usually clinically significant.
Errors associated with indirect calorimetry
Underestimate VCO
2
H
+
ion loss, haemodialysis, haemofiltration
Overestimate VCO
2
hyperventilation, HCO3
-
infusion
Underestimate VO
2
free radical production, unmeasured O
2
supply
FIO
2
> 0.6 small difference between inspired and expired O
2
Loss of volume circuit leaks, bronchopleural fistula
Use of indirect calorimetry
Helps to match nutritional intake to energy expenditure. It is important to feed critically ill patients appropriately,
avoiding both underfeeding and overfeeding (see table). Indirect calorimetry may also be used to assess the work of
breathing by assessing the change in VO
2
during weaning from mechanical ventilation. The VO
2
change may also be
used to assess appropriate levels of sedation and analgesia.
Respiratory quotients for various metabolic fuels
Ketones 0.63
Fat 0.71
Protein 0.80
Carbohydrate 1.00
The whole body RQ depends on the fuel or combination of fuels being utilised. Normally a combination of fat and
carbohydrate are utilised with a RQ of 0.8.
Lipogenesis associated with both sepsis and overfeeding may give a RQ of 1.1–1.3
See also:
IPPV—assessment of weaning, p18; Nutrition—use and indications, p78; Enteral nutrition, p80; Parenteral nutrition,
Ovid: Oxford Handbook of Critical Care file:///C:/Documents%20and%20Settings/MVP/Application%20Data/Mozilla/Firefox/Profiles/2
75 из 254 07.11.2006 1:04
P.170
P.171
P.172
p82; CO
2
monitoring, p92; Cardiac output—other invasive, p124; Opioid analgesics, p234; Non-opioid analgesics,
p236; Sedatives, p238; Pyrexia (1), p518; Pyrexia (2), p520; Pain, p532
Lactate
Measurement of blood lactate
Analysers are available to allow rapid measurement of blood or plasma lactate on small samples, using enzyme-based
methods. The enzymatic conversion of lactate to pyruvate is an oxygen utilising reaction. The extraction of oxygen
from the sample can be detected by a sensitive oxygen fuel cell sensor and is directly proportional to the sample
lactate concentration. A whole blood sample (venous or arterial since there is no practical difference) is collected into
a heparin fluoride tube to prevent coagulation and glycolysis (lactate producing). Nitrite may be used in the sample
tube to convert haemoglobin to the met form, thus avoiding uptake of oxygen during the enzyme reaction. The
enzymatic method is specific for the L-isomer and will not, therefore, detect D-lactate (e.g. in short bowel
syndrome). Normal arterial whole blood lactate concentration is <1.5mmol/l. Lactate may also be measured from
regional sites as an aid to the assessment of regional perfusion (e.g. arterial–jugular bulb difference).
Biochemistry of lactate production
Pyruvate is the end product of glycolysis. Most is then metabolised by pyruvate dehydrogenase to acetyl CoA, the
major substrate for the Krebs cycle. However, in conditions of mitochondrial dysfunction (e.g. cellular hypoxia,
sepsis) more pyruvate is converted to lactate by lactate dehydrogenase.
Lactate is a buffer not an acid so a high blood lactate is not, therefore, synonymous with lactic acidosis. In
continuous haemofiltration the replacement fluid is usually buffered with lactate at 35–45mmol/l; thus blood lactate
levels will rise without acidosis.
Causes of lactic acidosis
Lactic acidosis occurs when production of lactic acid is in excess of removal. The major sources are skeletal muscle,
brain and red blood cells. Removal is mainly by metabolism to glucose in the liver and kidney. Hepatic removal is
impaired by poor perfusion and acidosis. Lactic acidosis is traditionally classified as type A or type B. Type A refers
to excess production when tissue oxygenation is inadequate. Type B occurs where there is no systemic tissue
hypoxia. Epinephrine therapy may cause accelerated aerobic glycolysis and pyruvate production in excess of
mitochondrial needs; this may produce an increasing metabolic acidosis often out of proportion to the patient's
clinical status. In sepsis, hyperlact ataemia is mainly due to increased muscle Na
+
K
+
-ATPase activity. Treatment of
metabolic acidosis with sodium bicarbonate solution may increase lactate production. A severe and persistent type A
lactic acidosis is associated with a poor outcome.
Identifying type A lactic acidosis
Evidence of poor tissue perfusion may be obvious clinically. Calculation of arterial DO
2
may confirm inadequate tissue
oxygen delivery but a normal DO
2
does not guarantee adequacy of supply.
Key trial
Totaro RJ, Raper RF. Epinephrine-induced lactic acidosis following cardiopulmonary bypass. Crit Care Med 1997;
25:1693–9
See also:
Haemo(dia)filtration (1), p62; Haemo(dia)filtration (2), p64; Blood gas analysis, p100; Arterial cannulation, p112;
Other neurological monitoring, p140; Metabolic acidosis, p434; Systemic inflammation/multiorgan failure, p484
Colloid osmotic pressure
Colloid osmotic pressure (COP) is the pressure required to prevent net fluid movement between two solutions
separated by a selectively permeable membrane when one contains a greater colloid concentration than the other.
The selectively permeable membrane should impede the passage of colloid molecules but not small ions and water.
COP is determined by number of molecules rather than type. However, most solutions exhibit non-ideal behaviour due
to intermolecular interactions and electrostatic effects. Hence COP cannot be inferred from plasma protein
concentrations; it must be measured.
Measurement of COP
In a membrane oncometer the plasma sample is separated from a reference 0.9% saline solution by a membrane with
a molecular weight exclusion between 10,000 and 30,000Da. The reference solution is in a closed chamber containing
a pressure transducer. Saline will pass to the sample chamber by colloid osmosis creating a negative pressure in the
reference chamber. When the negative pressure prevents any further flow across the membrane, it is equal to the
COP of the sample. Normal plasma COP is 25–30mmHg.
Clinical use of COP measurement
Assessing significance of reduced plasma proteins
Ovid: Oxford Handbook of Critical Care file:///C:/Documents%20and%20Settings/MVP/Application%20Data/Mozilla/Firefox/Profiles/2
76 из 254 07.11.2006 1:04
P.173
Plasma albumin levels are almost invariably reduced in critically ill patients. Causes include interstitial leakage,
failed synthesis and increased metabolism. However, the same group of patients often have raised levels of acute
phase proteins which contribute to COP. Since there is no evidence that correction of plasma albumin levels is
beneficial, many clinicians correct plasma volume deficit with artificial colloid. These will contribute to COP while
also reducing hepatic albumin synthesis. If COP is maintained >20mmHg it is likely that reduced plasma albumin
levels are of no significance.
Avoiding pulmonary oedema
It has been suggested that a difference between COP and pulmonary artery wedge pressure >6mmHg minimises the
risk of pulmonary oedema. However, in the face of severe capillary leak it is unlikely that pulmonary oedema can be
avoided if plasma volumes are to be maintained compatible with circulatory adequacy. Conversely, a normal COP
would not necessarily prevent pulmonary oedema in severe capillary leak; the contribution of COP to fluid dynamics
in this situation is much reduced.
Selection of appropriate fluid therapy
It is difficult not to support the use of colloid fluids in hypo-oncotic patients. In patients with renal failure the
repeated use of colloid fluid may lead to a hyperoncotic state. This is associated with tissue dehydration and failure
of glomerular filtration (thus prolonging the renal failure). Measurement of a high COP in patients who have been
treated with artificial colloids should direct the use of crystalloid fluids. It is important to note that excessive
diuresis may also lead to a hyper-oncotic state for which crystalloid replacement may be necessary.
See also:
Haemo(dia)filtration (1), p62; Haemo(dia)filtration (2), p64; Liver function tests, p152; Fluid challenge, p274
Ovid: Oxford Handbook of Critical Care
Editors: Singer, Mervyn; Webb, Andrew R.
Title: Oxford Handbook of Critical Care, 2nd Edition
Copyright ©1997,2005 M. Singer and A. R. Webb, 1997, 2005. Published in the United States by Oxford University
Press Inc
> Table of Contents > Fluids
Fluids
Crystalloids
Types
Saline: e.g. 0.9% saline, Ringer's lactate, Hartmann's solution, 0.18% saline in 4% glucose
Glucose: e.g. 5%, 10%, 20%, 50%
Sodium bicarbonate: e.g. 1.26%, 8.4%
Uses
Crystalloid fluids – to provide the daily requirements of water and electrolytes. They should be given to critically
ill patients as a continuous background infusion to supplement fluids given during feeding, or to carry drugs.
Higher concentration glucose infusions – to prevent hypoglycaemia.
Potassium chloride – to supplement crystalloid fluids.
Sodium bicarbonate – for correction of metabolic acidosis, urinary alkalinisation, etc
Routes
IV
Notes
A significant plasma volume deficit should be replaced with colloid solutions since crystalloids are rapidly lost from
the plasma, particularly during periods of increased capillary leak, e.g. sepsis. As most plasma substitutes are
carried in saline solutions, any additional 0.9% saline crystalloid infusion is only needed to replace excess sodium
losses.
The sodium content of 0.9% saline is equivalent to that of extracellular fluid. A daily requirement of 70–80mmol
sodium is normal although there may be excess loss in sweat and from the gastrointestinal tract.
Ringer's lactate or Hartmann's solution have no practical advantage over 0.9% saline for fluid maintenance. They