a textbook of modern toxicology phần 3 ppt
Bạn đang xem bản rút gọn của tài liệu. Xem và tải ngay bản đầy đủ của tài liệu tại đây (843.62 KB, 58 trang )
ROUTES OF ABSORPTION 93
The intercellular pathway is now accepted as the major pathway for absorption.
Recall that the rate of penetration is often correlated with the partition coefficient. In
fact this is a very tortuous pathway, and the h (skin thickness) in Fick’s first law
of diffusion is really 10× the measured distance. By placing a solvent (e.g., ether,
acetone) on the surface or tape stripping the surface, the stratum corneum (SC) is
removed, and absorption can be significantly increased by removing this outer barrier.
This may not be the case for very lipophilic chemical. This is because the viable
epidermis and dermis are regarded as aqueous layers compared to the SC. Note that
the more lipophilic the drug, the more likely it will form a depot in the SC and be
slowly absorbed over time and thus have a prolonged half-life.
The transcellular pathway has been discredited as a major pathway, although some
polar substances can penetrate the outer surface of the protein filaments of hydrated
stratum corneum. The transfollicular pathway is really an invagination of the epidermis
into the dermis, and the chemical still has to penetrate the epidermis to be absorbed
into the blood stream. This is also a regarded as minor route. Sweat pores are not
lined with the stratum corneum layer, but the holes are small, and this route is still
considered a minor route for chemical absorption. In general, the epidermal surface is
100 to 1000 times the surface area of skin appendages, and it is likely that only very
small and/or polar molecules penetrate the skin via these appendages.
Variations in areas of the body cause appreciable differences in penetration of tox-
icants. The rate of penetration is in the following order:
Scrotal > Forehead > Axilla >= Scalp > Back = Abdomen > Palm and plantar.
The palmar and plantar regions are highly cornified and are 100 to 400 times thicker
than other regions of the body. Note that there are differences in blood flow and to a
lesser extent, hair density, that may influence absorption of more polar toxicants.
Formulation additives used in topical drug or pesticide formulations can alter the
stratum corneum barrier. Surfactants are least likely to be absorbed, but they can
alter the lipid pathway by fluidization and delipidization of lipids, and proteins within
the keratinocytes can become denatured. This is mostly likely associated with for-
mulations containing anionic surfactants than non-ionic surfactants. Similar effects
can be observed with solvents. Solvents can partition into the intercellular lipids,
thereby changing membrane lipophilicity and barrier properties in the following order:
ether/acetone > DMSO > ethanol > water. Higher alcohols and oils do not damage
the skin, but they can act as a depot for lipophilic drugs on the skin surface. The
presence of water in several of these formulations can hydrate the skin. Skin occlu-
sion with fabric or transdermal patches, creams, and ointments can increase epidermal
hydration, which can increase permeability.
The reader should be aware of the animal model being used to estimate dermal
absorption of toxicants in humans. For many toxicants, direct extrapolation from a
rodent species to human is not feasible. This is because of differences in skin thickness,
hair density, lipid composition, and blood flow. Human skin is the least permeable
compared to skin from rats, mice, and rabbits. Pig skin is, however, more analogous
to human skin anatomically and physiologically, and pig skin is usually predictive of
dermal absorption of most drugs and pesticides in human skin. Human skin is the
best model, followed by skin from pigs, primates, and hairless guinea pigs, and then
rats, mice, and rabbits. In preliminary testing of a transdermal drug, if the drug does
94 ABSORPTION AND DISTRIBUTION OF TOXICANTS
not cross rabbit or mice skin, it is very unlikely that it will cross human skin. There
are several in vitro experimental techniques such as static diffusion (Franz) cells or
flow-through diffusion (Bronough) cells. There are several ex vivo methods including
the isolated perfused porcine skin flap (IPPSF), which with its intact microvasculature
makes this model unique. In vivo methods are the golden standard, but they are very
expensive, and there are human ethical and animal rights issues to be considered.
There are other factors that can influence dermal absorption, and these can include
environmental factors such as air flow, temperature, and humidity. Preexisting skin
disease and inflammation should also be considered. The topical dose this is usually
expressed in per unit surface area can vary, and relative absorption usually decreases
with increase in dose.
6.5.4 Respiratory Penetration
As observed with the GIT and skin, the respiratory tract can be regarded as an external
surface. However, the lungs, where gas/vapor absorption occurs, are preceded by pro-
tective structures (e.g., nose, mouth, pharynx, trachea, and bronchus), which can reduce
the toxicity of airborne substances, especially particles. There is little or no absorption
in these structures, and residual volume can occur in these sites. However, cells lining
the respiratory tract may absorb agents that can cause a toxicological response. The
absorption site, which is the alveoli-capillary membrane, is very thin (0.4–1.5 µm).
The membranes to cross from the alveolar air space to the blood will include: type I
cells to basement membrane to capillary endothelial cells (Figure 6.8). This short dis-
tance allows for rapid exchange of gases/vapors. The analogous absorption distance in
skin is 100 to 200 µm, and in GIT it is about 30 µm. There is also a large surface
area (50 times the area of skin) available for absorption as well as significant blood
flow, which makes it possible to achieve rapid adjustments in plasma concentration.
Respiratory Bronchiole
Alveolar Duct
Alveolar Sac
Alveolus
Atrium
Atrium
Pore
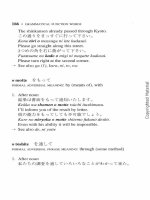
Figure 6.8 Schematic representation of the respiratory unit of the lung. (From Bloom and
Fawcett, in A Textbook of Histology, Philadelphia: Saunders, 1975.)
ROUTES OF ABSORPTION 95
Gases/vapors must get into solution in the thin fluid film in the alveoli for systemic
absorption to occur. For this reason doses are often a measurement of partial pressures,
which is important for gases/vapors.
The process of respiration involves the movement and exchange of air through
several interrelated passages, including the nose, mouth, pharynx, trachea, bronchi,
and successively smaller airways terminating in the alveoli, where gaseous exchange
occurs. These alveoli consist mainly of type I pneumocytes, which represent 40% of
all cells but cover > 90% of surface area, and type II pneumocytes, which represent
60% of all cells but cover 5% of surface area. Macrophages make up 90% of cells
in alveolar space. The amount of air retained in the lung despite maximum expiratory
effort is known as the residual volume. Thus toxicants in the respiratory air may not
be cleared immediately because of slow release from the residual volume. The rate
of entry of vapor-phase toxicants is controlled by the alveolar ventilation rate, with
the toxicant being presented to the alveoli in an interrupted fashion approximately
20 times/min.
Airborne toxicants can be simplified to two general types of compounds, namely
gases and aerosols. Compounds such as gases, solvents, and vapors are subject to gas
laws and are carried easily to alveolar air. Much of our understanding of xenobiotic
behavior is with anesthetics. Compounds such as aerosols, particulates, and fumes are
not subject to gas laws because they are in particulate form.
The transfer of gas from alveoli to blood is the actual absorption process. Among
the most important factors that determine rate and extent of absorption of a gas in
lungs is the solubility of that gas. Therefore it is not the membrane partition coefficient
that necessarily affects absorption as has been described for skin and GIT membranes,
but rather the blood: gas partition coefficient or blood/gas solubility of the gas. A high
blood: gas partition coefficient indicates that the blood can hold a large amount of gas.
Keep in mind that it is the partial pressure at equilibrium that is important, so the more
soluble the gas is in blood, the greater the amount of gas that is needed to dissolve in
the blood to raise the partial pressure or tension in blood. For example, anesthetics such
as diethyl ether and methoxyflurane, which are soluble (Table 6.3), require a longer
period for this partial pressure to be realized. Again, the aim is to generate the same
tension in blood as in inspired air. Because these gases are very soluble, detoxification
is a prolonged process. In practice, anesthetic induction is slower, and so is recovery
from anesthesia. For less soluble gases (e.g., NO, isoflurane, halothane), the partial
pressure or tension in blood can be raised a lot easier to that of inspired gases, and
detoxification takes less time than those gases that are more soluble.
There are several other important factors that can determine whether the gas will
be absorbed in blood and then transported from the blood to the perfused tissue. The
concentration of the gas in inspired air influences gas tension, and partial pressure
can be increased by overventilation. In gas anesthesiology we know that the effects of
Table 6.3 Blood: Gas Partition Coefficient in Humans
Agent Coefficient
Methoxyflurane 13.0–15.0
Halothane 2.3–2.5
Isoflurane 1.4
NO 0.5
96 ABSORPTION AND DISTRIBUTION OF TOXICANTS
respiratory rate on speed of induction are transient for gases that have low solubility
in blood and tissues, but there is a significant effect for agents that are more soluble
and take a longer time for gas tensions to equilibrate. In determining how much of the
gas is absorbed, its important to consider what fraction of the lung is ventilated and
what fraction is perfused. However, one should be aware that due to diseased lungs,
there can be differences between these fractions. For example, decreased perfusion will
decrease absorption, although there is agent in the alveoli, and vice versa. The rate
at which a gas passes into tissues is also dependent on gas solubility in the tissues,
rate of delivery of the gas to tissues, and partial pressures of gas in arterial blood and
tissues. After uptake of the gas, the blood takes the gas to other tissues. The mixed
venous blood returned to the lungs progressively begins to have more of the gas, and
differences between arterial (or alveolar) and mixed venous gas tensions decreases
continuously.
While gases are more likely to travel freely through the entire respiratory tract to
the alveoli, passage of aerosols and particles will be affected by the upper respiratory
tract, which can act as an effective filter to prevent particulate matter from reaching
the alveoli. Mucous traps particles to prevent entry to alveoli, and the mucociliary
apparatus in the trachea traps and pushes particles up the trachea to the esophagus
where they are swallowed and possibly absorbed in the GI tract.
In addition to upper pathway clearance, lung phagocytosis is very active in both
upper and lower pathways of the respiratory tract and may be coupled to the mucus
cilia. Phagocytes may also direct engulfed toxicants into the lymph, where the toxicants
may be stored for long periods. If not phagocytized, particles ≤1 µm may penetrate to
the alveolar portion of the lung. Some particles do not desequamate but instead form a
dust node in association with a developing network of reticular fibers. Overall, removal
Nose
Mouth
Pharynx
5 – 30 µm
Trachea
Bronchi
Bronchioli
1 – 5 µm
Alveoli
1 µm
Figure 6.9 Schematic illustration of the regions where absorption may occur in the respira-
tory tract.
TOXICANT DISTRIBUTION 97
of alveolar particles is markedly slower than that achieved by the directed upper pul-
monary mechanisms. This defense mechanism is not important for vapors/gases. The
efficiency of the system is illustrated by the fact that on average, only 100 g of coal dust
is found postmortem in the lungs of coal miners, although they inhale approximately
6000 g during their lifetime.
The deposition site of particles in the respiratory tract is primarily dependent on the
aerodynamic behavior of the particles. The particle size, density, shape, hygroscopicity,
breathing pattern, and lung airway structure are also important factors influencing the
deposition site and efficiency. The aerodynamic-equivalent diameter (for particle >
0.5 µm) and diffusion-equivalent diameter (< 0.5 µm) are defined as the diameter of
a unit density sphere having the same settling velocity (aerodynamic-equivalent) or the
same diffusion rate (diffusion-equivalent) as the irregularly shaped particle of interest.
Deposition occurs by five possible mechanisms: electrostatic precipitation, interception,
impaction, sedimentation, impaction, and diffusion. The latter three are most important.
Only particle sizes less than 10 to 20 µm that get pass the nasopharyngeal regions and
reach the alveoli are of medical concern. As particle size decreases below 0.5 µm, the
aerosol begins to behave like a gas (Figure 6.9). For these particles, diffusion becomes
the primary mechanism of deposition in the respiratory tract before it finally reaches
the alveoli.
6.6 TOXICANT DISTRIBUTION
6.6.1 Physicochemical Properties and Protein Binding
Absorption of toxicants into the blood needs to be high enough so that it will have
a significant effect at the site of action in other areas of the body. The distribution
process that takes the absorbed drug to other tissues is dependent on various physio-
logical factors and physicochemical properties of the drug. This process is therefore a
reversible movement of the toxicant between blood and tissues or between extracellular
and intracellular compartments. There are, however, several complicating factors that
can influence the distribution of a toxicant. For example, perfusion of tissues is an
important physiological process, as some organs are better perfused (e.g., heart, brain)
than others (e.g., fat). There can also be significant protein binding that affects deliv-
ery of drug to tissues. To further complicate the issue, elimination processes such as
excretion and biotransformation (discussed at a later time) is occurring simultaneously
to remove the toxicant from the blood as well as the target site.
There are several physiochemical properties of the toxicant that can influence its
distribution. These include lipid solubility, pKa, and molecular weight, all of which
were described earlier in this chapter (Section 6.4) and will not be described here. For
many toxicants, distribution from the blood to tissues is by simple diffusion down a
concentration gradient, and the absorption principles described earlier also apply here.
The concentration gradient will be influenced by the partition coefficient or rather
the ratio of toxicant concentrations in blood and tissue. Tissue mass and blood flow
will also have a significant effect on distribution. For example, a large muscle mass
can result in increased distribution to muscle, while limited blood flow to fat or bone
tissue can limit distribution. The ratio of blood flow to tissue mass is also a useful
indicator of how well the tissue is perfused. The well perfused tissues include liver,
98 ABSORPTION AND DISTRIBUTION OF TOXICANTS
kidney, and brain, and the low perfused tissues include fat and bone where there is
slow elimination from these tissues. Initial distribution to well-perfused tissues (e.g.,
heart, brain) occurs within the first few minutes, while delivery of drug to other tissues
(e.g., fat, skin) is slower.
If the affinity for the target tissue is high, then the chemical will accumulate or
form a depot. The advantage here is that if this is a drug, there is no need to load
up the central compartment to get to the active site. However, if the reservoir for the
drug has a large capacity and fills rapidly, it so alters the distribution of the drug that
larger quantities of the drug are required initially to provide a therapeutic effective
concentration at the target organ. If this is a toxicant, this may be an advantageous
feature as toxicant levels at the target site will be reduced. In general, lipid-insoluble
toxicants stay mainly in the plasma and interstitial fluids, while lipid-soluble toxicants
reach all compartments, and may accumulate in fat. There are numerous examples of
cellular reservoirs for toxicants and drugs to distribute. Tetracycline antibiotics have a
high affinity for calcium-rich tissues in the body. The bone can become a reservoir for
the slow release of chemicals such as lead, and effects may be chronic or there may be
acute toxicity if the toxicant is suddenly released or mobilized from these depots. The
antimalaria drug quinacrine accumulates due to reversible intracellular binding, and
the concentration in the liver can be several thousand times that of plasma. Another
antimalaria drug, chloroquine, has a high affinity for melanin, and this drug can be
taken up by tissues such as the retina, which is rich in melanin granules, and can cause
retinitis with a drug overdose. Lipophilic pesticides and toxicants (e.g., PCBs) and
lipid soluble gases can be expected to accumulate in high concentration in fat tissue.
There are unique anatomical barriers that can limit distribution of toxicants. A
classical example of such a unique barrier is the blood-brain barrier (BBB), which
can limit the distribution of toxicants into the CNS and cerebrospinal fluid. There are
three main processes or structures that keep drug or toxicant concentrations low in
this region: (1) The BBB, which consist of capillary endothelial tight junctions and
glial cells, surrounds the precapillaries, reduces filtration, and requires that the toxicant
cross several membranes in order to get to the CSF. (Note that endothelial cells in
other organs can have intercellular pores and pinocytotic vesicles.) (2) Active transport
systems in the choroid plexus allow for transport of organic acids and bases from the
CSF into blood. (3) The continuous process of CSF production in the ventricles and
venous drainage continuously dilutes toxicant or drug concentrations. Disease processes
such as meningitis can disrupt this barrier and can allow for penetration of antibiotics
(e.g., aminoglycosides) that would not otherwise readily cross this barrier in a healthy
individual. Other tissue/blood barriers include prostate/blood, testicles/blood, and globe
of eye/blood, but inflammation or infection can increase permeability of these barriers.
Toxicants can cross the placenta primarily by simple diffusion, and this is most easily
accomplished if the toxicants are lipid-soluble (i.e., nonionized weak acids or bases).
The view that the placenta is a barrier to drugs and toxicants is inaccurate. The fetus
is, at least to some extent, exposed to essentially all drugs even if those with low lipid
solubility are taken by the mother.
As was indicated earlier, the circulatory system and components in the blood stream
are primarily responsible for the transport of toxicants to target tissues or reservoirs.
Erythrocytes and lymph can play important roles in the transport of toxicants, but
compared to plasma proteins, their role in toxicant distribution is relatively minor for
most toxicants. Plasma protein binding can affect distribution because only the unbound
TOXICANT DISTRIBUTION 99
toxicant is free or available to diffuse across the cell membranes. The toxicant-protein
binding reaction is reversible and obeys the laws of mass action:
Toxicant
(free)
+
Protein
k
1
↔
k
2
Toxicant-Protein
(bound)
Usually the ratio of unbound plasma concentration (C
u
) of the toxicant to total toxicant
concentration in plasma (C) is the fraction of drug unbound, f
u
,thatis,
f
u
=
C
u
C
.
The constants k
1
and k
2
are the specific rate constants for association and dissociation,
respectively. The association constant K
a
will be the ratio k
1
/k
2
, and conversely, the
dissociation constant, K
d
will be k
2
/k
1
. The constants and parameters are often used
to describe and, more important, to compare the relative affinity of xenobiotics for
plasma proteins.
The are many circulating proteins, but those involved in binding xenobiotics include
albumin, α
1
-acid glycoprotein, lipoproteins, and globulins. Because many toxicants
are lipophilic, they are likely to bind to plasma α-andβ-lipoproteins. There are
mainly three classes of lipoproteins, namely high-density lipoprotein (HDL), low-
density lipoprotein (LDL), and very low density lipoprotein (VLDL). Iron and copper
are known to interact strongly with the metal-binding globulins transferin and ceru-
loplasmin, respectively. Acidic drugs bind primarily to albumin, and basic drugs are
bound primarily to α
1
-acid glycoprotein and β-globulin. Albumin makes up 50% of
total plasma proteins, and it reacts with a wide variety of drugs and toxicants. The
α
1
-acid glycoprotein does not have as many binding sites as albumin, but it has one
high-affinity binding site. The amount of toxicant drug that is bound depends on free
drug concentration, and its affinity for the binding sites, and protein concentration.
Plasma protein binding is nonselective, and therefore toxicants and drugs with similar
physicochemical characteristics can compete with each other and endogenous sub-
stances for binding sites. Binding to these proteins does not necessarily prevent the
toxicant from reaching the site of action, but it slows the rate at which the toxicant
reaches a concentration sufficient to produce a toxicological effect. Again, this is related
to what fraction of the toxicant is free or unbound (f
u
).
Toxicants complex with proteins by various mechanisms. Covalent binding may
have a pronounced effect on an organism due to the modification of an essential
molecule, but such binding is usually a very minor portion of the total dose. Because
covalently bound molecules dissociate very slowly, if at all, they are not considered
further in this discussion. However, we should recognize that these interactions are
often associated with carcinogenic metabolites. Noncovalent binding is of primary
importance to distribution because the toxicant or ligand can dissociate more readily
than it can in covalent binding. In rare cases the noncovalent bond may be so stable that
the toxicant remains bound for weeks or months, and for all practical purposes, the bond
is equivalent to a covalent one. Types of interactions that lead to noncovalent binding
under the proper physiological conditions include ionic binding, hydrogen bonding, van
der Waals forces, and hydrophobic interactions. There are, however, some transition
metals that have high association constants and dissociation is slow.
100 ABSORPTION AND DISTRIBUTION OF TOXICANTS
We know more about ligand-protein interactions today because of the numerous
protein binding studies performed with drugs. The major difference between drugs
and most toxicants is the frequent ionizability and high water solubility of drugs as
compared with the non-ionizability and high lipid solubility of many toxicants. Thus
experience with drugs forms an important background, but one that may not always
be relevant to other potentially toxic compounds.
Variation in chemical and physical features can affect binding to plasma constituents.
Table 6.4 shows the results of binding studies with a group of insecticides with greatly
differing water and lipid solubilities. The affinity for albumin and lipoproteins is
inversely related to water solubility, although the relation may be imperfect. Chlo-
rinated hydrocarbons bind strongly to albumin but even more strongly to lipoproteins.
Strongly lipophilic organophosphates bind to both protein groups, whereas more water-
soluble compounds bind primarily to albumin. The most water-soluble compounds
appear to be transported primarily in the aqueous phase. Chlordecone (Kepone) has
partitioning characteristics that cause it to bind in the liver, whereas DDE, the metabo-
lite of DDT, partitions into fatty depots. Thus the toxicological implications for these
two compounds may be quite different.
Although highly specific (high-affinity, low-capacity) binding is more common with
drugs, examples of specific binding for toxicants seem less common. It seems probable
that low-affinity, high-capacity binding describes most cases of toxicant binding. The
number of binding sites can only be estimated, often with considerable error, because
of the nonspecific nature of the interaction. The number of ligand or toxicant molecules
bound per protein molecule, and the maximum number of binding sites, n,definethe
definitive capacity of the protein. Another consideration is the binding affinity K
binding
(or 1/K
diss
). If the protein has only one binding site for the toxicant, a single value,
K
binding
, describes the strength of the interaction. Usually more than one binding site is
present, each site having its intrinsic binding constant, k
1
,k
2
, ,k
n
. Rarely does one
find a case where k
1
= k
2
= = k
n
, where a single value would describe the affinity
Table 6.4 Relative Distribution of Insecticides into
Albumin and Lipoproteins
Percent Distribution of
Bound Insecticide
Insecticide Percent Bound Albumin LOL HDL
DDT 99.9 35 35 30
Deildrin 99.9 12 50 38
Lindane 98.0 37 38 25
Parathion 98.7 67 21 12
Diazinon 96.6 55 31 14
Carbaryl 97.4 99 <1 <1
Carbofuran 73.6 97 1 2
Aldicarb 30.0 94 2 4
Nicotine 25.0 94 2 4
Source: AdaptedfromB.P.MaliwalandF.E.Guthrie,Chem
Biol Interact 35:177–188, 1981.
Note: LOL, low-density lipoprotein; HOL, high-density lipo-
protein.
TOXICANT DISTRIBUTION 101
constant at all sites. This is especially true when hydrophobic binding and van der
Waals forces contribute to nonspecific, low-affinity binding. Obviously the chemical
nature of the binding site is of critical importance in determining binding. The three-
dimensional molecular structure of the binding site, the environment of the protein, the
general location in the overall protein molecule, and allosteric effects are all factors
that influence binding. Studies with toxicants, and even more extensive studies with
drugs, have provided an adequate elucidation of these factors. Binding appears to be
too complex a phenomenon to be accurately described by any one set of equations.
There are many methods for analyzing binding, but equilibrium dialysis is the most
extensively used. Again, the focus of these studies is to determine the percentage of
toxicant bound, the number of binding sites (n), and the affinity constant (K
a
).The
examples presented here are greatly simplified to avoid the undue confusion engendered
by a very complex subject.
Toxicant-protein complexes that utilize relatively weak bonds (energies of the order
of hydrogen bonds or less) readily associate and dissociate at physiological tempera-
tures, and the law of mass action applies to the thermodynamic equilibrium:
K
binding
=
[TP]
[T ][P ]
=
1
K
diss
,
where K
binding
is the equilibrium constant for association, [TP] is the molar concen-
tration of toxicant-protein complex, [T ] is the molar concentration of free toxicant,
and [P ] is the molar concentration of free protein. This equation does not describe the
binding site(s) or the binding affinity. To incorporate these parameters and estimate the
extent of binding, double-reciprocal plots of 1/[TP]versus1/[T ] may be used to test
the specificity of binding. The 1/[TP] term can also be interpreted as moles of albumin
per moles of toxicant. The slope of the straight line equals 1/nK
a
and the intercept of
this line with the x-axis equals −K
a
. Regression lines passing through the origin imply
infinite binding, and the validity of calculating an affinity constant under these circum-
stances is questionable. Figure 6.10 illustrates one such case with four pesticides, and
the insert illustrates the low-affinity, “unsaturable” nature of binding in this example.
The two classes of toxicant-protein interactions encountered may be defined as
(1) specific, high affinity, low capacity, and (2) nonspecific, low affinity, high capacity.
The term high affinity implies an affinity constant (K
binding
) of the order of 10
8
M
−1
,
whereas low affinity implies concentrations of 10
4
M
−1
. Nonspecific, low-affinity bind-
ing is probably most characteristic of nonpolar compounds, although most cases are
not as extreme as that shown in Figure 6.10.
An alternative and well-accepted treatment for binding studies is the Scatchard
equation especially in situations of high-affinity binding:
ν =
nk[T ]
1 + k[T ]
,
which is simplified for graphic estimates to
ν
[T ]
= k(n − ν),
where ν is the moles of ligand (toxicant) bound per mole of protein, [T ] is the con-
centration of free toxicant, k is the intrinsic affinity constant, and n is the number of
sites exhibiting such affinity. When ν[T ] is plotted against ν, a straight line is obtained
102 ABSORPTION AND DISTRIBUTION OF TOXICANTS
12
10
8
6
4
2
0
DDT
Dieldrin
Parathion
Carbaryl
403020105
10
−3
× r
10
8
10
7
10
6
1
r
B
A
6
5
4
3
2
1
0
5201510
1
[L]
× 10
8
r
[L]
(M
−1
)
10
−3
B
FA
×
(a)
(b)
Figure 6.10 Binding of toxicants to blood proteins: (a) Double-reciprocal plot of binding of
rat serum lipoprotein fraction with four insecticides. Insert illustrates magnitude of differences in
slope with Scatchard plot. (b) Scatchard plot of binding of salicylate to human serum proteins.
(Sources: (a) Skalsky and Guthrie, Pest. Biochem. Physiol. 7: 289, 1977; (b) Moran and Walker,
Biochem. Pharmacol. 17: 153, 1968.)
if only one class of binding sites is evident. The slope is −k, and the intercept on
the ν-axis becomes n (number of binding sites). If more than one class of sites occurs
(probably the most common situation for toxicants), a curve is obtained from which the
constants may be obtained. This is illustrated in Figure 6.10b, for which the data show
not one but two species of binding sites: one with low capacity but high affinity, and
another with about three times the capacity but less affinity. Commonly used computer
programs usually solve such data by determining one line for the specific binding and
one line for nonspecific binding, the latter being an average of many possible solutions.
When hydrophobic binding of lipid toxicants occurs, as is the case for many
environmental contaminants, binding is probably not limited to a single type of plasma
TOXICANT DISTRIBUTION 103
protein. For example, the binding of the chlorinated hydrocarbon DDT is strongest for
lipoproteins and albumin, but other proteins account for a significant part of overall
transport. Similar results have been observed for several compounds with a range of
physiochemical properties.
The presence of another toxicant and/or drug that can bind at the same site can also
increase the amount of free or unbound drug. This is an example of drug interaction
that can have serious toxicological or pharmacological consequences. In general, when
bound concentrations are less than 90% of the total plasma concentrations, plasma
protein binding has little clinical importance. Plasma protein binding becomes important
when it is more than 90%. For example, if a toxicant is 99% bound to plasma proteins,
then 1% is free, but if there is toxicant interaction (e.g., competitive binding) that
results in 94% bound, 6% is now free. Note that because of this interaction, the
amount of available toxicant to cause a toxicological response has increased sixfold.
Such a scenario may result in severe acute toxicity. Extensive plasma protein binding
can influence renal clearance if glomerular filtration is the major elimination process
in the kidney, but not if it is by active secretion in the kidney. Binding can also affect
drug clearance if the extraction ratio (ER) in the liver is low, but not if the ER is
high for that toxicant. Plasma protein binding can vary between and within chemical
classes, and it is also species specific. For example, humans tend to bind acidic drugs
more extensively than do other species.
There are several other variables that can alter plasma protein concentrations. These
include malnutrition, pregnancy, cancer, liver abscess, renal disease, and age can
reduce serum albumin. Furthermore α
1
-glycoprotein concentrations can increase with
age, inflammation, infections, obesity, renal failure, and stress. Small changes in body
temperature or changes in acid-base balance may alter chemical protein-binding charac-
teristics. Although termination of drug or toxicant effect is usually by biotransformation
and excretion, it may also be associated with redistribution from its site of action
into other tissues. The classical example of this is when highly lipid-soluble drugs
or toxicants that act on the brain or cardiovascular system are administered by IV or
by inhalation.
6.6.2 Volume of Distribution (V
d
)
Usually after a toxicant or drug is absorbed it can be distributed into various physiologic
fluid compartments. The total body water represents 57% of total body mass (0.57 L/kg)
(Table 6.5). The plasma, interstitial fluid, extracellular fluid, and intracellular fluid
represent about 5, 17, 22, and 35% body weight, respectively. The extracellular fluid
comprises the blood plasma, interstitial fluid, and lymph. Intracellular fluid includes
Table 6.5 Volume of Distribution into Physiological Fluid Compartments
Compartment Volume of Distribution in L/kg Body Weight (Ls/70 kg Body weight)
Plasma 0.05(3.5 L)
Interstitial fluid 0.18(12.6 L)
Extracellular fluid 0.23(16.1 L)
Intracellular fluid 0.35(24.5 L)
Total body water 0.55(39 L)
104 ABSORPTION AND DISTRIBUTION OF TOXICANTS
the sum of fluid contents of all cells in the body. There is also transcellular fluid that
represents 2% body weight, and this includes cerebrospinal, intraocular, peritoneal,
pleural, and synovial fluids, and digestive secretions. Fat is about 20% body weight,
while the GIT contents in monogastrics make up 1% body weight, and in ruminants it
can constitute 15% body weight.
Its sometimes useful to quantitate how well a drug or toxicant is distributed into these
various fluid compartments, and in this context the apparent volume of distribution
can be a useful parameter. The apparent volume of distribution, V
d
, is defined as the
volume of fluid required to contain the total amount, A, of drug in the body at the
same concentration as that present in plasma, C
p
,
V
d
=
A
C
p
.
In general, the V
d
for a drug is to some extent descriptive of its distribution pat-
tern in the body. For example, drugs or toxicants with relatively small V
d
values may
be confined to the plasma as diffusion across the capillary wall is limited. There are
other toxicants that have a slightly larger V
d
(e.g., 0.23 L/kg), and these toxicants
may be distributed in the extracellular compartment. This includes many polar com-
pounds (e.g., tubocurarine, gentamicin, V
d
= 0.2–0.4 L/kg). These toxicants cannot
readily enter cells because of their low lipid solubility. If the V
d
for some of these
toxicants is in excess of the theoretical value, this may be due to limited degree of
penetration into cells or from the extravascular compartment. Finally there are many
toxicants distributed throughout the body water (V
d
≥ 0.55 L/kg) that may have V
d
values much greater than that for total body water. This distribution is achieved by
relatively lipid-soluble toxicants and drugs that readily cross cell membranes (e.g.,
ethanol, diazepam; V
d
= 1 to 2 L/kg). Binding of the toxicant anywhere outside of the
plasma compartment, as well as partitioning into body fat, can increase V
d
beyond the
absolute value for total body water. In general, toxicants with a large V
d
can even reach
the brain, fetus, and other transcellular compartments. In general, toxicants with large
V
d
are a consequence of extensive tissue binding. The reader should be aware that we
are talking about tissue binding, and not plasma protein binding where distribution is
limited to plasma for obvious reasons.
The fraction of toxicant located in plasma is dependent on whether a toxicant binds
to both plasma and tissue components. Plasma binding can be measured directly, but
not tissue binding. It can, however, be inferred from the following relationship:
Amount in body = Amount in plasma + Amount outside plasma
V
d
× C = V
p
× C + V
TW
× C
TW
where V
d
is the apparent volume of distribution, V
p
the volume of plasma, V
TW
the
apparent volume of tissue, and C
TW
the tissue concentration. If the preceding equation
is divided by C, it now becomes
V
d
= V
p
+ V
TW
×
C
TW
C
Recall that f
u
= C
u
/C occurs with plasma, and also that the fraction unbound in
tissues is f
uT
= C
uT
/C
TW
.
TOXICOKINETICS 105
Assuming at equilibrium that unbound concentration in tissue and plasma are equal,
then we let the ratio of f
u
/f
uT
replace C
TW
/C and determine the volume of distribution
as follows:
V
d
= V
p
+ V
TW
×
f
u
f
uT
.
It is possible to predict what happens to V
d
when f
u
or f
uT
changesasaresult
of physiological or disease processes in the body that change plasma and/or tissue
protein concentrations. For example, V
d
can increase with increased unbound toxicant
in plasma or with a decrease in unbound toxicant tissue concentrations. The preceding
equation explains why: because of both plasma and tissue binding, some V
d
values
rarely correspond to a real volume such as plasma volume, extracellular space, or total
body water. Finally interspecies differences in V
d
values can be due to differences in
body composition of body fat and protein, organ size, and blood flow as alluded to
earlier in this section. The reader should also be aware that in addition to V
d
,there
are volumes of distribution that can be obtained from pharmacokinetic analysis of a
given data set. These include the volume of distribution at steady state (V
d,ss
), volume
of the central compartment (V
c
), and the volume of distribution that is operative over
the elimination phase (V
d,area
). The reader is advised to consult other relevant texts
for a more detailed description of these parameters and when it is appropriate to use
these parameters.
6.7 TOXICOKINETICS
The explanation of the pharmacokinetics or toxicokinetics involved in absorption, dis-
tribution, and elimination processes is a highly specialized branch of toxicology, and
is beyond the scope of this chapter. However, here we introduce a few basic concepts
that are related to the several transport rate processes that we described earlier in this
chapter. Toxicokinetics is an extension of pharmacokinetics in that these studies are
conducted at higher doses than pharmacokinetic studies and the principles of pharma-
cokinetics are applied to xenobiotics. In addition these studies are essential to provide
information on the fate of the xenobiotic following exposure by a define route. This
information is essential if one is to adequately interpret the dose-response relationship
in the risk assessment process. In recent years these toxicokinetic data from laboratory
animals have started to be utilized in physiologically based pharmacokinetic (PBPK)
models to help extrapolations to low-dose exposures in humans. The ultimate aim in
all of these analyses is to provide an estimate of tissue concentrations at the target site
associated with the toxicity.
Immediately on entering the body, a chemical begins changing location, concentra-
tion, or chemical identity. It may be transported independently by several components
of the circulatory system, absorbed by various tissues, or stored; the chemical may
effect an action, be detoxified, or be activated; the parent compound or its metabo-
lite(s) may react with body constituents, be stored, or be eliminated—to name some
of the more important actions. Each of these processes may be described by rate con-
stants similar to those described earlier in our discussion of first-order rate processes
that are associated with toxicant absorption, distribution, and elimination and occur
106 ABSORPTION AND DISTRIBUTION OF TOXICANTS
Metabolism to
More Toxic
Metabolites
Metabolism to
Less Toxic
Metabolites
Metabolism to
Conjugation
Products
Interaction with Macromolecules
(Proteins, DNA, RNA, Receptors,etc)
Exposure
Excretion
Toxic Effects
(Genetic, Carcinogenic, Reproductive, Immunologic, etc)
Turnover
and Repair
Distribution
Distribution to Body
Absorption at Portals of Entry
Figure 6.11 Sequence of events following exposure of an animal to exogenous chemicals.
simultaneously. Thus at no time is the situation stable but is constantly changing as
indicated in Figure 6.11.
It should be noted, however, that as the toxicant is being absorbed and distributed
throughout the body, it is being simultaneously eliminated by various metabolism
and/or excretion mechanisms, as will be discussed in more detail in the following
chapters. However, one should mention here that an important pharmacokinetic param-
eter known as clearance (C) can be used to quantitatively assess elimination of a
toxicant. Clearance is defined as the rate of toxicant excreted relative to its plasma
concentration, C
p
:
C =
Rate of toxicant excretion
C
p
.
The rate of excretion is really the administered dose times the fractional elimination
rate constant K
el
described earlier. Therefore we can express the preceding equation
in terms of K
el
and administered dose as volume of distribution, V
d
:
C = K
el
·
Dose
C
p
= K
el
· (V
d
· C
p
)/C
p
= K
el
· V
d
.
In physiological terms we can also define clearance as the volume of blood cleared
of the toxicant by an organ or body per unit time. Therefore, as the equations above
indicate, the body clearance of a toxicant is expressed in units of volume per unit time
(e.g., L/h), and can be derived if we know the volume of distribution of the toxicant
TOXICOKINETICS 107
and fractional rate constant. In many instances this can only be derived by appropriate
pharmacokinetic analysis of a given data set following blood or urine sample collection
and appropriate chemical analyses to determine toxicant concentrations in either of
these biological matrices.
Each of the processes discussed thus far—absorption, distribution, and elimina-
tion—can be described as a rate process. In general, the process is assumed to be first
order in that the rate of transfer at any time is proportional to the amount of drug in the
body at that time. Recall that the rate of transport (dC/dt) is proportional to toxicant
concentration (C) or stated mathematically:
dC
dt
= KC,
where K is the rate constant (fraction per unit time). Many pharmacokinetic analyses
of a chemical are based primarily on toxicant concentrations in blood or urine samples.
It is often assumed in these analyses that the rate of change of toxicant concentration
in blood reflects quantitatively the change in toxicant concentration throughout the
body (first-order principles). Because of the elimination/clearance process, which also
assumed to be a first-order rate process, the preceding rate equation now needs a
negative sign. This is really a decaying process that is observed as a decline of toxicant
concentration in blood or urine after intravenous (IV) administration. The IV route
is preferred in these initial analyses because there is no absorption phase, but only
chemical depletion phase. However, one cannot measure infinitesimal change of C
or time, t; therefore there needs to be integration after rearrangement of the equation
above:
−dC
C
= kdt becomes
−dC
C
= k
dt,
which can be expressed as
C = C
0
e
−kt
,
where e is the base of the natural logarithm. We can remove e by taking the ln of
both sides:
ln C
t
= ln C
0
− kt.
Note that K is the slope of the straight line for a semilog plot of toxicant concentration
versus time (Figure 6.12). In the preceding equation it is the elimination rate constant
that is related to the half-life of the toxicant described earlier in this chapter. The
derived C
0
can be used to calculate the volume of distribution (V
d
) of the toxicant
as follows:
V
d
=
Dose
C
0
.
However, toxicokinetic data for many toxicants do not always provide a straight
line when plotted as described above. More complicated equations with more than one
exponential term with rate constants may be necessary to mathematically describe the
concentration-time profile. These numerous rate constants are indicative of chemical
transport between various compartments in the body and not only to a single cen-
tral compartment as suggested in the simple equation and semilog plot described in
108 ABSORPTION AND DISTRIBUTION OF TOXICANTS
K
a
K
el
(a)
(b)
Central
Time
lnC
p
Slope = −K
el
C
p
0
↓
Figure 6.12 (a) Semilog plot of plasma concentration (C
p
) versus time. C
p
0
is the intercept
on the y-axis, and K
el
is the elimination rate constant. (b) Single compartment model with rate
constants for absorption, K
a
and for elimination, K
el
.
(a)(b)
Central
(1)
Peripheral
(2)
Time
lnC
p
C
p
0
K
12
K
21
K
el
=
K
10
b
=
l
2
A
2
=
B
A
1
=
A
a
=
l
1
Figure 6.13 (a) Semilog plot of plasma concentration for (C
p
) versus time representative of
a two-compartment model. The curve can be broken down into an α or λ
1
distribution phase
and β or λ
2
elimination phase. (b) Two-compartment model with transfer rate constants, K
12
and K
21
, and elimination rate constant, K
el
.
Figure 6.12. In some instances the data may fit to a bi-exponential concentration-time
profile (Figure 6.13). The equation to describe this model is
C = Ae
−αt
+ Be
−βt
.
In other instances, complex profiles may require a three- or multi-exponential
concentration-time profile (Figure 6.14). The equation to describe the three-profile
case is
C = Ae
−αt
+ Be
−βt
+ Ce
−γt
.
In the physiological sense, one can divide the body into “compartments” that
represent discrete parts of the whole-blood, liver, urine, and so on, or use a math-
ematical model describing the process as a composite that pools together parts of
tissues involved in distribution and bioactivation. Usually pharmacokinetic compart-
ments have no anatomical or physiological identity; they represent all locations within
the body that have similar characteristics relative to the transport rates of the par-
ticular toxicant. Simple first-order kinetics is usually accepted to describe individual
SUGGESTED READING 109
(a)(b)
Time (hrs)
K
12
K
21
K
31
K
13
K
el
=
K
10
l
1
l
2
l
1
l
2
l
3
0
0510
10
100
20 40 60 80
100
10
1
0.1
0.01
Concentration (µg/ml)
2 1 3
Figure 6.14 (a) Semilog plot of plasma concentration for (C
p
) versus time representative
of a three- or multi-compartment model. The curve can be broken down into three phases,
λ
1
,λ
2
,andλ
3
.(b) Three-compartment model with transfer rate constants, K
12
,K
21
,K
13
,K
31
,
and elimination rate constant, K
el
. As these models can get more complicated, the α, β,andγ
nomenclature may get replaced with λ
n
as indicated in the profile.
rate processes for the toxicant after entry. The resolution of the model necessitates
mathematical estimates (as a function of time) concerning the absorption, distribution,
biotransformation, and excretion of the toxicant.
Drugs and toxicants with multi-exponential behavior depicted in Figure 6.14 require
calculation of the various micro constants. An alternative method involves using model-
independent pharmacokinetics to arrive at relevant parameters. Very briefly, it involves
determination of the area under the curve (AUC) of the concentration-time profiles.
The emergence of microcomputers in recent years has greatly facilitated this approach.
In conclusion, pharmacokinetics is a study of the time course of absorption, distri-
bution, and elimination of a chemical. We use pharmacokinetics as a tool to analyze
plasma concentration time profiles after chemical exposure, and it is the derived rates
and other parameters that reflect the underlying physiological processes that determine
the fate of the chemical. There are numerous software packages available today to
accomplish these analyses. The user should, however, be aware of the experimen-
tal conditions, the time frame over which the data were collected, and many of the
assumptions embedded in the analyses. For example, many of the transport processes
described in this chapter may not obey first-order kinetics, and thus may be nonlinear
especially at toxicological doses. The reader is advised to consult other texts for more
detailed descriptions of these nonlinear interactions and data analyses.
SUGGESTED READING
R. Bronaugh and H. Maibach, eds. Percutaneous Absorption. New York: Dekker, 1989.
A. Goodman Gilman, T. W. Rall, A. S. Nies, and P. Taylor, eds. Goodman and Gilman’s The
Pharmacological Basis of Therapeutics, 8th edn. Elmsford, NY: Pergamon Press, 1990.
P. Grandjean, ed. Skin Penetration: Hazardous Chemicals at Work. London: Taylor and Francis,
1990.
110 ABSORPTION AND DISTRIBUTION OF TOXICANTS
R. Krieger, ed. Handbook of Pesticide Toxicology, 2nd edn. San Diego: Academic Press, 2001.
M. Rowland and T. N. Tozer, eds. Clinical Pharmacokinetics. Concepts and Applications,3rd
edn. Philadelphia: Lea and Febiger, 1995.
L. Shargel and A. B. C. Yu, eds. Applied Biopharmaceutics and Pharmacokinetics, 4th edn.
Norwalk, CT: Appleton and Lange, 1999.
CHAPTER 7
Metabolism of Toxicants
RANDY L. ROSE and ERNEST HODGSON
7.1 INTRODUCTION
One of the most important determinants of xenobiotic persistence in the body and
subsequent toxicity to the organism is the extent to which they can be metabo-
lized and excreted. Several families of metabolic enzymes, often with wide arrays of
substrate specificity, are involved in xenobiotic metabolism. Some of the more impor-
tant families of enzymes involved in xenobiotic metabolism include the cytochrome
P450 monooxygenases (CYPs), flavin-containing monooxygenases (FMOs), alcohol
and aldehyde dehydrogenases, amine oxidases, cyclooxygenases, reductases, hydro-
lases, and a variety of conjugating enzymes such as glucuronidases, sulfotransferases,
methyltransferases, glutathione transferases, and acetyl transferases.
Most xenobiotic metabolism occurs in the liver, an organ devoted to the synthesis of
many important biologically functional proteins and thus with the capacity to mediate
chemical transformations of xenobiotics. Most xenobiotics that enter the body are
lipophilic, a property that enables them to bind to lipid membranes and be transported
by lipoproteins in the blood. After entrance into the liver, as well as in other organs,
xenobiotics may undergo one or two phases of metabolism. In phase I a polar reactive
group is introduced into the molecule rendering it a suitable substrate for phase II
enzymes. Enzymes typically involved in phase I metabolism include the CYPs, FMOs,
and hydrolases, as will be discussed later. Following the addition of a polar group,
conjugating enzymes typically add much more bulky substituents, such as sugars,
sulfates, or amino acids that result in a substantially increased water solubility of the
xenobiotic, making it easily excreted. Although this process is generally a detoxication
sequence, reactive intermediates may be formed that are much more toxic than the
parent compound. It is, however, usually a sequence that increases water solubility
and hence decreases the biological half life (t
0.5)
of the xenobiotic in vivo.
Phase I monooxygenations are more likely to form reactive intermediates than
phase II metabolism because the products are usually potent electrophiles capable of
reacting with nucleophilic substituents on macromolecules, unless detoxified by some
subsequent reaction. In the following discussion, examples of both detoxication and
intoxication reactions are given, although greater emphasis on activation products is
provided in Chapter 8.
A Textbook of Modern Toxicology, Third Edition, edited by Ernest Hodgson
ISBN 0-471-26508-X Copyright
2004 John Wiley & Sons, Inc.
111
112 METABOLISM OF TOXICANTS
7.2 PHASE I REACTIONS
Phase I reactions include microsomal monooxygenations, cytosolic and mitochondrial
oxidations, co-oxidations in the prostaglandin synthetase reaction, reductions, hydrol-
yses, and epoxide hydration. All of these reactions, with the exception of reductions,
introduce polar groups to the molecule that, in most cases, can be conjugated during
phase II metabolism. The major phase I reactions are summarized in Table 7.1.
7.2.1 The Endoplasmic Reticulum, Microsomal Preparation,
and Monooxygenations
Monooxygenation of xenobiotics are catalyzed either by the cytochrome P450 (CYP)-
dependent monooxygenase system or by flavin-containing monooxygenases (FMO).
Table 7.1 Summary of Some Important Oxidative and Reductive Reactions of Xenobiotics
Enzymes and Reactions Examples
Cytochrome P450
Epoxidation/hydroxylation Aldrin, benzo(a)pyrene, aflatoxin, bromobenzene
N-, O-, S-Dealkylation Ethylmorphine, atrazine, p-nitroanisole,
methylmercaptan
N-, S-, P -Oxidation Thiobenzamide, chlorpromazine,
2-acetylaminofluorene
Desulfuration Parathion, carbon disulfide
Dehalogenation Carbon tetrachloride, chloroform
Nitro reduction Nitrobenzene
Azo reduction O-Aminoazotoluene
Flavin-containing monooxygenase
N-, S-, P -Oxidation Nicotine, imiprimine, thiourea, methimazole
Desulfuration Fonofos
Prostaglandin synthetase cooxidation
Dehydrogenation Acetaminophen, benzidine, epinephrine
N-Dealkylation Benzphetamine, dimethylaniline
Epoxidation/hydroxylation Benzo(a)pyrene, 2-aminofluorene, phenylbutazone
Oxidation FANFT, ANFT, bilirubin
Molybdenum hydroxylases
Oxidation Purines, pteridine, methotrexate, 6-deoxycyclovir
Reductions Aromatic nitrocompounds, azo dyes, nitrosoamines
Alcohol dehydrogenase
Oxidation Methanol, ethanol, glycols, glycol ethers
Reduction Aldehydes and ketones
Aldehyde dehydrogenase
Oxidation Aldehydes resulting from alcohol and glycol
oxidations
Esterases and amidases
Hydrolysis Parathion, paraoxon, dimethoate
Epoxide hydrolase
Hydrolysis Benzo(a)pyrene epoxide, styrene oxide
PHASE I REACTIONS 113
Both are located in the endoplasmic reticulum of the cell and have been studied in
many tissues and organisms. This is particularly true of CYPs, probably the most
studied of all enzymes.
Microsomes are derived from the endoplasmic reticulum as a result of tissue
homogenization and are isolated by centrifugation of the postmitochondrial supernatant
fraction, described below. The endoplasmic reticulum is an anastomosing network
of lipoprotein membranes extending from the plasma membrane to the nucleus
and mitochrondria, whereas the microsomal fraction derived from it consists of
membranous vesicles contaminated with free ribosomes, glycogen granules, and
fragments of other subcellular structures such as mitochondria and Golgi apparatus.
The e ndoplasmic reticulum, and consequently the microsomes derived from it, consists
of two types, rough and smooth, the former having an outer membrane studded with
ribosomes, which the latter characteristically lack. Although both rough and smooth
microsomes have all of the components of the CYP-dependent monooxygenase system,
the specific activity of the smooth type is usually higher.
The preparation of microsomal fractions, S9, and cytosolic fractions from tissue
homogenates involves the use of two to three centrifugation steps. Following tis-
sue extraction, careful mincing, and rinses of tissue for blood removal, the tissues
are typically homogenized in buffer and centrifuged at 10,000 × g for 20 minutes.
The resulting supernatant, often referred to as the S9 fraction, can be used in stud-
ies where both microsomal a nd cytosolic enzymes are desired. More often, however,
the S9 fraction is centrifuged at 100,000 × g for 60 minutes to yield a microsomal
pellet and a cytosolic supernatant. The pellet is typically resuspended in a volume of
buffer, which will give 20 to 50 mg protein/ml and stored at −20 to −70
◦
C. Often,
the microsomal pellet is resuspended a second time and resedimented at 100,000 × g
for 60 minutes to further remove contaminating hemoglobin and other proteins. As
described above, enzymes within the microsomal fraction (or microsomes) include
CYPs, FMOs, cyclooxygenases, and other membrane-bound enzymes, including nec-
essary coenzymes such as NADPH cytochrome P450 reductase for CYP. Enzymes
found in the cytosolic fraction (derived from the supernatant of the first 100,000 × g
spin) include hydrolases and most of the conjugating enzymes such as glutathione
transferases, glucuronidases, sulfotransferases, methyl transferases, and acetylases. It
is important to note that some cytosolic enzymes can also be found in microsomal
fractions, although the opposite is not generally the case.
Monooxygenations, previously known as mixed-function oxidations, are those oxi-
dations in which one atom of a molecule of oxygen is incorporated into the substrate
while the other is reduced to water. Because the electrons involved in the reduction
of CYPs or FMOs are derived from NADPH, the overall reaction can be written as
follows (where RH is the substrate):
RH + O
2
+ NADPH + H
+
−−−→ NADP
+
+ ROH + H
2
O.
7.2.2 The Cytochrome P450-Dependent Monooxygenase System
The CYPs, the carbon monoxide-binding pigments of microsomes, are heme proteins
of the b cytochrome type. Originally described as a single protein, there are now
known to be more than 2000 CYPs widely distributed throughout animals, plants, and
microorganisms. A system of nomenclature utilizing the prefix C YP has been devised
114 METABOLISM OF TOXICANTS
for the genes and cDNAs corresponding to the different forms (as discussed later in this
section), although P450 is still appropriate as a prefix for the protein products. U nlike
most cytochromes, the name CYP is derived not from the absorption maximum of the
reduced form in the visible region but from the unique wavelength of the absorption
maximum of the carbon monoxide derivative of the reduced form, namely 450 nm.
The role of CYP as the terminal oxidase in monooxygenase reactions is supported
by considerable evidence. The initial proof was derived from the demonstration of
the concomitant light reversibility of the CO complex of CYP and the inhibition,
by CO, of the C-21 hydroxylation of 17 α-hydroxy-progesterone by adrenal gland
microsomes. This was followed by a number of indirect, but nevertheless convincing,
proofs involving the effects on both CYP and monooxygenase activity of CO, inducing
agents, and spectra resulting from ligand binding and the loss of activity on degrada-
tion of CYP to cytochrome P420. Direct proof was subsequently provided by the
demonstration that monooxygenase systems, reconstituted from apparently homoge-
nous purified CYP, NADPH-CYP reductase, and phosphatidylchloline, can catalyze
many monooxygenase reactions.
CYPs, like other hemoproteins, have characteristic absorptions in the visible region.
The addition of many organic, and some inorganic, ligands results in perturbations
of this spectrum. Although the detection and measurement of these spectra requires a
high-resolution spectrophotometer, these perturbations, measured as optical difference
spectra, have been of tremendous use in the characterization of CYPs, particularly in
the decades preceding the molecular cloning and expression of specific CYP isoforms.
The most important difference spectra of oxidized CYP are type I, with an absorption
maximum at 385 to 390 nm. Type I ligands are found in many different chemical
classes and include drugs, environmental contaminants, pesticides, and so on. They
appear to be generally unsuitable, on chemical grounds, as ligands for the heme iron
and are believed to bind to a hydrophobic site in the protein that is close enough to
the heme to allow both spectral perturbation and interaction with the activated oxygen.
Although most type I ligands are substrates, it has not been possible to demonstrate a
quantitative relationship between K
S
(concentration required for half-maximal spectral
development) and K
M
(Michaelis constant). Type II ligands, however, interact directly
with the heme iron of CYP, and are associated with organic compounds having nitrogen
atoms with sp
2
or sp
3
nonbonded electrons that are sterically accessible. Such ligands
are frequently inhibitors of CYP activity.
The two most important difference spectra of reduced CYP are the well-known CO
spectrum, with its maximum at or about 450 nm, and the type III spectrum, with two
pH-dependent peaks at approximately 430 and 455 nm. The CO spectrum forms the
basis for the quantitative estimation of CYP. The best-known type III ligands for CYP
are ethyl isocyanide and compounds such as the methylenedioxyphenyl synergists and
SKF 525A, the last two forming stable type III complexes that appear to be related to
the mechanism by which they inhibit monooxygenations.
In the catalytic cycle of CYP, reducing equivalents a re transferred from NADPH
to CYP by a flavoprotein enzyme known as NADPH-cytochrome P450 reductase. The
evidence that this enzyme is involved in CYP monooxygenations was originally derived
from the observation that cytochrome c, which can function as an artificial electron
acceptor for the enzyme, is an inhibitor of such oxidations. This reductase is an essential
component in CYP-catalyzed enzyme systems reconstituted from purified components.
Moreover antibodies prepared from purified reductase are inhibitors of microsomal
PHASE I REACTIONS 115
monooxygenase reactions. The reductase is a flavoprotein of approximately 80,000
daltons that contain 2 mole each of flavin mononucleotide (FMN) and flavinadenine
dinucleotide (FAD) per mole of enzyme. The only other component necessary for
activity in the reconstituted system is a phospholipid, phosphatidylchloline. This is not
involved directly in electron transfer but appears to be involved in the coupling of the
reductase to the cytochrome and in the binding of the substrate to the cytochrome.
The mechanism of CYP function has not been established unequivocally; however,
the generally recognized steps are shown in Figure 7.1. The initial step consists of the
binding of substrate to oxidize CYP followed by a one electron reduction c atalyzed by
NADPH-cytochrome P450 reductase to form a reduced cytochrome-substrate complex.
This complex can interact with CO to form the CO-complex, which gives rise to the
well-known difference spectrum with a peak at 450 nm and also inhibits monooxyge-
nase activity. The next several steps are less well understood. They involve an initial
interaction with molecular oxygen to form a ternary oxygenated complex. This ternary
complex accepts a second electron, resulting in the further formation of one or more
less understood complexes. One of these, however, is probably the equivalent of the
peroxide anion derivative of the substrate-bound hemoprotein. Under some conditions
this complex may break down to yield hydrogen peroxide and the oxidized cytochrome
substrate complex. Normally, however, one atom of molecular oxygen is transferred to
the substrate and the other is reduced to water, followed by dismutation reactions lead-
ing to the formation of the oxygenated product, water, and the oxidized cytochrome.
The possibility that the second electron is derived from NADH through cytochrome
b
5
has been the subject of argument for some time and has yet to be completely
resolved. Cytochrome b
5
is a widely distributed microsomal heme protein that
is involved in metabolic reactions such as fatty acid desaturation that involve
endogenous substrates. It is c lear, however, that cytochrome b
5
is not essential f or all
ROH R
Lipid OOH Lipid
NADPH
NADPH
Cyt. P450
Reductase
NADPH
Cyt. P450
Reductase
NADH
Cyt. b
5
Reductase
XOOH
2H
+
e
−
e
−
e
−
e
−
e
−
e
−
H
2
O
H
2
O
2
O
2
−
•
O
2
−
•
O
2
Cyt-Fe
+3
Cyt-Fe
+3
R
Cyt-Fe
+3
R
Cyt. b
5
Cyt-Fe
+2
R
[CO]
hv
O
Cyt-Fe
+3
R
CO
Cyt-Fe
+3
R
O
2
−
•
Cyt-Fe
+2
R
O
2
Cyt-Fe
+1
R
O
2
Cyt-Fe
+2
R
or
NADH
NADPH
Figure 7.1 Generalized scheme showing the sequence of events for P450 monooxygenations.
116 METABOLISM OF TOXICANTS
CYP-dependent monooxygenations because many occur in systems reconstituted from
NADPH, O
2
, phosphatidylchloline, and highly purified CYP and NADPH-cytochrome
P450 reductase. Nevertheless, there is good evidence that many catalytic activities by
isoforms including CYP3A4, CYP3A5, and CYP2E1 are stimulated by cytochrome
b
5
. In some cases apocytochrome b
5
(devoid of heme) has also been found to be
stimulatory, suggesting that an alternate role of cytochrome b
5
may be the result of
conformational changes in the CYP/NADPH cytochrome P450 reductase systems. Thus
cytochrome b
5
may facilitate oxidative activity in the intact endoplasmic reticulum.
The isolation of forms of CYP that bind avidly to cytochrome b
5
also tends to support
this idea.
Distribution of Cytochrome P 450. In vertebrates the liver is the richest source
of CYP and is most active in the monooxygenation of xenobiotics. CYP and other
components of the CYP-dependent monooxygenase system are also in the skin, nasal
mucosa, lung, and gastrointestinal tract, presumably reflecting the evolution of defense
mechanisms at portals of entry. In addition to these organs, CYP has been demonstrated
in the kidney, adrenal c ortex and medulla, placenta, testes, ovaries, fetal and embryonic
liver, corpus luteum, aorta, blood platelets, and the nervous system. In humans, CYP
has been demonstrated in the fetal and adult liver, the placenta, kidney, testes, fetal
and adult adrenal gland, skin, blood platelets, and lymphocytes.
Although CYPs are found in many tissues, the function of the particular subset of
isoforms in organ, tissue, or cell type does not appear to be the same in all cases. In
the liver, CYPs oxidize a large number of xenobiotics as well as some e ndogenous
steroids and bile pigments. The CYPs of the lung also appear to be concerned primar-
ily with xenobiotic oxidations, although the range of substrates is more limited than
that of the liver. The skin and small intestine also carry out xenobiotic oxidations,
but their activities have been less well characterized. In normal pregnant females, the
placental microsomes display little or no ability to oxidize foreign compounds, appear-
ing to function as a steroid hormone metabolizing system. On induction of the CYP
enzymes, such as occurs in pregnant women who smoke, CYP-catalyzed aryl hydrocar-
bon hydroxylase activity is readily apparent. The CYPs of the kidney a re active in the
ω-oxidation of fatty acids, such as lauric acid, but are relatively inactive in xenobiotic
oxidation. Mitochondrial CYPs, such as those of the placenta and adrenal cortex, are
active in the oxidation of steroid hormones rather than xenobiotics.
Distribution of CYPs within the cell has been studied primarily in the mammalian
liver, where it is present in greatest quantity in the smooth endoplasmic reticulum and
in smaller but appreciable amounts in the rough endoplasmic reticulum. The nuclear
membrane has also been reported to contain CYP and to have detectable aryl hydro-
carbon hydroxylase activity, an observation that may be of considerable importance in
studies of the metabolic activation of carcinogens.
Multiplicity of Cytochrome P450, Purification, and Reconstitution of
Cytochrome P450 Activity
. Even before appreciable purification of CYP had been
accomplished, it was apparent from indirect evidence that mammalian liver cells
contained more than one CYP enzyme. Subsequent direct evidence on the multiplicity
of CYPs included the separation and purification of CYP isozymes, distinguished from
each other by chromatographic behavior, immunologic specificity, a nd/or substrate
specificity after reconstitution and separation of distinct polypeptides by sodium
PHASE I REACTIONS 117
dodecyl sulfate polyacrylamide gel electrophoresis (SDS-PAGE), which c ould then
be related to distinct CYPs present in the original microsomes.
Purification of CYP and its usual constituent isoforms was, for many years, an
elusive goal; one, however, that has been largely resolved. The problem of instability on
solubilization was resolved by the use of glycerol and dithiothreitol as protectants, and
the problem of reaggregation by maintaining a low concentration of a suitable detergent,
such as Emulgen 911 (Kao-Atlas, Tokyo), throughout the procedure. Multiple CYP
isoforms, as discussed previously, may be separated from each other and purified as
separate entities, although individual isoforms are now routinely cloned and expressed
as single entities. The lengthy processes of column purification of CYPs have now
been largely superceded by the cloning and expression of transgenic isoforms in a
variety of expression systems.
Systems reconstituted from purified CYP, NADPH-cytochrome P450 reductase and
phosphatidylchloline will, in the presence of NADPH and O
2
, oxidize xenobiotics
such as benzphetamine, often at rates comparable to microsomes. Although systems
reconstituted from this minimal number of components are enzymatically active, other
microsomal components, such as cytochrome b
5
, may facilitate activity either in vivo
or in vitro or may even be essential for the oxidation of certain substrates.
One important finding from purification studies as well as cloning and expressing of
individual isoforms is that the lack of substrate specificity of microsomes for monooxy-
genase activity is not an artifact caused by the presence of several specific cytochromes.
Rather, it appears that many of the cytochromes isolated are still relatively nonspecific.
The relative activity toward different substrates does nevertheless vary greatly from
one CYP isoform to another even when both are relatively nonspecific. This lack of
specificity is illustrated in Table 7.2, using human isoforms as examples.
Classification and Evolution of Cytochrome P450. The techniques of molecular
biology have been applied extensively to the study of CYP. More than 1925 genes have
been characterized as of 2002, and the nucleotide and derived amino acid sequences
compared. In some cases the location of the gene on a particular chromosome has been
determined and the mechanism of gene e xpression investigated.
A system of nomenclature proposed in 1987 has since been updated several times,
most recently in 1996. The accepted guidelines from nomenclature designate cyto-
chrome P450 genes as CYP (or cyp in the case of mouse genes). The CYP designation
is followed by an Arabic numeral to denote the gene family, followed by a letter
designating the subfamily. The individual isoform is then identified using a second
Arabic numeral following the subfamily designation. Polymorphic isoforms of genes
are indicated by an asterisk followed by an arabic numeral. If there are no subfamilies
or if there is only a single gene within the family or subfamily, the letter and/or the
second numeral may be omitted (e.g., CYP17). The name of the gene is italicized,
whereas the protein (enzyme) is not.
In general, enzymes within a gene family share more than 40% amino acid sequence
identity. Protein sequences within subfamilies have greater than 55% similarity in the
case of mammalian genes, or 46% in the case of nonmammalian genes. So far, genes
in the same subfamily have been found to lie on the same chromosome within the
same gene cluster and are nonsegregating, suggesting a common origin through gene
duplication events. Sequences showing less than 3% divergence are arbitrarily desig-
nated allelic variants unless other evidence exists to the contrary. Known sequences fit