CASE STUDIES IN PERFORMANCE MANAGEMENT phần 3 pot
Bạn đang xem bản rút gọn của tài liệu. Xem và tải ngay bản đầy đủ của tài liệu tại đây (505.63 KB, 28 trang )
the perception of the business centered on dollars per barrel, every-
thing was measured that way. What this led to was a culture of in-
creasing volume at all costs without an accurate understanding of
what it truly meant for the organization in terms of activities, costs, or
profits. This volume-based mentality led to significant inaccuracies in
product/service costing, often resulting in behavior that was contrary
to real bottom-line impact.
INTRODUCTION
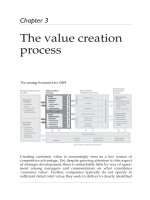
Like many lubrication companies in the mid-1990s, LubeOil Corp saw that the de-
mand for finished lubrication products was forecasted to exceed 300 million bar-
rels of product by the year 2005 (Exhibit 2.1). Believing that 60% of that demand
would be in emerging markets, such as Africa and the Middle East, LubeOil
wanted to understand what customers, products, and segments to focus on to cap-
ture as much of the market as possible to take over the number-one position in lu-
brication products worldwide. Understanding that it could no longer create
business strategy based on historical sales volumes, LubeOil shifted focus to a
small initiative getting little attention throughout the entire organization. That ini-
tiative was activity-based costing (ABC).
ORGANIZATIONAL ISSUES
Lubricants are one of the highest profit margin areas of LubeOil’s downstream
business. This product category includes items that are readily recognizable to re-
tail consumers, such as its flagship passenger vehicle lubricant, and thousands of
other industrial and commercial-grade lubricants. Uncharacteristically complex,
the lubricant business is an exception to the conventional pattern of the few-
products/high-volume oil industry. LubeOil is an integrated supplier of lubricants,
meaning that it possesses the technology and infrastructure for producing lubri-
cants from base components (i.e., crude oil and chemical additives) and delivering
finished products to end-customers. There are over 30,000 lubricant stock-keeping
units (SKUs) within LubeOil’s network with multiple raw material supply, man-
ufacturing, and distribution centers.
LubeOil operates lubricant businesses (called affiliates) in more than 60
countries with 40 manufacturing locations. Each country operates as an individual
affiliate. These individual entities are loosely collected into regional groupings,
22 LUBEOIL: SHAPING BUSINESS TODAY AND IN THE FUTURE
02_4611.qxp 1/23/06 12:46 PM Page 22
which in turn sum to the global business. The principal business metrics are at the
local affiliate level; profit and cost optimization occurs at this level.
The first ABC project at LubeOil and its results can be traced to the US Lu-
bricants Division in 1994, when its general manager, recognizing that the U.S.
business had thousands of SKUs and multiple manufacturing facilities, suspected
that the high degree of complexity was adding cost to his business. He wanted to
know the cost of the complexity—that is, the return for maintaining such a com-
plex business.
A respected consulting firm was hired to help analyze the situation. Focusing
at first on analyzing manufacturing complexity (the product dimension), the joint
LubeOil and consulting team quickly realized that the current cost accounting
system had no way of reflecting the cost of complexity, because it treated all
products equally. Stated simply, manufacturing costs of $80 million were volu-
metrically applied to the 250 million gallons of lubricants that were manufac-
tured. This method could not address cost to produce each product individually. At
LUBEOIL: SHAPING BUSINESS TODAY AND IN THE FUTURE 23
Emerging Markets Will Account for Approximately
60% of Global Demand by 2005 . . .
2005 Estimated Total World Demand
Total World Demand 275–300 Million Barrels
Africa
5%
USA/Canada
21%
Japan, Australia, NZ
7%
Western Eurpoe
15%
Eastern Europe/
Former Soviet Union
14%
Asia Pacific
26%
Latin America
8%
Middle East
6%
Exhibit 2.1 World Lube Demand 2005
02_4611.qxp 1/23/06 12:46 PM Page 23
this point, the team suggested using ABC methodology to better reflect the real costs
of producing the multiple product and package combinations within LubeOil’s lu-
bricant network.
ABC proved to be the perfect tool for identifying the cost of complexity in
LubeOil’s lubricant business. By using activity drivers instead of volume drivers,
ABC could expose fundamental differences in the costs of producing thousands of
product and package combinations.
In the past, when all costs applied to products based on volume, marketers
added products with a high degree of manufacturing complexity to the product
line by evaluating their economics on an incremental cost basis, believing that any
new volume, regardless of production complexities, would decrease the unit cost.
By applying costs using activity drivers instead, ABC exposed the weakness of the
old school of thought.
The results were startling. They created a stir within the organization and
were the start of a culture change. In surprisingly short order, the incremental vol-
ume/cost theory gave way to activity-based full cost theory. The view of manu-
facturing costs shifted from one pole to another within a matter of months.
Management liked what it saw and wanted to incorporate ABC into the every-
day decision-making processes. At this point, managers took a risk. Without fully
understanding the impact this new information would have on the decision makers
in the business, they decided to incorporate ABC into the single profitability report-
ing tool used to manage the business. The tool contained the data used to evaluate
all customer/product profitability. Every salesperson had access to it. The impact of
ABC was to change the view of profitability of all products within the reporting tool.
Reporting no longer reflected or rewarded indiscriminate volume growth. Enhanced
with ABC, LubeOil now rewards profitable growth or divestment.
Management’s risk paid off. In the years since adopting ABC into its profit
reporting, every business indicator has become more positive: profits, return on
capital employed (ROCE), manufacturing expense reduction. The only business
indicator with a negative trend is volume, which decreased slightly during this pe-
riod. Many years ago, this would have been anathema. LubeOil’s principal metric
had been volume growth for such a long time that even today some still have trou-
ble comprehending the change, and some still manage the business primarily to
optimize this metric. But an irrevocable culture change is under way. Profit focus
and business simplicity are the themes, and the business results are their tangible
manifestations. It would be incorrect to assume that ABC was the only factor con-
tributing to the positive business results, however. A multitude of other initiatives
along with ABC contributed significantly to the results: for example, the closing
of multiple manufacturing facilities with excess capacity. The impact of ABC
24 LUBEOIL: SHAPING BUSINESS TODAY AND IN THE FUTURE
02_4611.qxp 1/23/06 12:46 PM Page 24
must not be underestimated either. In many instances, ABC served as a catalyst for
decisions that would not have been made in prior years, including divesting of
large-volume/unprofitable businesses, reducing product line complexity, focusing
on target segments, and so on. This was the genesis of ABC at LubeOil.
CASE STUDY
Initial Efforts
In the mid-1990s, Chairman Lee Nevin announced a corporate-wide strategic goal
to become number one (most profitable) in the sale of lubricants worldwide. To that
end, a worldwide study was commissioned with the goal of achieving a 33% in-
crease in after-tax profits by the year 2000. The study recommended three broad
strategies: growth, cost reduction, and a stronger competitive position. These strate-
gies, although not in themselves revolutionary, set the tone for LubeOil Corpora-
tion’s lubricant business to begin developing tactical initiatives that would support
these strategies. Growth and cost reduction were strategies that were very familiar
to all of LubeOil’s employees; the third strategy, strengthening competitive position,
was not. To achieve this, they needed to leverage their company’s global nature by
identifying and sharing internal best practices used in the business around the world
and creating a more efficient global manufacturing and marketing organization.
ABC was one of the key best practices identified by the study, based on the
record of accomplishment set by the U.S. affiliate, which had already imple-
mented ABC and increased profits through improved business decision making
and a change in culture. The study also suggested that this best practice be shared
throughout the company’s entire lubricant network with the intent of producing
beneficial results similar to those achieved in the U.S. business. Subsequently, a
team was chartered to develop a global ABC model template and determine the
best method to implement ABC throughout the multiple affiliates. Later that year,
a team comprised of members from multiple global regions met in Europe to de-
velop a global model template and develop an implementation plan with
costs/benefits and a timeline.
The team also evaluated many ABM software products. They selected an off-
the-shelf software package called Oros (today called SAS Activity-Based Man-
agement) by ABC Technologies (now SAS), for several reasons: their U.S.
experience with the package; the recommendation of a respected consulting firm;
and the features and performance characteristics of the software. Two initial pilot
sites were chosen: LubeOil Korea and LubeOil Brazil.
LUBEOIL: SHAPING BUSINESS TODAY AND IN THE FUTURE 25
02_4611.qxp 1/23/06 12:46 PM Page 25
Oros was selected due to several key features. It was important to choose an
ABM package that would be suitable for a pilot project but also scale as the needs
of the corporation changed. The most important capabilities in the software pack-
age were the way that it handled multiple dimensions of segmented cost objects,
the ability to access legacy data on the back end, and the flexibility it had in meet-
ing LubeOil’s reporting needs.
Pilot Phase
Korea and Brazil were chosen because of the size of their businesses in terms of
volume/revenue and complexity. Both affiliates were medium size with moderate
business dimensional complexity (i.e., a manageable number of market segments,
customers, and products). The original global ABC model template was divided
into two parts: Sales and Marketing and Manufacturing. The two parts would be
brought together into one model to enable dimensional analysis. Later, the tem-
plate would be expanded to include shared services.
For the initial pilots, the decision was made to implement the manufacturing part
only in Korea and Brazil. At that time, ABC was still perceived mainly as a product
costing tool, and the implementation team concluded that driver quantities would be
easier to obtain and validate (or defend) in manufacturing. The goal was to leverage
the success of manufacturing ABC to promote the Sales and Marketing portion.
These pilots were conducted concurrently in late February 1997. Both were one
month long and involved 15-hour days, conquering language barriers, flying tens of
thousand of miles between São Paulo and Seoul, and both were hugely successful.
Korea proved to be the most dramatic example of ABC’s success. The affili-
ate was wrestling with a decision to divest a large portion of its business because
of its apparent lack of profit. The traditional cost accounting that applied all man-
ufacturing costs to products volumetrically suggested that a designer lubricant com-
prising nearly 20% of the total affiliate volume was losing money. In lubricant
manufacturing, however, there is tremendous variability in the effort, time, and
capital required to manufacture equivalent volumes of various products. Activity-
based analysis revealed that a specialty lubricant was among the simplest and least
expensive to manufacture on a unit basis. The existing cost accounting overstated
production costs for the designer lubricant by 300%. This was a real eye-opener as
it corroborated the intuition that the designer lubricant business was profitable in
Korea. The affiliate had grown in volume in the last few years, mostly in the de-
signer product segment—production unit costs had decreased, and profits had in-
creased nearly 100% over that period. ABC analysis helped explain these results.
26 LUBEOIL: SHAPING BUSINESS TODAY AND IN THE FUTURE
02_4611.qxp 1/23/06 12:46 PM Page 26
What would have happened to cost/profit trends if the affiliate had grown in
the most complex, expensive-to-manufacture products and segments? A similar
relationship between manufacturing complexity and costs was seen in the Brazil-
ian pilot.
Global Implementation Phase
Project Team
In creating the ABM team, LubeOil needed to include people with a variety of
skills. For example, as well as a project lead, managers felt they would need an im-
plementation specialist, a technical expert, and each region would need a part-time
regional project lead.
• Worldwide Project Lead (WW). LubeOil headquarters employee re-
sponsible for all project deliverables, model design, benchmarking tem-
plates, and team design.
• Regional Project Lead (RL). Part-time LubeOil regional employee respon-
sible for all the deployment and localization issues for the regional models.
• Local Team (RL) (Lead and one or two Analysts). LubeOil local em-
ployees responsible for getting data, assisting with the model build, and on-
going model maintenance.
• Two Full-time Implementations Specialists (WW Contracted). LubeOil
concluded that the software vendor had the best resources for assisting in
the model build at each site. Therefore, two implementation specialists
from the software vendor were contracted on a full time basis to travel the
globe and assist on the technical side of the model development.
• One Full-time Implementation Specialist (WW Contracted). After the
pilot and first implementation, the team decided that it would also contract
a senior technical support specialist from the software firm to exclusively
handle all technical support calls from LubeOil.
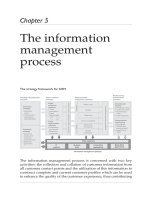
Planning and Design
The pilot phase of the project helped shape the model design and also provided
LubeOil with several key deliverables that were identified. Progress would be
tracked to each one in four phases over two years (Exhibit 2.2).
The first and most important step was to roll out the ABM models and im-
plement them at 38 lube manufacturing facilities around the globe. After LubeOil
LUBEOIL: SHAPING BUSINESS TODAY AND IN THE FUTURE 27
02_4611.qxp 1/23/06 12:46 PM Page 27
28
P&L
Impact Timeline
P1: Getting the Process Under Control (Building a Baseline of the Business)
LOW
Time “0”
a. Basic Training of local affiliate personnel in ABC Methodology, ABC/M Software
LOW
b. Snapshot implementation of ABC (Products, Customers, Segments)
LOW
c. Evaluation of Results
LOW
d. Model Validation
LOW
e. Define Interfaces to transactional systems (SAP, JDE, etc.)
LOW
f. Define Standard Reports
LOW
P2: Automation/Standardization/Access (Building a Reliable/Reproducible/Useful Model)
LOW
a. Creating a repeatable model building process
LOW
b. Building standard reports
LOW
c. Ensuring standardization to global models
LOW
d. Advanced training
LOW
P3: Local Decision Making (Using ABC Information to Improve the Bottom Line)
HIGH
Year 1
a. Giving access to user base
HIGH
b. Profit-focused marketing using ABC information (profitable segments, customers, products)
HIGH
c. Cost reduction using activity information (valued added versus non–value-added activities)
HIGH
P4: Network Decision Making (Using ABC Information to Improve the Bottom Line)
HIGH
a. Regional/global network building and benchmarking/best practices sharing
HIGH
b. Network sourcing of product based on ABC manufacturing costs—network optimization
HIGH
c. Measurement/change of global segment strategy using ABC information
HIGH
Year 2
Exhibit 2.2 Phases of the LubeOil Global ABC Implementation
02_4611.qxp 1/23/06 12:46 PM Page 28
identified the regional leaders, an agreement was made that the model design tem-
plate was sufficient to begin the rollout. Localization issues would be taken into
consideration at each affiliate during the implementation. Two implementations
would be done in parallel, and each would take three to four weeks at each local
facility, depending on its size and complexity. The basic implementation process
would follow a simple flow (see Exhibit 2.3): identify resources; complete the
manufacturing activities first; follow with the sales and marketing activities; in-
corporate shared services if necessary (local issue); bring in the customers, prod-
ucts, and segments; and finish off with the assignment rules.
Resources, in all cases, were grouped into categories, and assignment rules
would be created by the cost and profit centers in each category. Those categories
were sales region, engineering, marketing, sales development, technical support,
and customer service.
The manufacturing methodology (see Exhibit 2.4) differed from the sales
methodology (see Exhibit 2.5) in most phases of the model. The resource module
used both primary resources and secondary pools. Secondary resources were
grouped into three types: plant management, administration, and planning. Sec-
ondary resources were also grouped into three cost pools: blending, filling, and
warehousing. The processes in the activity module were split into three main
areas: setup, machine, and warehouse occupancy. Those costs could then be easily
LUBEOIL: SHAPING BUSINESS TODAY AND IN THE FUTURE 29
Manufacturing Activities
Product
Segment
Customer
Resources
(Expenses)
Sales & Marketing
Activities
OROS ABC
(now SAS ABM)
Review Information,
Target Opportunities,
Evaluate Strategies
Make Decisions . . .
Parallel Implementation
Exhibit 2.3 ABC Implementation Process: Three to Four Weeks
02_4611.qxp 1/23/06 12:46 PM Page 29
assigned into product and product package combinations in the cost object mod-
ule. The manufacturing section of the model lent itself to using drivers that were
easily extracted from existing enterprise resource planning systems, such as SAP
and JD Edwards.
30 LUBEOIL: SHAPING BUSINESS TODAY AND IN THE FUTURE
Resource
Conventional
Activity Based
Resource
Activities Cost Objects
Cost Objects
Cost Driver
(Actual time, Volume)
e.g.,
Manpower, Depreciation
Shared Service
e.g.,
Setup Time
Machine Time . . .
e.g.,
Lubricant 1
Lubricant 2 . . .
Activity Driver
(Blending Volume, #setup, etc.)
Cost Driver
(Volume)
Exhibit 2.4 Manufacturing Methodology
Resource
Conventional
Activity Based
Resource
Activities Cost Objects
Cost Objects
Cost Driver
(% of time, FTE, Volume)
e.g.,
Manpower,
Shared Service
e.g.,
Sales Maintenance
Sales Development . . .
e.g.,
Customer
Market Segment
Activity Driver
(% of time)
Cost Driver
(Volume, FTE)
Exhibit 2.5 Sales and Marketing Methodology
02_4611.qxp 1/23/06 12:46 PM Page 30
By choosing a system like Oros, LubeOil had the flexibility to use these dif-
ferent modeling techniques. Some of these modeling techniques were resource to
resource assignments and consumption-based assignments for the drivers that
used setup and machine time and traditional ABM assignments for sales and mar-
keting drivers like full-time equivalent (FTE) and number of sales calls. The
shared services methodology (see Exhibit 2.6) was completely different, using
many types of activity-to-activity assignments to represent departments that sup-
ported each other in a shared service environment.
The sales and marketing methodology (Exhibit 2.5) would not use primary
and secondary resources; all resources would be grouped into seven distinct
groups for assignment: sales region, engineering, marketing, sales development,
technical support, customer service, and marketing. Unlike the manufacturing
section of the model, the sales and marketing section would have six processes
rather than three: sales maintenance, engineering calls, distributor calls, order
taking, market research, and advertising. The cost objects that would receive
these costs would be market segments and customers and some brand advertising
costs.
LUBEOIL: SHAPING BUSINESS TODAY AND IN THE FUTURE 31
Secondary
Resource
Activity Based
Resource Resource
IT Fuels
HR Lubes Location 2
Location 1
Cost Driver
(%, FTE)
Cost Driver
(%, FTE)
Exhibit 2.6 Shared Services Methodology
02_4611.qxp 1/23/06 12:46 PM Page 31
Shared services costs (Exhibit 2.6) were ultimately broken out into the type of
business (resource pools) they supported, either fuels or lubes, and then finally
into the locations that used them. Once those pools were assigned by percentage
to the final location that used them, they could be assigned out based on either the
manufacturing or the sales and marketing methodology. For all intents and pur-
poses, the shared services section was simply an input into the other two main sec-
tions of the model.
Beyond the initial race to implement at all of the manufacturing facilities, six
key deliverables were identified at a midimplementation planning summit in Brus-
sels, Belgium, attended by all members of the worldwide team and regional lead-
ers. Those items were:
1. Identify and implement ABM at ten key lube distributor sites.
2. Assess the applicability of implementing for LubeOil Fuels affiliates.
3. LubeOil’s own chemical division was its biggest customer. Implement-
ing at the chemical division could identify product pricing opportunities
for the much-needed base stocks.
4. Develop a plan to incorporate ABC into other LubeOil downstream busi-
ness units: chemicals, films, and so on.
5. Use ABC information to build a global lubes business/profit plan for 1999.
6. Build a global ABC benchmark template using ABC data; develop an
ABC benchmarking database and deploy to an Internet portal to leverage
benchmark information between affiliates; share ABC success stories—
examples of ABC use to increase profits—between affiliates.
Initial Benefits
By the end of the fourth quarter of 1998, initial results were on track. By the year
2000, LubeOil attained its goal of becoming the number-one lube company in the
world. In 1998, 34 of the 36 affiliates were completed, 2 fuels affiliates were
completed, and the chemical division implementation was started. The ABM was
later put on hold, due to a SAP R/3 rollout. In 1999, after the SAP rollout, the ABM
project was re started and completed in the first quarter of the year 2000.
Using ABC information to build the 1999 and 2000 profit plan proved to be
a success. By using ABC to validate their marketing plans and focus on unprof-
itable segments use, after-tax profits in 2000 soared (see Exhibit 2.7).
32 LUBEOIL: SHAPING BUSINESS TODAY AND IN THE FUTURE
02_4611.qxp 1/23/06 12:46 PM Page 32
Changing the paradigm from making decisions based on volume-related
gross/variable margins to volume- and activity-related net margins would be the
biggest culture change resulting from the ABM project. At the beginning of the
implementation, all decisions were made at a gross and variable margin report.
The reports (based on traditional volume-related allocations) lacked credibility.
More than 50% of LubeOil’s controllable expenses occurred at the net margin.
The benchmark template (see Exhibit 2.8) using ABC data was determined to be
a credible solution to this problem. Creating the models would be a critical step,
but it was widely believed that unless the reports could be deployed to the decision
makers, ABM at LubeOil would fizzle and die. The WW project lead decided that
sharing this report through an Internet portal to all local affiliates and stakehold-
ers was a perfect solution. Along with benchmarking best practices between local
affiliates, the nature of the report allowed LubeOil management to use the bench-
mark template and additional benchmark data (see Exhibit 2.9) as a scorecard to
manage affiliate performance.
LUBEOIL: SHAPING BUSINESS TODAY AND IN THE FUTURE 33
Geographic
expansion
Acquisition
Joint Venture
Segment-
Focused Market
Enhanced EB
relationships
Profit-focused
best practices
Brand
Manufacturing
and Base Stock
Additives
and Packages
Efficiency
and Cost
Strengthen competitive position
Gain efficiencies/
reduce costs
Grow the core
business
$600
Million
$400
Million
1995 2000
After-Tax Profit
Exhibit 2.7 Lube Oil Profit Plan
02_4611.qxp 1/23/06 12:46 PM Page 33
34
*All re
venue/cost in USD/BBL
Affiliate
Vol
ume
(BBL)
Realization
Raw
Material
Accounting
Gross
Margin
Lube Oil
Blending
Plant Cost Distrib
ution
Deliv
ered
Gross
Margin
Sales and
Marketing
Advertising
Net
Mar
gin
Local Affiliate 1
6,202,039 150.5 85.7 64.8
8.6
11.1 45.1 21.8 6.2 17.1
Local Affiliate 2
1,025,109 162.2 94.6 67.6
17.5 16.6 33.6 19.7 6.1
7.8
Local Affiliate 3
832,344 166.6
84.9
81.7 20.5 11.5 49.6
22.9 5.9 20.7
Loc
al Affiliate 4
489,227 135.9 92.2 43.7
8.3
9.7 25.7
9.6
4.0 12.2
Local Affiliate 5
368,164 188.9 105.8 83.1
7.9 2.9
72.2 21.1
1.7 49.3
Local Affiliate 6
91,373
219.8
87.5
132.3
30.8 4.9
96.7
71.7 14.2 10.8
Affiliate
Weighted Av
erage
154.8 87.8 67.0 10.9 11.3
44.8 21.5 5.9 17.4
Re
g
ional Grou
p
in
g
487,164 193.0 113.0 80.0
28.0 4.0 48.0 38.0 14.0
-4.0
VA RIANCE
TO AVG
38.2 -25.2 13.0 -17.1 7.3
3.2 -16.5 -8.1 -21.4
Period: Full Year 1997 (2)
BENCHMARKT
EMPLATE #1
ABC Profit V
alue Chain
Affiliate: V
arious Global
Sort Criteria: Total Lube Business
Exhibit 2.8 Global Benchmark Template (LubeOil Scorecard)
02_4611.qxp 1/23/06 12:46 PM Page 34
Lessons Learned: Initial Study
At the end of 2000, it had already been noted that ABC returns no bottom-line
profits unless action is taken by management and line personnel. The ABM team
learned a significant number of lessons, and it took actions against each one. The
result was LubeOil’s becoming the number-one lubricants company in the world.
The following are a list of the lessons learned by the ABM team:
• Highlight and act on opportunities for cost reduction. By highlighting
best practices between global affiliates, deploying them on the benchmark
template, and scoring and managing affiliates based on that data, more op-
portunities for cost reduction were found.
• Categorize segment/customers/product combinations. Deploying re-
sults in a segmented grid allowed management to develop action plans and
strategies to facilitate more cost reduction, price increases, and outsource
and divesting decisions to improve profitability.
• Optimize logistics operations. More efficient affiliates and plants were
identified, which facilitated plant closures and transfer of production to ef-
ficient manufacturers. The most efficient distribution sources were also
identified and used.
• Link ABM to performance management. Surfacing benchmark data as
a scorecard made these changes possible. LubeOil was one of the earliest
adopters of the balanced scorecard. In Balanced Scorecard: Translating
LUBEOIL: SHAPING BUSINESS TODAY AND IN THE FUTURE 35
Package
11%
Blending/
Filling
5%
Advertising
Marketing
Distribution
Production
Product
Transportation/
Distribution
8%
Thruput
5%
16%
Aff 1 Aff 2 Aff 3
Region
Affiliate Cost Structure (%) Regional Cost Structure (%)
Aff 4 Aff 5 Aff 6
Advertisement
4%
Product
51%
1.4
1.2
1
0.8
0.6
0.4
0.2
0
Exhibit 2.9 View of the Affiliates’ Cost Structure Used to
Illustrate LubeOil’s ABC Global Benchmark Data
02_4611.qxp 1/23/06 12:46 PM Page 35
Strategy into Action, authors Robert S. Kaplan and David P. Norton state: “We
are confident that innovating companies will expand the structure and
use of the scorecard.”
1
LubeOil, which was truly innovative with its early use
of the scorecard, was able to reap more benefits than simply running an ABC
project and hoping that it would receive cost savings on a silver platter.
• Design a decision-making process. Early on in the project, there was a
general feeling that when the models were complete, there would be a pot
of gold at the end of the rainbow. This is a common misperception. Once
the model is complete, a strategy should be put in place to use the ABM
data to make decisions. LubeOil designed a simple set of rules (see Exhibit
2.10) to follow once it found that it had better cost/profit information. Re-
viewing ABM data at each step of the process has rewarded LubeOil with
substantial growth.
Next Steps: Initial Study
Ten “next steps” for the coming years follow.
1. Continue the validation of existing models.
2. Provide reports to regions.
3. Assess existing strategy in light of new information.
4. Access capability/fit within organization.
• Management Information Services/Segmentation/ABC (redundancies
and best sources)
5. Develop ownership and update process and procedures.
6. Develop training program for interested parties.
7. Give more access to stakeholders.
8. Assess and deploy resources to continue use of tool.
9. Develop future models.
10. Run an ABM strategy-building workshop.
It is always interesting to look back. At the end of 2000 there were a number
of items identified as “next steps” considered to be critical for long-term success.
As with every implementation of ABC, it is an iterative process, models will be
continually validated and reporting will continue to be pushed out to the people
who can make decisions.
36 LUBEOIL: SHAPING BUSINESS TODAY AND IN THE FUTURE
02_4611.qxp 1/23/06 12:46 PM Page 36
In the book Performance Management: Finding the Missing Pieces (to Close
the Intelligence Gap), Gary Cokins highlights how the key to using business in-
telligence is “Alignment.”
2
Cokins mentions this concept frequently and illus-
trates how truly important it is to align employee behavior with a strategy.
LubeOil’s decision to take ABM benchmark data and link it to performance to
change employee behavior is one of the keys to its early success. It is a challenge
to get employees to make strategy part of their job. The early scorecards that
LubeOil used were prime examples of how a “communication tool” can be used
to shape an organization.
Current State: Today and Beyond
Mergers of large multinational oil companies began in the late 1990s, although con-
sumer and environmental groups warned that the growing concentration of power
and wealth of the oil industry is unsafe for the environment, communities, and con-
sumers worldwide. California-based Chevron Corporation agreed to acquire Tex-
aco for about $36 billion in stock, creating the world’s fourth-largest oil company.
The acquisition came at a time when crude oil prices hit their highest level in a
decade, and oil company profits have skyrocketed. Later British Petroleum,
Amoco, and ARCO received clearance from the U.S. Federal Trade Commission
to combine their companies. The union will create a corporate group worth some
$200 billion. To compete in this increasingly consolidated market, LubeOil also
participated in a multibillion-dollar merger. ABM and these performance manage-
ment tools and business reporting models helped shape the new organization.
LUBEOIL: SHAPING BUSINESS TODAY AND IN THE FUTURE 37
Step 1
Reduce
Costs?
Ye s
OK
No
Step 2
Raise
Prices?
Ye s
OK
No
Step 3
Fit to
Strategy?
Ye s
Reevaluate
from Step 1
No
Step 4
Outsource/
Divest
A last
resort only
“This is a continual process.”
Exhibit 2.10 Cost Reduction Process Rules
02_4611.qxp 1/23/06 12:46 PM Page 37
Today LubeOil has ABM strategically embedded into its reporting process and is
able to make many of its strategic decisions based in this information.
EXPERT WRAP-UP
Thomas M. Kang
As at Mobil, the key tools that LubeOil implemented to transform
the culture of volume at all costs were balanced scorecard (BSC) and
activity-based costing. These tools revolutionized performance
management at LubeOil, and, I believe, the resulting change in cul-
ture and behavior had a profound impact on the bottom line. Activ-
ity-based costing allowed us to better understand our product and
service offerings in terms of their consumption of activities and gave
us good insight into what drives these activities and costs. In many
instances, volume was clearly the wrong answer. At LubeOil, ABC
proved to be a catalyst for real culture and behavior change and
served as meaningful input for comprehensive performance mea-
surement tools, such as the BSC. When used together, I believe that
ABC and BSC clearly provide a system of performance measurement
that is
meaningful, accurate, and aligned
.
Of course, all of this sounds good, but there is a major hurdle to
implementing these performance management tools: existing organi-
zational culture of performance management and a resistance to
change. Without real commitment from senior management and a sus-
tained focus on continuing to drive implementation of these tools, get-
ting real results will be difficult. In embarking on any real culture
change initiative, there are pitfalls to avoid and necessary components
that you must have in order to have a good likelihood of success.
ENDNOTES
1. Robert S. Kaplan and David P. Norton, The Balanced Scorecard: Translating
Strategy into Action (Boston: Harvard Business School Press, 1986), preface.
2. Gary Cokins, Performance Management: Finding the Missing Pieces (to
Close the Intelligence Gap) (Hoboken, NJ: John Wiley & Sons, Inc., 2004),
preface.
38 LUBEOIL: SHAPING BUSINESS TODAY AND IN THE FUTURE
02_4611.qxp 1/23/06 12:46 PM Page 38
39
3
HOMEHEALTH: DELIVERING
ACTIVITY-BASED COSTING
When a paradigm shifts everyone goes back to zero; your past success
guarantees you nothing.
—Joel A. Barker, Future Edge: Discovering New Paradigms in Success
FOREWORD
John A. Miller
This case study is instructive in many ways and demonstrates the
key principles of an effective activity-based costing (ABC) imple-
mentation. It is fair to say that HomeHealth was one of the pioneers
in the history of ABC. This project was initiated in the mid-1990s,
about the same time as the American Productivity & Quality Center
(APQC) and CAM-I jointly launched a best practice study in the
then emerging area of ABC.
1
At that time, it was estimated that only
about 5,000 organizations had undertaken an ABC initiative. Most
were manufacturing companies that were using the ABC cost trac-
ing methods and techniques to determine their product cost more
accurately. Only a handful of manufacturing and a few service or-
ganizations were going beyond product cost and using activity-
based information to help them improve processes and business
performance. HomeHealth was one of those service organizations
that undertook ABC to help improve their business performance.
The best practice study, published in 1995, captured the com-
bined knowledge and resources of the APQC and CAM-I, sponsor-
ship by more that 60 leading companies, involvement by 6 subject
matter authorities (including 2 from academia), 167 organizations
willing to complete a detailed survey of ABC, and 15 best practice
companies sharing their insights and knowledge. One of the key
contributions of this study was the documentation of the ABM Value
03_4611.qxp 1/23/06 12:47 PM Page 39
Cycle, which specified applications of activity-based information in
the areas of improvement initiatives, decision making, and perfor-
mance measurements. The application at HomeHealth is in the area
of improvement initiatives and could be classified as a process im-
provement application or a cost reduction application.
The main purpose of this section is to identify and document
some of the best practices discussed in the survey (which still apply
today) for ABC and to use the case study to demonstrate how they
were used at HomeHealth. Best practices include:
• Business reason for doing ABC. At HomeHealth, the key business
and challenges were to reduce cost, maintain quality, and im-
prove access. The ABC model was positioned as a tool to meet
these challenges.
• Pilot test to confirm value and usefulness to the organization. At
HomeHealth, two pilot efforts were undertaken. Immediately after
the first pilot, a second pilot was necessary to fully convince
HomeHealth management of value, before commencing a full
scale, agency-wide ABC system
• Balanced project resources, timelines, and scope of work. Any
ABC project can be implemented, regardless of scope, provided
the due date allows for sufficient time and resources to meet the
requirements. What work has to be done and how long it will take
is specific to the scope of the work. At HomeHealth, the scope of
work (agency wide), timeline (19 months), and resources (5 to 7
cross-functional teams, including any consultants, dedicated 25 to
100% to the project) were balanced to achieve the project com-
pletion date.
• Consistent application of ABC/M methodology. Best practice
companies consistently apply generally accepted activity-based
costing/methodology (ABC/M methods), procedures, terms, and
techniques and adapt them to their specific requirements. Exam-
ples include consistent use of the CAM-I Basic Model, the CAM-I
Glossary of ABC/M terms and definitions, tested data collection
methods and techniques, generic process classification frame-
work, and general and industry specific activity dictionaries. At
40 HOMEHEALTH: DELIVERING ACTIVITY-BASED COSTING
03_4611.qxp 1/23/06 12:47 PM Page 40
HomeHealth, managers and employees were trained in the basic
principles and methods of ABC, and consistently used the CAM-I
Cross (basic model) within the organization. It is doubtful that any
kind of activity dictionary existed for the healthcare industry at the
time of this initiative, and HomeHealth would have had to de-
velop its own from scratch.
• Management commitment and priority. Management commit-
ment is defined as level of ABM sponsorship, breadth and scope
of training, ABM project implementation resources, level of man-
agement involvement, and use of consultants or other outside re-
sources when required. The HomeHealth ABC initiative had a
high level of management commitment and priority. Sponsorship
included director-level managers who sat on the ABC/M oversight
committee, adequate resources in a three- to four-person full-time
equivalent (FTE) implementation team, and outside support at pro-
ject initiation and ongoing as required.
• Ongoing, cost-efficient, and reliable ABM systems required. Ab-
sent an ongoing system to report ABC information, the project ef-
fort is limited to a one-time study, for a specific period in time. Best
practice companies place significant emphasis on installing the
systems, procedures, and methods necessary to collect and report
activity-based information on an ongoing basis. The systems, pro-
cedures, and methods that are installed are responsive to the needs
of the users, easy to update and maintain, and reliable. Best prac-
tice companies have learned that the systems and software aspect
of the ABM implementation cannot be ignored; in fact, it must be
emphasized. ABM system design considerations include purpose
and use, accuracy required, frequency of update, and relevance.
Overall, the HomeHealth ABC implementation would have
qualified as a best practice in 1995. In these early days HomeHealth
had a business reason for doing ABC, expected to see value, and re-
quired pilot tests to demonstrate that value. Management commit-
ment and priority were demonstrated by the assignment of resources
to the implementation and the willingness to provide outside sup-
port and training to the ongoing ABC system.
HOMEHEALTH: DELIVERING ACTIVITY-BASED COSTING 41
03_4611.qxp 1/23/06 12:47 PM Page 41
INTRODUCTION
Faced with rapidly changing customer requirements, a new governmental reim-
bursement methodology, and increased competition from national for-profit
chains, home healthcare agencies are finding that their traditional methods for
fiscal and operational decision making are no longer adequate. Activity-based
costing/management (ABC/M) provides a more accurate way for a home health-
care agency to reduce costs while maintaining quality and improving customer
access.
What is home healthcare? “Home care” is a generic term that encompasses a
variety of health and social services. These services most commonly consist of
nursing; physical, occupational, respiratory, and speech therapy; social service; di-
etitian; phlebotomy; and assistance with personal care and activities of daily liv-
ing needs. Services are delivered at home to recovering, disabled, and chronically
or terminally ill persons. Generally, home care is provided whenever a person
prefers to stay at home but needs ongoing care that family and friends alone can-
not provide easily or effectively.
ORGANIZATIONAL ISSUES
The HomeHealth (HH) Network is the not-for-profit home care agency of a
large Presbyterian-Medical Center located in the Midwest and providing home
health services to individuals in a major metropolitan area and five surrounding
counties. Founded in 1975, the HomeHealth Network was the first hospital-
based home care agency in its area. The network consists of an intermittent
home health agency, which is Medicare certified and state licensed; a personal
care service agency consisting of home health aides and homemakers; and an
older adult program that provides services such as evaluation, community refer-
rals, emergency alert, and programming to support healthy living. In addition,
HomeHealth has seamless linkages with providers of infusion therapy pharmacy
and supplies, medical equipment, home physicians, and hospice. Since its
founding, HomeHealth has grown to the point where, at the time of the ABC
project, it was visiting over 141,000 homes per year and taking in over $17.5
million of gross revenue annually. One dynamic that made evaluating the busi-
ness unique was that 89% of the payers that HomeHealth dealt with were
governmental.
42 HOMEHEALTH: DELIVERING ACTIVITY-BASED COSTING
03_4611.qxp 1/23/06 12:47 PM Page 42
CASE STUDY
Initial Efforts
During the 33 years since Medicare began paying for home health services, the
business of home healthcare has become highly regulated but remains a “cottage in-
dustry.” Although the professional care delivered to patients is consistent from one
agency to another, there is wide variation in people and material resources, opera-
tional functions, and measurements and performance standards. Knee-jerk responses
to regulatory oversight have resulted in the addition of positions, processes, forms,
and activities in an attempt to “fix” the deficiency. This quick-fix mentality has led
to a situation where structures are hierarchical and complex, processes are overly
complicated and expensive, and outcomes are inconsistent and variable, and do not
always serve the needs of customers. Today’s challenge for home health agencies is
to reduce their costs, maintain quality, and provide services that satisfy the needs and
wants of customers. This task is formidable, as most home care agencies have no
method for knowing what each process or activity costs and therefore no way to pri-
oritize cost reductions or process improvements. Home care’s traditional costing
methods can provide information about cost per visit, aggregated cost (all disci-
plines), cost per discipline (e.g., cost of a nursing visit), or cost per episode (from ad-
mission to discharge). However, home care agencies need intelligence that is more
specific to make appropriate operational and strategic decisions that will assure sur-
vival in our uncertain future. HomeHealth was presented three key challenges; an
ABC/M project was proposed as a method to respond to those challenges.
Challenges
1. Reduce cost.
• For reimbursement changes.
2. Maintain quality.
• “Quality” as defined by our customers.
3. Improve access.
• Provide services that focus on the needs and wants of our customers.
Responding to the Challenges
• Target high-cost processes for improvement.
• Identify what causes cost to vary.
HOMEHEALTH: DELIVERING ACTIVITY-BASED COSTING 43
03_4611.qxp 1/23/06 12:47 PM Page 43
• Eliminate what our customers do not want.
• Monitor and improve performance.
• Price services appropriately.
• Make the right program decisions.
• Provide better customer service.
Pilot Phase
HomeHealth initiated an ABC project, the initial goal of which was to determine
if ABC could assist in identifying high-cost activities that would benefit from
reengineering or process improvement. In the beginning the idea was to have one
pilot project and then roll out ABC/M across the entire company.
Immediately following the first pilot and still needing to be convinced, the
care delivery managers asked for an ABC analysis of the admission process. This
question was posed: Does the cost of a nursing admission vary by type of service
provided? The types of admissions examined were infusion/high-tech admissions,
maternal/child health admissions, psychiatric admissions, admissions for physical
therapy, and traditional admissions.
The result was two separate pilot projects focusing on two different goals.
Pilot Project 1
The first ABC project was limited to the referral intake process. Two questions
were asked: (1) What is the cost of preauthorizing managed care referrals? (2)
What is the cost of referral intake from various referral sources?
The staff was telling management that preauthorizing managed care referrals
was cumbersome and time consuming. To control costs and assure that only au-
thorized services are provided to enrollees, managed care companies (health main-
tenance organizations [HMOs] and preferred provider organizations [PPOs]) have
required healthcare companies to call a case manager for approval before provid-
ing services. Home care agencies must receive approval to do an evaluation visit
in the home and then report their findings before additional visits are approved.
Without visit authorization, agencies risk denial of payment for services provided.
Using ABC, it was discovered that nearly 20% of all referrals required preau-
thorization, a statistic that was previously unknown. It also was found that preau-
thorization added nearly $36 to the cost of each referral. To place that finding in
perspective, managed care companies have negotiated a rate of $55 to $60 per visit
and approve an average of six to seven visits. It was also discovered that 10% of
44 HOMEHEALTH: DELIVERING ACTIVITY-BASED COSTING
03_4611.qxp 1/23/06 12:47 PM Page 44
the average payment for a managed-care case was being used up by the cost of
preauthorization.
Management also wanted to know about the variation in referral intake costs
by referral source. It was found that costs varied widely. Commercial insurance re-
ferrals cost the most because they were required to negotiate rates on every case.
The Physician-Hospital Organization (PHO) referral costs were the lowest be-
cause they were the only home care provider. Therefore, literally no time was
spent in authorization. It was found that the activity of “accepting referrals” var-
ied by source. Physician office referrals were the most expensive because the
physician or his or her office staff was unfamiliar with the type of information
needed; they required coaching or callbacks to complete the referral. Referrals re-
ceived from hospital liaisons were the least expensive to accept because the work
was being done outside of referral services. However, by looking at the cost of the
referral intake “process,” it was found that the total cost of referrals received from
hospital liaisons was three times more expensive than the average referral cost. Li-
aison referrals were twice the total cost of referrals from physician offices. Faxed
or phoned referrals from discharge planners cost the least, but the faxed referrals
had downstream costs for data entry. Faxed referrals were hard to read and often
necessitated a return phone call for clarification. These findings led to an analysis
of the cost drivers of liaison activity and resulted in a redesign of liaisons’ jobs and
job activities. We also targeted the referral form used by discharge planners and
jointly developed a form that would be legible after faxing.
Pilot Project 2
Interviews with nurses identified five common activities: (1) scheduling or plan-
ning the care; (2) traveling to the home; (3) making the home visit; (4) document-
ing the results of the visit; and (5) coordinating care with others involved or
community resources. Management was able, for the first time, to identify the cost
of each of these activities. It found that documenting the admission visit cost
nearly as much as making the visit, something nurses had been telling manage-
ment for years.
Cost of Direct Nursing Admission Activities
• Plan patient care $ 2.37 to $ 4.02
• Travel $8.04
• Make home visit $32.23 to $63.29
• Coordinate care $ 8.19 to $15.92
• Document care $12.41 to $29.29
HOMEHEALTH: DELIVERING ACTIVITY-BASED COSTING 45
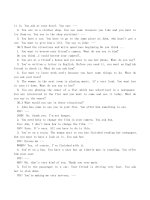
03_4611.qxp 1/23/06 12:47 PM Page 45
The infusion/high-tech admission cost (see Exhibit 3.1) was the highest cost,
followed by the maternal/child admission, the psychiatric admission, and tradi-
tional admission. The least costly was the admission for physical therapy. Further
analysis provided information about the activities that added to the cost of each of
these admissions. Each is being evaluated for the value it adds to the admission
process.
Rollout Phase: Initiating an Agency-Wide
Activity-Based Costing System
The pilot ABC projects demonstrated the value of ABC over the traditional cost
reporting method. Management decided to implement ABC across all aspects of
the organization. Representatives from each job class were asked to identify the
five to six major activities they perform. Whenever possible, their responses were
validated with existing data or verified by their supervisors. By adapting the
CAM-I Process Classification Framework (see Exhibit 3.2) to typical home care
46 HOMEHEALTH: DELIVERING ACTIVITY-BASED COSTING
Exhibit 3.1 Example Activity Costs
03_4611.qxp 1/23/06 12:47 PM Page 46