Data Mining Techniques For Marketing, Sales, and Customer Relationship Management Second Edition phần 2 pps
Bạn đang xem bản rút gọn của tài liệu. Xem và tải ngay bản đầy đủ của tài liệu tại đây (1.7 MB, 68 trang )
470643 c02.qxd 3/8/04 11:09 AM Page 41
The Virtuous Cycle of Data Mining 41
Sales (270,172)
Mass Mailing
(1,000,003)
Resp Calls
(16,453)
Resp Cards
(32,904)
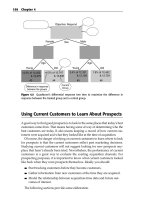
Figure 2.5 Prospects in the training set have overlapping relationships.
Be that as it may, success was defined as “received a mailing and bought the
car” and failure was defined as “received the mailing, but did not buy the car.”
A series of trials was run using decision trees and neural networks. The tools
were tested on various kinds of training sets. Some of the training sets
reflected the true proportion of successes in the database, while others were
enriched to have up to 10 percent successes—and higher concentrations might
have produced better results.
The neural network did better on the sparse training sets, while the decision
tree tool appeared to do better on the enriched sets. The researchers decided on
a two-stage process. First, a neural network determined who was likely to buy
a car, any car, from the company. Then, the decision tree was used to predict
which of the likely car buyers would choose the advertised model. This two-
step process proved quite successful. The hybrid data mining model combin-
ing decision trees and neural networks missed very few buyers of the targeted
model while at the same time screening out many more nonbuyers than either
the neural net or the decision tree was able to do.
The Resulting Actions
Armed with a model that could effectively reach responders the company
decided to take the money saved by mailing fewer pieces and put it into
improving the lure offered to get likely buyers into the showroom. Instead of
sunglasses for the masses, they offered a nice pair of leather boots to the far
470643 c02.qxd 3/8/04 11:09 AM Page 42
42 Chapter 2
smaller group of likely buyers. The new approach proved much more effective
than the first.
Completing the Cycle
The university-based data mining project showed that even with only a lim-
ited number of broad-brush variables to work with and fairly primitive data
mining tools, data mining could improve the effectiveness of a direct market-
ing campaign for a big-ticket item like an automobile. The next step is to gather
more data, build better models, and try again!
Lessons Learned
This chapter started by recalling the drivers of the industrial revolution and
the creation of large mills in England and New England. These mills are now
abandoned, torn down, or converted to other uses. Water is no longer the driv-
ing force of business. It has been replaced by data.
The virtuous cycle of data mining is about harnessing the power of data and
transforming it into actionable business results. Just as water once turned the
wheels that drove machines throughout a mill, data needs to be gathered and
disseminated throughout an organization to provide value. If data is water in
this analogy, then data mining is the wheel, and the virtuous cycle spreads the
power of the data to all the business processes.
The virtuous cycle of data mining is a learning process based on customer
data. It starts by identifying the right business opportunities for data mining.
The best business opportunities are those that will be acted upon. Without
action, there is little or no value to be gained from learning about customers.
Also very important is measuring the results of the action. This com-
pletes the loop of the virtuous cycle, and often suggests further data mining
opportunities.
TEAMFLY
Team-Fly
®
470643 c03.qxd 3/8/04 11:09 AM Page 43
and Best Practices
3
Data Mining Methodology
CHAPTER
The preceding chapter introduced the virtuous cycle of data mining as a busi-
ness process. That discussion divided the data mining process into four stages:
1. Identifying the problem
2. Transforming data into information
3. Taking action
4. Measuring the outcome
Now it is time to start looking at data mining as a technical process. The
high-level outline remains the same, but the emphasis shifts. Instead of identi-
fying a business problem, we now turn our attention to translating business
problems into data mining problems. The topic of transforming data into
information is expanded into several topics including hypothesis testing, pro-
filing, and predictive modeling. In this chapter, taking action refers to techni-
cal actions such as model deployment and scoring. Measurement refers to the
testing that must be done to assess a model’s stability and effectiveness before
it is used to guide marketing actions.
Because the entire book is based on this methodology, the best practices
introduced here are elaborated upon elsewhere. The purpose of this chapter is
to bring them together in one place and to organize them into a methodology.
The best way to avoid breaking the virtuous cycle of data mining is to
understand the ways it is likely to fail and take preventative steps. Over the
43
470643 c03.qxd 3/8/04 11:09 AM Page 44
44 Chapter 3
years, the authors have encountered many ways for data mining projects to go
wrong. In response, we have developed a useful collection of habits—things
we do to smooth the path from the initial statement of a business problem to a
stable model that produces actionable and measurable results. This chapter
presents this collection of best practices as the orderly steps of a data mining
methodology. Don’t be fooled—data mining is a naturally iterative process.
Some steps need to be repeated several times, but none should be skipped
entirely.
The need for a rigorous approach to data mining increases with the com-
plexity of the data mining approach. After establishing the need for a method-
ology by describing various ways that data mining efforts can fail in the
absence of one, the chapter starts with the simplest approach to data mining—
using ad hoc queries to test hypotheses—and works up to more sophisticated
activities such as building formal profiles that can be used as scoring models
and building true predictive models. Finally, the four steps of the virtuous
cycle are translated into an 11-step data mining methodology.
Why Have a Methodology?
Data mining is a way of learning from the past so as to make better decisions
in the future. The best practices described in this chapter are designed to avoid
two undesirable outcomes of the learning process:
■■ Learning things that aren’t true
■■ Learning things that are true, but not useful
These pitfalls are like the rocks of Scylla and the whirlpool of Charybdis that
protect the narrow straits between Sicily and the Italian mainland. Like the
ancient sailors who learned to avoid these threats, data miners need to know
how to avoid common dangers.
Learning Things That Aren’t True
Learning things that aren’t true is more dangerous than learning things that
are useless because important business decisions may be made based on incor-
rect information. Data mining results often seem reliable because they are
based on actual data in a seemingly scientific manner. This appearance of reli-
ability can be deceiving. The data itself may be incorrect or not relevant to the
question at hand. The patterns discovered may reflect past business decisions
or nothing at all. Data transformations such as summarization may have
destroyed or hidden important information. The following sections discuss
some of the more common problems that can lead to false conclusions.
470643 c03.qxd 3/8/04 11:09 AM Page 45
Data Mining Methodology and Best Practices 45
Patterns May Not Represent Any Underlying Rule
It is often said that figures don’t lie, but liars can figure. When it comes to find-
ing patterns in data, figures don’t have to actually lie in order to suggest things
that aren’t true. There are so many ways to construct patterns that any random
set of data points will reveal one if examined long enough. Human beings
depend so heavily on patterns in our lives that we tend to see them even when
they are not there. We look up at the nighttime sky and see not a random
arrangement of stars, but the Big Dipper, or, the Southern Cross, or Orion’s
Belt. Some even see astrological patterns and portents that can be used to pre-
dict the future. The widespread acceptance of outlandish conspiracy theories
is further evidence of the human need to find patterns.
Presumably, the reason that humans have evolved such an affinity for pat-
terns is that patterns often do reflect some underlying truth about the way the
world works. The phases of the moon, the progression of the seasons, the con-
stant alternation of night and day, even the regular appearance of a favorite TV
show at the same time on the same day of the week are useful because they are
stable and therefore predictive. We can use these patterns to decide when it is
safe to plant tomatoes and how to program the VCR. Other patterns clearly do
not have any predictive power. If a fair coin comes up heads five times in a
row, there is still a 50-50 chance that it will come up tails on the sixth toss.
The challenge for data miners is to figure out which patterns are predictive
and which are not. Consider the following patterns, all of which have been
cited in articles in the popular press as if they had predictive value:
■■ The party that does not hold the presidency picks up seats in Congress
during off-year elections.
■■ When the American League wins the World Series, Republicans take
the White House.
■■ When the Washington Redskins win their last home game, the incum-
bent party keeps the White House.
■■ In U.S. presidential contests, the taller man usually wins.
The first pattern (the one involving off-year elections) seems explainable in
purely political terms. Because there is an underlying explanation, this pattern
seems likely to continue into the future and therefore has predictive value. The
next two alleged predictors, the ones involving sporting events, seem just as
clearly to have no predictive value. No matter how many times Republicans
and the American League may have shared victories in the past (and the
authors have not researched this point), there is no reason to expect the associ-
ation to continue in the future.
What about candidates’ heights? At least since 1945 when Truman (who was
short, but taller than Dewey) was elected, the election in which Carter beat
470643 c03.qxd 3/8/04 11:09 AM Page 46
46 Chapter 3
Ford is the only one where the shorter candidate won. (So long as “winning”
is defined as “receiving the most votes” so that the 2000 election that pitted
6'1'' Gore against the 6'0'' Bush still fits the pattern.) Height does not seem to
have anything to do with the job of being president. On the other hand, height
is positively correlated with income and other social marks of success so
consciously or unconsciously, voters may perceive a taller candidate as more
presidential. As this chapter explains, the right way to decide if a rule is stable
and predictive is to compare its performance on multiple samples selected at
random from the same population. In the case of presidential height, we leave
this as an exercise for the reader. As is often the case, the hardest part of the
task will be collecting the data—even in the age of Google, it is not easy to
locate the heights of unsuccessful presidential candidates from the eighteenth,
nineteenth, and twentieth centuries!
The technical term for finding patterns that fail to generalize is overfitting.
Overfitting leads to unstable models that work one day, but not the next.
Building stable models is the primary goal of the data mining methodology.
The Model Set May Not Reflect the Relevant Population
The model set is the collection of historical data that is used to develop data
mining models. For inferences drawn from the model set to be valid, the
model set must reflect the population that the model is meant to describe, clas-
sify, or score. A sample that does not properly reflect its parent population is
biased. Using a biased sample as a model set is a recipe for learning things that
are not true. It is also hard to avoid. Consider:
■■ Customers are not like prospects.
■■ Survey responders are not like nonresponders.
■■ People who read email are not like people who do not read email.
■■ People who register on a Web site are not like people who fail to register.
■■ After an acquisition, customers from the acquired company are not nec-
essarily like customers from the acquirer.
■■ Records with no missing values reflect a different population from
records with missing values.
Customers are not like prospects because they represent people who
responded positively to whatever messages, offers, and promotions were made
to attract customers in the past. A study of current customers is likely to suggest
more of the same. If past campaigns have gone after wealthy, urban consumers,
then any comparison of current customers with the general population will
likely show that customers tend to be wealthy and urban. Such a model may
miss opportunities in middle-income suburbs. The consequences of using a
biased sample can be worse than simply a missed marketing opportunity.
470643 c03.qxd 3/8/04 11:09 AM Page 47
Data Mining Methodology and Best Practices 47
In the United States, there is a history of “redlining,” the illegal practice of
refusing to write loans or insurance policies in certain neighborhoods. A
search for patterns in the historical data from a company that had a history of
redlining would reveal that people in certain neighborhoods are unlikely to be
customers. If future marketing efforts were based on that finding, data mining
would help perpetuate an illegal and unethical practice.
Careful attention to selecting and sampling data for the model set is crucial
to successful data mining.
Data May Be at the Wrong Level of Detail
In more than one industry, we have been told that usage often goes down in
the month before a customer leaves. Upon closer examination, this turns out to
be an example of learning something that is not true. Figure 3.1 shows the
monthly minutes of use for a cellular telephone subscriber. For 7 months, the
subscriber used about 100 minutes per month. Then, in the eighth month,
usage went down to about half that. In the ninth month, there was no usage
at all.
This subscriber appears to fit the pattern in which a month with decreased
usage precedes abandonment of the service. But appearances are deceiving.
Looking at minutes of use by day instead of by month would show that the
customer continued to use the service at a constant rate until the middle of the
month and then stopped completely, presumably because on that day, he or
she began using a competing service. The putative period of declining usage
does not actually exist and so certainly does not provide a window of oppor-
tunity for retaining the customer. What appears to be a leading indicator is
actually a trailing one.
Minutes of Use by Tenure
0
20
40
60
80
100
120
140
12 34567891011
Figure 3.1 Does declining usage in month 8 predict attrition in month 9?
470643 c03.qxd 3/8/04 11:09 AM Page 48
48 Chapter 3
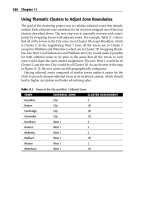
Figure 3.2 shows another example of confusion caused by aggregation. Sales
appear to be down in October compared to August and September. The pic-
ture comes from a business that has sales activity only on days when the finan-
cial markets are open. Because of the way that weekends and holidays fell in
2003, October had fewer trading days than August and September. That fact
alone accounts for the entire drop-off in sales.
In the previous examples, aggregation led to confusion. Failure to aggregate
to the appropriate level can also lead to confusion. In one case, data provided
by a charitable organization showed an inverse correlation between donors’
likelihood to respond to solicitations and the size of their donations. Those
more likely to respond sent smaller checks. This counterintuitive finding is a
result of the large number of solicitations the charity sent out to its supporters
each year. Imagine two donors, each of whom plans to give $500 to the charity.
One responds to an offer in January by sending in the full $500 contribution
and tosses the rest of the solicitation letters in the trash. The other sends a $100
check in response to each of five solicitations. On their annual income tax
returns, both donors report having given $500, but when seen at the individ-
ual campaign level, the second donor seems much more responsive. When
aggregated to the yearly level, the effect disappears.
Learning Things That Are True, but Not Useful
Although not as dangerous as learning things that aren’t true, learning things
that aren’t useful is more common.
Sales by Month (2003)
43500
43000
42500
42000
41500
41000
40500
40000
August September October
Figure 3.2 Did sales drop off in October?
470643 c03.qxd 3/8/04 11:09 AM Page 49
Data Mining Methodology and Best Practices 49
Learning Things That Are Already Known
Data mining should provide new information. Many of the strongest patterns in
data represent things that are already known. People over retirement age tend
not to respond to offers for retirement savings plans. People who live where there
is no home delivery do not become newspaper subscribers. Even though they
may respond to subscription offers, service never starts. For the same reason,
people who live where there are no cell towers tend not to purchase cell phones.
Often, the strongest patterns reflect business rules. If data mining “discov-
ers” that people who have anonymous call blocking also have caller ID, it is
perhaps because anonymous call blocking is only sold as part of a bundle of
services that also includes caller ID. If there are no sales of certain products in
a particular location, it is possible that they are not offered there. We have seen
many such discoveries. Not only are these patterns uninteresting, their
strength may obscure less obvious patterns.
Learning things that are already known does serve one useful purpose. It
demonstrates that, on a technical level, the data mining effort is working and
the data is reasonably accurate. This can be quite comforting. If the data and
the data mining techniques applied to it are powerful enough to discover
things that are known to be true, it provides confidence that other discoveries
are also likely to be true. It is also true that data mining often uncovers things
that ought to have been known, but were not; that retired people do not
respond well to solicitations for retirement savings accounts, for instance.
Learning Things That Can’t Be Used
It can also happen that data mining uncovers relationships that are both true
and previously unknown, but still hard to make use of. Sometimes the prob-
lem is regulatory. A customer’s wireless calling patterns may suggest an affin-
ity for certain land-line long-distance packages, but a company that provides
both services may not be allowed to take advantage of the fact. Similarly, a cus-
tomer’s credit history may be predictive of future insurance claims, but regu-
lators may prohibit making underwriting decisions based on it.
Other times, data mining reveals that important outcomes are outside the
company’s control. A product may be more appropriate for some climates than
others, but it is hard to change the weather. Service may be worse in some
regions for reasons of topography, but that is also hard to change.
TIP Sometimes it is only a failure of imagination that makes new information
appear useless. A study of customer attrition is likely to show that the strongest
predictors of customers leaving is the way they were acquired. It is too late to
go back and change that for existing customers, but that does not make the
information useless. Future attrition can be reduced by changing the mix of
acquisition channels to favor those that bring in longer-lasting customers.
470643 c03.qxd 3/8/04 11:09 AM Page 50
50 Chapter 3
The data mining methodology is designed to steer clear of the Scylla of
learning things that aren’t true and the Charybdis of not learning anything
useful. In a more positive light, the methodology is designed to ensure that the
data mining effort leads to a stable model that successfully addresses the busi-
ness problem it is designed to solve.
Hypothesis Testing
Hypothesis testing is the simplest approach to integrating data into a
company’s decision-making processes. The purpose of hypothesis testing is
to substantiate or disprove preconceived ideas, and it is a part of almost all
data mining endeavors. Data miners often bounce back and forth between
approaches, first thinking up possible explanations for observed behavior
(often with the help of business experts) and letting those hypotheses
dictate the data to be analyzed. Then, letting the data suggest new hypotheses
to test.
Hypothesis testing is what scientists and statisticians traditionally spend
their lives doing. A hypothesis is a proposed explanation whose validity can
be tested by analyzing data. Such data may simply be collected by observation
or generated through an experiment, such as a test mailing. Hypothesis testing
is at its most valuable when it reveals that the assumptions that have been
guiding a company’s actions in the marketplace are incorrect. For example,
suppose that a company’s advertising is based on a number of hypotheses
about the target market for a product or service and the nature of the
responses. It is worth testing whether these hypotheses are borne out by actual
responses. One approach is to use different call-in numbers in different ads
and record the number that each responder dials. Information collected during
the call can then be compared with the profile of the population the advertise-
ment was designed to reach.
Each time a company solicits a response from its customers, whetherTIP
through advertising or a more direct form of communication, it has an
opportunity to gather information. Slight changes in the design of the
communication, such as including a way to identify the channel when a
prospect responds, can greatly increase the value of the data collected.
By its nature, hypothesis testing is ad hoc, so the term “methodology” might
be a bit strong. However, there are some identifiable steps to the process, the
first and most important of which is generating good ideas to test.
470643 c03.qxd 3/8/04 11:09 AM Page 51
Data Mining Methodology and Best Practices 51
Generating Hypotheses
The key to generating hypotheses is getting diverse input from throughout the
organization and, where appropriate, outside it as well. Often, all that is needed
to start the ideas flowing is a clear statement of the problem itself—especially if
it is something that has not previously been recognized as a problem.
It happens more often than one might suppose that problems go unrecog-
nized because they are not captured by the metrics being used to evaluate the
organization’s performance. If a company has always measured its sales force
on the number of new sales made each month, the sales people may never
have given much thought to the question of how long new customers remain
active or how much they spend over the course of their relationship with the
firm. When asked the right questions, however, the sales force may have
insights into customer behavior that marketing, with its greater distance from
the customer, has missed.
Testing Hypotheses
Consider the following hypotheses:
■■ Frequent roamers are less sensitive than others to the price per minute
of cellular phone time.
■■ Families with high-school age children are more likely to respond to a
home equity line offer than others.
■■ The save desk in the call center is saving customers who would have
returned anyway.
Such hypotheses must be transformed in a way that allows them to be tested
on real data. Depending on the hypotheses, this may mean interpreting a single
value returned from a simple query, plowing through a collection of association
rules generated by market basket analysis, determining the significance of a
correlation found by a regression model, or designing a controlled experiment.
In all cases, careful critical thinking is necessary to be sure that the result is not
biased in unexpected ways.
Proper evaluation of data mining results requires both analytical and busi-
ness knowledge. Where these are not present in the same person, it takes cross-
functional cooperation to make good use of the new information.
Models, Profiling, and Prediction
Hypothesis testing is certainly useful, but there comes a time when it is not
sufficient. The data mining techniques described in the rest of this book are all
designed for learning new things by creating models based on data.
470643 c03.qxd 3/8/04 11:09 AM Page 52
52 Chapter 3
In the most general sense, a model is an explanation or description of how
something works that reflects reality well enough that it can be used to make
inferences about the real world. Without realizing it, human beings use
models all the time. When you see two restaurants and decide that the one
with white tablecloths and real flowers on each table is more expensive than
the one with Formica tables and plastic flowers, you are making an inference
based on a model you carry in your head. When you set out to walk to the
store, you again consult a mental model of the town.
Data mining is all about creating models. As shown in Figure 3.3, models
take a set of inputs and produce an output. The data used to create the model
is called a model set. When models are applied to new data, this is called the
score set. The model set has three components, which are discussed in more
detail later in the chapter:
■■ The training set is used to build a set of models.
■■ The validation set
1
is used to choose the best model of these.
■■ The test set is used to determine how the model performs on unseen
data.
Data mining techniques can be used to make three kinds of models for three
kinds of tasks: descriptive profiling, directed profiling, and prediction. The
distinctions are not always clear.
Descriptive models describe what is in the data. The output is one or more
charts or numbers or graphics that explain what is going on. Hypothesis test-
ing often produces descriptive models. On the other hand, both directed profil-
ing and prediction have a goal in mind when the model is being built. The
difference between them has to do with time frames, as shown in Figure 3.4. In
profiling models, the target is from the same time frame as the input. In pre-
dictive models, the target is from a later time frame. Prediction means finding
patterns in data from one period that are capable of explaining outcomes in a
later period. The reason for emphasizing the distinction between profiling and
prediction is that it has implications for the modeling methodology, especially
the treatment of time in the creation of the model set.
Output
Inputs
Model
Figure 3.3 Models take an input and produce an output.
1 The first edition called the three partitions of the model set the training set, the test set, and the
evaluation set. The authors still like that terminology, but standard usage in the data mining com-
munity is now training/validation/test. To avoid confusion, this edition adopts the training/
validation/test nomenclature.
TEAMFLY
Team-Fly
®
470643 c03.qxd 3/8/04 11:09 AM Page 53
Data Mining Methodology and Best Practices 53
Input variables Target variable
S M T W T F S
1 2 3 4 5 6 7
8 9 10 11 12 13
14
15 16 17 18 19 20
21
22 23 24 25 26 27
28
29 30 31
September 2004
S M T W T F S
1 2 3 4
5 6 7 8 9 10 11
12 13 14 15 16 17 18
19 20 21 22 23
29 30
24 25
26 27 28
October 2004
S M T W T F S
1 2
3 4 5 6 7 8 9
10 11 12 13 14 15 16
17
24
31
18 19 20 21 22 23
3025 26 27 28 29
S M T W T F S
7 8 9
1 2 3 4 5 6
14 15 16 17 18 19 20
10 11 12 13
21 22 23 24 25 26 27
28 29 30
Prediction
August 2004 November 2004
Profiling
Input variables Target variable
Figure 3.4 Profiling and prediction differ only in the time frames of the input and target
variables.
Profiling
Profiling is a familiar approach to many problems. It need not involve any
sophisticated data analysis. Surveys, for instance, are one common method of
building customer profiles. Surveys reveal what customers and prospects look
like, or at least the way survey responders answer questions.
Profiles are often based on demographic variables, such as geographic loca-
tion, gender, and age. Since advertising is sold according to these same vari-
ables, demographic profiles can turn directly into media strategies. Simple
profiles are used to set insurance premiums. A 17-year-old male pays more for
car insurance than a 60-year-old female. Similarly, the application form for a
simple term life insurance policy asks about age, sex, and smoking—and not
much more.
Powerful though it is, profiling has serious limitations. One is the inability
to distinguish cause and effect. So long as the profiling is based on familiar
demographic variables, this is not noticeable. If men buy more beer than
women, we do not have to wonder whether beer drinking might be the cause
470643 c03.qxd 3/8/04 11:09 AM Page 54
54 Chapter 3
of maleness. It seems safe to assume that the link is from men to beer and not
vice versa.
With behavioral data, the direction of causality is not always so clear. Con-
sider a couple of actual examples from real data mining projects:
■■ People who have purchased certificates of deposit (CDs) have little or
no money in their savings accounts.
■■ Customers who use voice mail make a lot of short calls to their own
number.
Not keeping money in a savings account is a common behavior of CD hold-
ers, just as being male is a common feature of beer drinkers. Beer companies seek
out males to market their product, so should banks seek out people with no
money in savings in order to sell them certificates of deposit? Probably not! Pre-
sumably, the CD holders have no money in their savings accounts because they
used that money to buy CDs. A more common reason for not having money in a
savings account is not having any money, and people with no money are not
likely to purchase certificates of deposit. Similarly, the voice mail users call their
own number so much because in this particular system that is one way to check
voice mail. The pattern is useless for finding prospective users.
Prediction
Profiling uses data from the past to describe what happened in the past. Pre-
diction goes one step further. Prediction uses data from the past to predict what
is likely to happen in the future. This is a more powerful use of data. While the
correlation between low savings balances and CD ownership may not be use-
ful in a profile of CD holders, it is likely that having a high savings balance is (in
combination with other indicators) a predictor of future CD purchases.
Building a predictive model requires separation in time between the model
inputs or predictors and the model output, the thing to be predicted. If this
separation is not maintained, the model will not work. This is one example of
why it is important to follow a sound data mining methodology.
The Methodology
The data mining methodology has 11 steps.
1. Translate the business problem into a data mining problem.
2. Select appropriate data.
3. Get to know the data.
4. Create a model set.
5. Fix problems with the data.
470643 c03.qxd 3/8/04 11:09 AM Page 55
Data Mining Methodology and Best Practices 55
6. Transform data to bring information to the surface.
7. Build models.
8. Asses models.
9. Deploy models.
10. Assess results.
11. Begin again.
As shown in Figure 3.5, the data mining process is best thought of as a set of
nested loops rather than a straight line. The steps do have a natural order, but
it is not necessary or even desirable to completely finish with one before mov-
ing on to the next. And things learned in later steps will cause earlier ones to
be revisited.
1
Translate the
business problem
into a data mining
problem.
2
Select appropriate
data.
3
10
Get to know
Assess results.
the data.
4
9
Create a model set.
Deploy models.
5
8
Fix problems with
Assess models.
the data.
6
7
Transform data.
Build models.
Figure 3.5 Data mining is not a linear process.
470643 c03.qxd 3/8/04 11:09 AM Page 56
56 Chapter 3
Step One: Translate the Business Problem
into a Data Mining Problem
A favorite scene from Alice in Wonderland is the passage where Alice asks the
Cheshire cat for directions:
“Would you tell me, please, which way I ought to go from here?”
“That depends a good deal on where you want to get to,” said the Cat.
“I don’t much care where—” said Alice.
“Then it doesn’t matter which way you go,” said the Cat.
“—so long as I get somewhere,” Alice added as an explanation.
“Oh, you’re sure to do that,” said the Cat, “if you only walk long enough.”
The Cheshire cat might have added that without some way of recognizing
the destination, you can never tell whether you have walked long enough! The
proper destination for a data mining project is the solution of a well-defined
business problem. Data mining goals for a particular project should not be
stated in broad, general terms, such as:
■■ Gaining insight into customer behavior
■■ Discovering meaningful patterns in data
■■ Learning something interesting
These are all worthy goals, but even when they have been achieved, they are
hard to measure. Projects that are hard to measure are hard to put a value on.
Wherever possible, the broad, general goals should be broken down into more
specific ones to make it easier to monitor progress in achieving them. Gaining
insight into customer behavior might turn into concrete goals:
■■ Identify customers who are unlikely to renew their subscriptions.
■■ Design a calling plan that will reduce churn for home-based business
customers.
■■ Rank order all customers based on propensity to ski.
■■ List products whose sales are at risk if we discontinue wine and beer
sales.
Not only are these concrete goals easier to monitor, they are easier to trans-
late into data mining problems as well.
What Does a Data Mining Problem Look Like?
To translate a business problem into a data mining problem, it should be refor-
mulated as one of the six data mining tasks introduced in Chapter One:
470643 c03.qxd 3/8/04 11:09 AM Page 57
Data Mining Methodology and Best Practices 57
■■ Classification
■■ Estimation
■■ Prediction
■■ Affinity Grouping
■■ Clustering
■■ Description and Profiling
These are the tasks that can be accomplished with the data mining tech-
niques described in this book (though no single data mining tool or technique
is equally applicable to all tasks).
The first three tasks, classification, estimation, and prediction are examples
of directed data mining. Affinity grouping and clustering are examples of undi-
rected data mining. Profiling may be either directed or undirected. In directed
data mining there is always a target variable—something to be classified, esti-
mated, or predicted. The process of building a classifier starts with a prede-
fined set of classes and examples of records that have already been correctly
classified. Similarly, the process of building an estimator starts with historical
data where the values of the target variable are already known. The modeling
task is to find rules that explain the known values of the target variable.
In undirected data mining, there is no target variable. The data mining task is
to find overall patterns that are not tied to any one variable. The most common
form of undirected data mining is clustering, which finds groups of similar
records without any instructions about which variables should be considered as
most important. Undirected data mining is descriptive by nature, so undirected
data mining techniques are often used for profiling, but directed techniques
such as decision trees are also very useful for building profiles. In the machine
learning literature, directed data mining is called supervised learning and undi-
rected data mining is called unsupervised learning.
How Will the Results Be Used?
This is one of the most important questions to ask when deciding how best to
translate a business problem into a data mining problem. Surprisingly often,
the initial answer is “we’re not sure.” An answer is important because, as the
cautionary tale in the sidebar illustrates, different intended uses dictate differ-
ent solutions.
For example, many of our data mining engagements are designed to
improve customer retention. The results of such a study could be used in any
of the following ways:
■■ Proactively contact high risk/high value customers with an offer that
rewards them for staying.
470643 c03.qxd 3/8/04 11:09 AM Page 58
58 Chapter 3
■■ Change the mix of acquisition channels to favor those that bring in the
most loyal customers.
■■ Forecast customer population in future months.
■■ Alter the product to address defects that are causing customers to
defect.
Each of these goals has implications for the data mining process. Contacting
existing customers through an outbound telemarketing or direct mail cam-
paign implies that in addition to identifying customers at risk, there is an
understanding of why they are at risk so an attractive offer can be constructed,
and when they are at risk so the call is not made too early or too late. Forecast-
ing implies that in addition to identifying which current customers are likely
to leave, it is possible to determine how many new customers will be added
and how long they are likely to stay. This latter problem of forecasting new
customer starts is typically embedded in business goals and budgets, and is
not usually a predictive modeling problem.
How Will the Results Be Delivered?
A data mining project may result in several very different types of deliver-
ables. When the primary goal of the project is to gain insight, the deliverable is
often a report or presentation filled with charts and graphs. When the project
is a one-time proof-of-concept or pilot project, the deliverable may consist of
lists of customers who will receive different treatments in a marketing experi-
ment. When the data mining project is part of an ongoing analytic customer
relationship management effort, the deliverable is likely to be a computer pro-
gram or set of programs that can be run on a regular basis to score a defined
subset of the customer population along with additional software to manage
models and scores over time. The form of the deliverable can affect the data
mining results. Producing a list of customers for a marketing test is not suffi-
cient if the goal is to dazzle marketing managers.
The Role of Business Users and Information Technology
As described in Chapter 2, the only way to get good answers to the questions
posed above is to involve the owners of the business problem in figuring out
how data mining results will be used and IT staff and database administrators
in figuring out how the results should be delivered. It is often useful to get
input from a broad spectrum within the organization and, where appropriate,
outside it as well. We suggest getting representatives from the various con-
stituencies within the enterprise together in one place, rather than interview-
ing them separately. That way, people with different areas of knowledge and
expertise have a chance to react to each other’s ideas. The goal of all this con-
sultation is a clear statement of the business problem to be addressed. The final
470643 c03.qxd 3/8/04 11:09 AM Page 59
Data Mining Methodology and Best Practices 59
analyze supermarket loyalty card data on behalf of a large consumer packaged
about the supermarket business. In general, a supermarket does not care
purchases soft drinks. Product manufacturers, who care very much which
is
between the ages of X and Y living in a zip code where the median home price
is between M and N.” A description like that could be used for deciding where
on shopping behavior rather than demographics, could not.
MISUNDERSTANDING THE BUSINESS PROBLEM: A CAUTIONARY TALE
Data Miners, the consultancy started by the authors, was once called upon to
goods manufacturer. To put this story in context, it helps to know a little bit
whether a customer buys Coke or Pepsi (unless one brand happens to be on a
special deal that temporarily gives it a better margin), so long as the customer
brands are sold, vie for the opportunity to manage whole categories in the
stores. As category managers, they have some control over how their own
products and those of their competitors are merchandised. Our client wanted to
demonstrate its ability to utilize loyalty card data to improve category
management. The category picked for the demonstration was yogurt because
by supermarket standards, yogurt is a fairly high-margin product.
As we understood it, the business goal was to identify yogurt lovers. To
create a target variable, we divided loyalty card customers into groups of high,
medium, and low yogurt affinity based on their total yogurt purchases over
the course of a year and into groups of high, medium, and low users based
on the proportion of their shopping dollars spent on yogurt. People who
were in the high category by both measures were labeled as yogurt lovers.
The transaction data had to undergo many transformations to be turned into
a customer signature. Input variables included the proportion of trips and of
dollars spent at various times of day and in various categories, shopping
frequency, average order size, and other behavioral variables.
Using this data, we built a model that gave all customers a yogurt lover score.
Armed with such a score, it would be possible to print coupons for yogurt when
likely yogurt lovers checked out, even if they did not purchase any yogurt on
that trip. The model might even identify good prospects who had not yet gotten
in touch with their inner yogurt lover, but might if prompted with a coupon.
The model got good lift, and we were pleased with it. The client, however,
was disappointed. “But, who the yogurt lover?” asked the client. “Someone
who gets a high score from the yogurt lover model” was not considered a good
answer. The client was looking for something like “The yogurt lover is a woman
to buy advertising and how to shape the creative content of ads. Ours, based
statement of the business problem should be as specific as possible. “Identify
the 10,000 gold-level customers most likely to defect within the next 60 days”
is better than “provide a churn score for all customers.”
The role of the data miner in these discussions is to ensure that the final
statement of the business problem is one that can be translated into a data min-
ing problem. Otherwise, the best data mining efforts in the world may be
addressing the wrong business problem.
470643 c03.qxd 3/8/04 11:09 AM Page 60
60 Chapter 3
Data mining is often presented as a technical problem of finding a model
that explains the relationship of a target variable to a group of input variables.
That technical task is indeed central to most data mining efforts, but it should
not be attempted until the target variable has been properly defined and the
appropriate input variables identified. That, in turn, depends on a good
understanding of the business problem to be addressed. As the story in the
sidebar illustrates, failure to properly translate the business problem into a
data mining problem leads to one of the dangers we are trying to avoid—
learning things that are true, but not useful.
For a complete treatment of turning business problems into data mining
problems, we recommend the book Business Modeling and Data Mining by our
colleague Dorian Pyle. This book gives detailed advice on how to find the
business problems where data mining provides the most benefit and how to
formulate those problems for mining. Here, we simply remind the reader to
consider two important questions before beginning the actual data mining
process: How will the results be used? And, in what form will the results be
delivered? The answer to the first question goes a long way towards answer-
ing the second.
Step Two: Select Appropriate Data
Data mining requires data. In the best of all possible worlds, the required data
would already be resident in a corporate data warehouse, cleansed, available,
historically accurate, and frequently updated. In fact, it is more often scattered
in a variety of operational systems in incompatible formats on computers run-
ning different operating systems, accessed through incompatible desktop
tools.
The data sources that are useful and available vary, of course, from problem
to problem and industry to industry. Some examples of useful data:
■■ Warranty claims data (including both fixed-format and free-text fields)
■■ Point-of-sale data (including ring codes, coupons proffered, discounts
applied)
■■ Credit card charge records
■■ Medical insurance claims data
■■ Web log data
■■ E-commerce server application logs
■■ Direct mail response records
■■ Call-center records, including memos written by the call-center reps
■■ Printing press run records
470643 c03.qxd 3/8/04 11:09 AM Page 61
Data Mining Methodology and Best Practices 61
■■ Motor vehicle registration records
■■ Noise level in decibels from microphones placed in communities near
an airport
■■ Telephone call detail records
■■ Survey response data
■■ Demographic and lifestyle data
■■ Economic data
■■ Hourly weather readings (wind direction, wind strength, precipitation)
■■ Census data
Once the business problem has been formulated, it is possible to form a wish
list of data that would be nice to have. For a study of existing customers, this
should include data from the time they were acquired (acquisition channel,
acquisition date, original product mix, original credit score, and so on), similar
data describing their current status, and behavioral data accumulated during
their tenure. Of course, it may not be possible to find everything on the wish
list, but it is better to start out with an idea of what you would like to find.
Occasionally, a data mining effort starts without a specific business prob-
lem. A company becomes aware that it is not getting good value from the data
it collects, and sets out to determine whether the data could be made more use-
ful through data mining. The trick to making such a project successful is to
turn it into a project designed to solve a specific problem. The first step is to
explore the available data and make a list of candidate business problems.
Invite business users to create a lengthy wish list which can then be reduced to
a small number of achievable goals—the data mining problem.
What Is Available?
The first place to look for data is in the corporate data warehouse. Data in the
warehouse has already been cleaned and verified and brought together from
multiple sources. A single data model hopefully ensures that similarly named
fields have the same meaning and compatible data types throughout the data-
base. The corporate data warehouse is a historical repository; new data is
appended, but the historical data is never changed. Since it was designed for
decision support, the data warehouse provides detailed data that can be aggre-
gated to the right level for data mining. Chapter 15 goes into more detail about
the relationship between data mining and data warehousing.
The only problem is that in many organizations such a data warehouse does
not actually exist or one or more data warehouses exist, but don’t live up to the
promises. That being the case, data miners must seek data from various
departmental databases and from within the bowels of operational systems.
470643 c03.qxd 3/8/04 11:09 AM Page 62
62 Chapter 3
These operational systems are designed to perform a certain task such as
claims processing, call switching, order entry, or billing. They are designed
with the primary goal of processing transactions quickly and accurately. The
data is in whatever format best suits that goal and the historical record, if any,
is likely to be in a tape archive. It may require significant political and pro-
gramming effort to get the data in a form useful for knowledge discovery.
In some cases, operational procedures have to be changed in order to supply
data. We know of one major catalog retailer that wanted to analyze the buying
habits of its customers so as to market differentially to new customers and long-
standing customers. Unfortunately, anyone who hadn’t ordered anything in
the past six months was routinely purged from the records. The substantial
population of people who loyally used the catalog for Christmas shopping, but
not during the rest of the year, went unrecognized and indeed were unrecogniz-
able, until the company began keeping historical customer records.
In many companies, determining what data is available is surprisingly dif-
ficult. Documentation is often missing or out of date. Typically, there is no one
person who can provide all the answers. Determining what is available
requires looking through data dictionaries, interviewing users and database
administrators, and examining existing reports.
Use database documentation and data dictionaries as a guideWARNING
but do not accept them as unalterable fact. The fact that a field is defined in a
table or mentioned in a document does not mean the field exists, is actually
available for all customers, and is correctly loaded.
How Much Data Is Enough?
Unfortunately, there is no simple answer to this question. The answer depends
on the particular algorithms employed, the complexity of the data, and the rel-
ative frequency of possible outcomes. Statisticians have spent years develop-
ing tests for determining the smallest model set that can be used to produce a
model. Machine learning researchers have spent much time and energy devis-
ing ways to let parts of the training set be reused for validation and test. All of
this work ignores an important point: In the commercial world, statisticians
are scarce, and data is anything but.
In any case, where data is scarce, data mining is not only less effective, it is
less likely to be useful. Data mining is most useful when the sheer volume of
data obscures patterns that might be detectable in smaller databases. There-
fore, our advice is to use so much data that the questions about what consti-
tutes an adequate sample size simply do not arise. We generally start with tens
of thousands if not millions of preclassified records so that the training, vali-
dation, and test sets each contain many thousands of records.
TEAMFLY
Team-Fly
®
470643 c03.qxd 3/8/04 11:09 AM Page 63
Data Mining Methodology and Best Practices 63
In data mining, more is better, but with some caveats. The first caveat has to
do with the relationship between the size of the model set and its density.
Density refers to the prevalence of the outcome of interests. Often the target
variable represents something relatively rare. It is rare for prospects to respond
to a direct mail offer. It is rare for credit card holders to commit fraud. In any
given month, it is rare for newspaper subscribers to cancel their subscriptions.
As discussed later in this chapter (in the section on creating the model set), it is
desirable for the model set to be balanced with equal numbers of each of the
outcomes during the model-building process. A smaller, balanced sample is
preferable to a larger one with a very low proportion of rare outcomes.
The second caveat has to do with the data miner’s time. When the model set
is large enough to build good, stable models, making it larger is counterproduc-
tive because everything will take longer to run on the larger dataset. Since data
mining is an iterative process, the time spent waiting for results can become very
large if each run of a modeling routine takes hours instead of minutes.
A simple test for whether the sample used for modeling is large enough is to
try doubling it and measure the improvement in the model’s accuracy. If the
model created using the larger sample is significantly better than the one cre-
ated using the smaller sample, then the smaller sample is not big enough. If
there is no improvement, or only a slight improvement, then the original sam-
ple is probably adequate.
How Much History Is Required?
Data mining uses data from the past to make predictions about the future. But
how far in the past should the data come from? This is another simple question
without a simple answer. The first thing to consider is seasonality. Most busi-
nesses display some degree of seasonality. Sales go up in the fourth quarter.
Leisure travel goes up in the summer. There should be enough historical data
to capture periodic events of this sort.
On the other hand, data from too far in the past may not be useful for min-
ing because of changing market conditions. This is especially true when some
external event such as a change in the regulatory regime has intervened. For
many customer-focused applications, 2 to 3 years of history is appropriate.
However, even in such cases, data about the beginning of the customer rela-
tionship often proves very valuable—what was the initial channel, what was
the initial offer, how did the customer initially pay, and so on.
How Many Variables?
Inexperienced data miners are sometimes in too much of a hurry to throw out
variables that seem unlikely to be interesting, keeping only a few carefully
chosen variables they expect to be important. The data mining approach calls
for letting the data itself reveal what is and is not important.
470643 c03.qxd 3/8/04 11:09 AM Page 64
64 Chapter 3
Often, variables that had previously been ignored turn out to have predic-
tive value when used in combination with other variables. For example, one
credit card issuer, that had never included data on cash advances in its cus-
tomer profitability models, discovered through data mining that people who
use cash advances only in November and December are highly profitable. Pre-
sumably, these are people who are prudent enough to avoid borrowing money
at high interest rates most of the time (a prudence that makes them less likely
to default than habitual users of cash advances) but who need some extra cash
for the holidays and are willing to pay exorbitant interest to get it.
It is true that a final model is usually based on just a few variables. But these
few variables are often derived by combining several other variables, and it may
not have been obvious at the beginning which ones end up being important.
What Must the Data Contain?
At a minimum, the data must contain examples of all possible outcomes of
interest. In directed data mining, where the goal is to predict the value of a par-
ticular target variable, it is crucial to have a model set comprised of preclassi-
fied data. To distinguish people who are likely to default on a loan from people
who are not, there needs to be thousands of examples from each class to build
a model that distinguishes one from the other. When a new applicant comes
along, his or her application is compared with those of past customers, either
directly, as in memory-based reasoning, or indirectly through rules or neural
networks derived from the historical data. If the new application “looks like”
those of people who defaulted in the past, it will be rejected.
Implicit in this description is the idea that it is possible to know what hap-
pened in the past. To learn from our mistakes, we first have to recognize that
we have made them. This is not always possible. One company had to give up
on an attempt to use directed knowledge discovery to build a warranty claims
fraud model because, although they suspected that some claims might be
fraudulent, they had no idea which ones. Without a training set containing
warranty claims clearly marked as fraudulent or legitimate, it was impossible
to apply these techniques. Another company wanted a direct mail response
model built, but could only supply data on people who had responded to past
campaigns. They had not kept any information on people who had not
responded so there was no basis for comparison.
Step Three: Get to Know the Data
It is hard to overstate the importance of spending time exploring the data
before rushing into building models. Because of its importance, Chapter 17 is
devoted to this topic in detail. Good data miners seem to rely heavily on