Báo cáo sinh học: "Genetic variability in residual feed intake in rainbow trout clones and testing of indirect selection criteria (Open Access publication)" ppt
Bạn đang xem bản rút gọn của tài liệu. Xem và tải ngay bản đầy đủ của tài liệu tại đây (220.22 KB, 18 trang )
Original article
Genetic variability in residual feed intake
in rainbow trout clones and testing
of indirect selection criteria
(Open Access publication)
Laure GRIMA
1,2
*
, Edwige QUILLET
1
, Thierry BOUJARD
1
,
Christe`le R
OBERT-GRANIE
´
3
,Be´atrice CHATAIN
2
, Muriel MAMBRINI
1
1
INRA, UR 544 Ge´ne´tique des poissons, Domaine de Vilvert, 78350 Jouy-en-Josas, France
2
Ifremer, Station d’aquaculture expe´rimentale, chemin de Maguelone,
34250 Palavas-les-Flots, France
3
INRA, UR 631 Station d’ame´lioration ge´ne´tique des animaux, BP 52627,
31320 Castanet-Tolosan, France
(Received 10 January 2008; accepted 1st July 2008)
Abstract – Little is known about the genetic basis of residual feed intake (RFI) variation in
fish, since this trait is highly sensitive to environmental influences, and feed intake of
individuals is difficult to measure accurately. The purpose of this work was (i) to assess the
genetic variability of RFI estimated by an X-ray technique and (ii) to develop predictive
criteria for RFI. Two predictive criteria were tested: loss of body weight during feed
deprivation and compensatory growth during re-feeding. Ten heterozygous rainbow trout
clones were used. Individual intake and body weight were measured three times at three-
week intervals. Then, individual body weight was recorded after two cycles of a three-week
feed deprivation followed by a three-week re-feeding. The ratio of the genetic variance to the
phenotypic variance was found high to moderate for growth, feed intake, and RFI (VG/
VP = 0.63 ± 0.11, 0.29 ± 0.11, 0.29 ± 0.09, respectively). The index that integrates
performances achieved during deprivation and re-feeding periods explained 59% of RFI
variations. These results provide a basis for further studies on the origin of RFI differences
and show that indirect criteria are good candidates for future selective breeding programs.
rainbow trout / clone / residual feed intake / indirect criteria / selection
1. INTRODUCTION
In farmed animals, food represents at least 50% of the production costs. There-
fore, improvement of feed efficiency (the ratio of wet mass gain to feed intake) is
an important target for cost reduction. In addition, feed efficiency e nhancement
*
Corresponding author:
Genet. Sel. Evol. 40 (2008) 607–624
Ó INRA, EDP Sciences, 2008
DOI: 10.1051/gse:2008026
Available online at:
www.gse-journal.org
Article published by EDP Sciences
would lead to a r eduction in environmental loading, particularly in the case of
activities s uch as fish farming where effluents can directly impact environment.
Among the possible means of improving feed efficiency, selective breeding is
considered a p romising method. Cultured fish populations are likely to have a
high genetic potential for improvement through breeding, since most of t he spe-
cies reared today have b een onl y recently dom esticated. Selection f or grow t h
using family or individual selection i n fish can l ead to a 10–20% gain in body
weight per generation [6,12], which is a far greater level o f progress than that
achieved in endothermic terrestrial vertebrates. In salmonids, the main
correlated response to selection for growth is increased feed intake capacity
[27,38,39], which is probably due to the high correlation between these two traits
[30,35]. However, the effect of growth selection on feed efficiency i s d isputed.
While Kause et al. [21] have found that rapid growth in rainbow trout (Oncorhyn-
chus mykiss) i s related to high feed efficiency, Mambrini et al. [27] h ave not
detected any improvement in feed efficiency when selecting brown trout (Salmo
trutta) for growth gain. Hence at least in brown trout, selection on growth does not
necessarily lead to improvement in feed efficiency. Thus, a specific strategy is
needed to develop e f fective selection programs for feed efficiency in fish.
In endothermic land vertebrates, residual feed intake (RFI) is generally used to
study the determinants of feed efficiency. Calculation of RFI uses a model to pre-
dict expected consumption. The dif ference between actual consumption and
expected consumption of an individual over a given wei ght gain interval is
calculated to give a residual, i.e. RFI, for each animal tested. R FI is thought to
be a better measurement than feed efficiency i tself, mainly because it is not a ratio.
If a ratio is used, it is not possible to distinguish whether any improvement in feed
efficiency results from a decrease in feed intake, from an increase in weight gain or
from a modification of both variables. Moreover, the ratio confounds the variability
of intake and gain, both of which are highly sensitive to environmental variation
[13]. In cattle, pigs, sheep, and chickens, the heritabi lity of RFI lies between 0.2
and 0.4, a nd the genetic correlation with feed efficiency is moderate to high
(À0.23 to À0.66) [9,17,37,41]. In chickens, selection on RFI has clearly resulted
in significant i mprovement of feed efficiency [4]. In fish, no selection program on
feed efficiency or RFI has yet been put into action, and little is known about the
genetic components of these traits. The major reasons are the difficulties encoun-
tered to measure feed intake and t he variability of these two traits. Indeed, s ince fish
are generally reared in large groups in tanks, it is difficult to obtain accurate mea-
surements of the individual intake and this explains why the literature on this sub-
ject is rare in fish compared with other species.
The first estimation of genetic parameters for feed efficiency was obtained
for rainbow trout reared in individual aquaria, and feed intake was indirectly
608
L. Grima et al.
estimated from oxygen consumption [22]. Under such conditions, feed effi-
ciency showed no substantial genetic component (heritability 3 ± 10%; [ 22]).
In this study, measurement of feed intake was very imprecise , which may h ave
masked important ef fects. In another study, in which feed distribution and waste
were accurately measured in Atlantic salmon reared in separate family tanks
[14], inter - family variations in feed efficiency were detected [23,40]. However,
this family effect may h ave been overestimated because within-family variance
could not be estimated. In a recent study involving six different strains of rain-
bow trout reared in individual aquaria, voluntary i ntake was measured by accu-
rate visual observation of the pellets ingested by each fish. RFI was calculated as
the difference b etween the i ntake observed a nd the i ntake predicted from a bio-
energetic model [36]. The differences between cross-types indicated a significant
genetic component for RFI [36]. The accuracy of the e stima tions obtained with
this strategy may b e impaired b y t he fact that social interactions were not con-
sidered, even though they can be a major cause of individual variation [19]. It
has been shown that feed intake of an individual fish within a group can be esti-
mated from X-ray images of fish supplied with food containing a suitable dense
marker [5,18,29]. The weakness of this approach is the low repeatability of esti-
mated feed intake (from 0.09 to 0 .32 in rainbow trout): a minimum of thre e
repeated records seems to be n ecessary in order to buffer day-to-day variation
and accurately describe the intake versus gain relationship [20]. However , even
with five measurements, estimates of feed efficiency heritability remain low
(6 ± 10%) [33].
In fish, the difficulties of measuring individual RFI performances have pre-
vented accurate estimations of individual g enetic values. Therefore, selection
schemes directly targeting RFI, l ike those c ommonly used in land vertebrates,
represent a challenge in fish. Predictive criteria for RFI would be precious tools
for fish breeding programs, which could use these indirect criteria to design
alternative selection strategies.
The objecti ves of the present study wer e (i) to assess the genetic variability of
RFI using the X-ray technique to estimate i ndividual feed intake and fish clones
to multiply m easurements per genotype and ( ii) to explore t he relative merits of
potential indirect criteria for predicting RFI: weight loss during feed deprivation
and weight gain during re-feeding.
Isogenic clonal lines have been successfully developed i n rainbow trout by
chromosome set manipulation methods using gynogenesis techniques
[10,24,32]. Clones are individuals that are strictly genetically identical, and thus
genetic variability within a clone is null. Clones are an excellent tool to study the
genetic variability of traits, such as RFI, w hich are highly s ensitive to environ-
mental variation. Indeed, the use of clones makes it possible to increase
Selection for residual feed intake in fish
609
the number of measurements per genotype and hence to improve the accuracy of
mean genotype value estimation.
Among the various indirect criteria to test, we chose to explore traits likely to
reflect variations in maintenance requirements and metabolic efficiency, because
in land vertebrates several studies have demonstrated that these capacities are sig-
nificantly correlated with RFI genetic variations [16]. In addition, it was necessary
to carry out measurements that were noninvasive and easy to record in rearing con-
ditions. Two traits were chosen for assessment: loss of body weight during a period
of feed deprivation and subsequent gain in body weight after a re-feeding period.
Loss of weight during feed deprivation was chosen because it is assumed to be pro-
portional to the maintenance requirement [8,25]. Compensatory growth was
chosen because it has b een shown to be associated with variations in RFI [26].
Moreover , we assume that these two traits reflect protein turnover rate.
The validity of these indirect criteria was analyzed through between clone
variations in RFI and between clone correlations of RFI w ith body weight loss
and gain during successive periods of feed deprivation and re-feeding.
2. MATERIALS AND METHODS
2.1. Experimental animal production and management
Ten heterozygous clones of rainbow trout (Oncorhynchus mykiss)were
obtained b y mating f emales and males from different homozygous clonal lines,
developed at the Gournay-sur-Aronde INRA fish f arm [32]. To avoid maternal
effects further differentiating the clones, all the females used belonged to a single
clone. We chose male b reeders (XX sex reversed females) that were not related
to the female clone used. The ova of seven females were pooled and then
divided into 10 batches. Each batch was f ertilized with the milt of a single male.
All f ertilizations were performed on the s ame day. The homozygous status of
each breeder was checked using four and n ine microsatellite markers for the
dams and sires, respectively.
The 10 progenies were incubated separately in the hatchery of the Gournay-sur-
Aronde INRA fish farm. After h atching, each clone was reared in two tanks
(approximately 850 fish per tank, 50 L flow-through tanks). Fish were fed a com-
mercial pelleted feed, provided i n excess by a utomatic feeders (12 h per day) until
the beginning of the experiment. The experiment started when the fish reached a
mean body weight of 7.5 g (182 days post fertilization: dpf). Forty-two fish of each
clone were randomly and equally picked from the two tanks and s plit among
six tanks of 50 L in a balanced factorial design (seven fish per clone per tank,
70 fish per tank). All fish were individually weighed and tagged ( PIT-TagÒ).
610
L. Grima et al.
Then, they underwent two successive experimental phases: the first (from 255 to
298 dpf) aimed at detecting g eneti c variability for RFI, the second (from 317 to
443 dpf) aimed at testing the relevance of t he indi rect criteria.
The water temperature followed the seasonal variations in the river supplying
the farm, ranging from 7 t o 16 °C during the experiments. Mortality was
recorded throughout the entire experimental period.
2.2. Recorded traits
During the first experimental phase, the amount of food eaten by each fish
during a ‘‘one-day meal’’ (corresponding to the 4-h daily feeding) was measured
at three time points at three-week intervals. Individual body weight gain (BWG)
was also recorded ove r the whole p eriod. The cumulative individual i ntake (CI)
over t he first phase was then calculated, and the residual feed intake (RFI) e sti-
mated from the relationship between BWG and CI. During the second experi-
mental phase, the body weight after five weeks of growth, loss of body
weight after a three-week feed deprivation period (G
fd
), and body weight after
a three-week re-feeding period (G
rf
) were recorded (over two cycles for feed
deprivation and re-feeding). Fish were fed a commercial pelleted feed (Skretting
48% protein and 24% lipid according to the manufacturer) with an automatic
feeder , in slight excess of the usual daily ration.
2.2.1. First experimental phase: recording of residual feed intake
The individual f eed intake during a one-day meal was measured using an
X-ray t echnique [28] and fulfilling the prerequisites described in [18]. This
implied that (i) the l ength of time between the moment feeding began and the
X-ray did not exceed the digestion time, i.e. no feed came out of the stomach
and ( ii) the time interval between two successive estimates was sufficient to
allow complete evacuation of the markers from the gut.
This experiment lasted 43 days, during which one-day meal intake was mea-
sured t hree times: at 255, 277, and 298 dpf. Feed distribution lasted four hours
per day during the whole experimental phase. To ensure an identical delay
between the end of the feeding period a nd the X-rays for all the tanks, the first
feeding times among tanks were set at regular one-hour intervals. On the days
when estimates were made, fish wer e fed as usual but the commercial feed
was replaced by a labelled diet containing 1% lead glass ballotini beads
(Sillibeads type H, 450–600 lm, DLO Equipment, Belgium). These beads were
mixed into ground feed, w hich was then r e-pelleted. Half an hour after the end
of the feed distribution, the fish were anesthetized (2-phenoxy-ethanol
Selection for residual feed intake in fish
611
0.4 mLÆL
À1
), individually identified using a PIT-Ta g reader (PRD-60,
Re´seaumatique, Conches, France o r www.reseaumatique.fr), weighed to the
nearest 0.1 g, and X-rayed (TR 80/20 portable X-ray, Todd Research, UK,
80 V-20 A, 1 s exposure). Ballotini beads present in the stomach were then
counted visually on the radiographs. Individual one-day meal feed intake was
calculated from a reference calibration curve develope d from previously known
weights of labelled feed and their ballotini content (N = 19; R
2
= 0.99).
The following variables were calculated:
• CI (g) = mean one-day meal intake · 43 days
where the mean one-day meal intake is the mean of the feed intakes recorded at
255, 277, and 298 dpf.
• BWG (g) = final body weight – initial body weight
where the final body weight (BW) is the B W at 2 9 8 dpf and initial BW is the
BW at 255 dpf.
The determination coefficient of the regression line of CI on BWG, estimated
from all the individual data, was significantly different f rom 0 (R
2
= 0.22;
P < 0.001). T he regression equation was used to predict i ndividual feed intake
and RFI was calculated for a given fish as the difference between the measured
and p redicted feed intake. Contrary to what is commonly performed in land
vertebrates, the RFI equation did not include the metabolic body weight. Indeed,
the use of metabolic body weight appeared unnecessary because of the isometric
shape of the current regression.
2.2.2. Second experimental phase: testing potential indirect criteria
After a five-week growth period (g; from day 317 to day 353), fish were
submitted to a t hree-week period of feed deprivation (fd1; from d ay 353 to
day 373), immediately followed by a four -week period of re-feeding (rf1;from
day 374 to day 401) during which they were fed ad libitum as during the basic
growth period. Then, a second round of a three-week feed deprivation (fd2; from
day 402 to day 423) and a three-week re-feeding (rf2; from day 424 to day 444)
was applied. We called the first five-week growth period, basic growth, to avoid
confusion between this period and the compensatory growth.
Fish were individually weighed at the beginning and at the end of each period
of feed deprivation or re-feeding and the thermal growth coefficient (G)was
calculated. This variable corrects f or the effects of the initial body weight.
612
L. Grima et al.
Assuming that the influence of temperature of growth is linear, this variable also
corrects for the effects of the temperature [7].
• Thermal growth coefficient GðÞ¼
ðW
1=3
f
À W
1=3
i
Þ
P
T
where W
f
and W
i
are the body weights at the end and beginning, respectively, of
the considered period, and
P
T is the s um of temperatures during t his period.
Growth rates will be referred to as G
g
, G
fd1
, G
rf1
, G
fd2
,andG
rf2
.
2.3. Statistical analyses
2.3.1. Data set
ANOVA and ANCOVA, multiple linear regression, and correlations were
performed using the GLM, REG, and CORR procedures of SASÒ (SASÒ Inst.,
Inc., Ca ry, NC), respectively. We checked the assumption of residual h omosce-
dacity, a s well as the independence of the variance from the mean. Variance
components and clone genetic values were estimated using Asreml [11].
RFI analyses were performed on 365 fish only instead of the 420 because data
on one of the t hree intake measurements were unavailable for 5 5 individuals.
The reason is that these fish had moved on the X-radiographic plate making
it impossible to count the number of ballotini beads in their stomach.
Analyses were made on all six tanks for the first experimental phase, but only
on five tanks for the second experimental phase because of heavy mortality in
one tank due to technical reasons.
2.3.2. Validation of X-ray measurements
To test if the feed intake measurements recorded wi th the X-ray technique
were stable through time, we estimated phenotypic correlations between two
feed intake records using all individual data. We also calculat ed the repeatability
of the intake m easurements as described in [20], where the repeatability,
r =1À V
Es
/(V
Es
+ V
Eg
), V
Es
being the wi thin-individual variance a rising from
repeated measurements and V
Eg
the b etween individual variance, the standard
error was calculated as described by Becker [2].
2.3.3. Between clone variation
The clone effect was t ested on a ll rec orded traits (BW, CI, RFI, and growth
rate, G) using the following analysis of variance model:
ÀY
ijk
¼ l þ clone
i
þ tank
j
þ clone
i
à tank
j
þ e
ijk
Selection for residual feed intake in fish
613
where Y
ijk
is an individual fish, l is the estimated mean of the population, clone
i
is the random clone effect, tank
j
is the random tank effect, clone
i
* tank
j
is the
interaction between the clone and tank effect, and e
ijk
the residual. Clone
genetic values of BW, CI, RFI, and G were obtained as solutions from the best
linear unbiased prediction analysis using the Asreml software. When using
Asreml, BW, CI, and RFI were tested separately, while the G was tested in a
multi-trait analysis to take into account the fact that the G were calculated using
repeated body weight measurements from the same fish. All the fish originating
from the same clone were included as replicates of the same animal. The
genetic and phenotypic components of CI, RFI, and indirect criteria were
assessed with Asreml, using a model including clone as random effect and tank
as fixed effect. For each trait, the genetic component of CI, RFI, and indirect
criteria variability was calculated by dividing the genetic variance by the
phenotypic variance (VG/VP). The genetic component obtained included both
additive and dominance effects, this latter effect could not be estimated because
of the experimental breeding design, which only used one dam.
2.3.4. Between clone correlations
The correlation between indirect criteria and RFI was assessed to determine
whether they would make suitable predictive criteria. All correlations were calcu-
lated using the clone’s genetic value obtained with the Asreml software. Indirect
criteria were tested separately and in combination ( i.e. composit e cr iteria). G
fd1
and G
fd2
genetic values were combined like the genetic values of G
rf1
and G
rf2
to test whether the use of both periods improved the prediction of RFI for weight
loss during feed deprivation and for compensatory growth. In addition, G
fd1
and
G
rf1
genetic values were combined, like the genetic values of G
fd2
and G
rf2
,totest:
(i) whether one period of feed deprivation/re-feeding was more predictive than the
other and (ii) whether for each period the use of both criteria improved the predic-
tion of RFI. Finally all the G criteria were summed to estimate the degree of pre-
diction achieved when all periods were taken into account. To improve the degree
of prediction of all the composite indirect criteria (i.e. G
fd1
+ G
rf1
, G
fd2
+ G
rf2
,
G
fd1
+ G
fd2
, G
rf1
+ G
rf2
,andG
fd1
+ G
rf1
+ G
fd2
+ G
rf2
), weighting coefficients
were assigned to the G genetic v alues. These wei ghting coefficients were estimated
by performing multiple linear regression of all the G on RFI, using the method of
maximum R-square improvement. Clone genetic values were used to perform the
multiple linear regressions. Correlations between RFI and weighted indirect crite-
ria were then calculated. Genetic and phenotypic components of the weighted indi-
rect criteria were estimated using the same analyses as those used for the o ther
predictive criteria.
614
L. Grima et al.
Stability through time of the potential i ndirect criteria was t ested by calculat-
ing correlations between a clone’s genetic v alues in the two periods of feed
deprivation and the two periods of re-feeding.
Table I. Phenotypic correlation coefficients (R) between the different one-day meal
feed intakes (FI) from 10 rainbow trout clones. Exponents indicate the age of the fish
when traits were recorded.
P
value
= probability that correlation differs from zero; N = 365.
RP
value
FI
255–277
0.079 0.125
FI
277–298
0.184 < 0.001
FI
255–298
0.257 < 0.001
Population mean
Population expected
7
2
6
1
10
9
3
5
8
4
Days
50
100
150
200
250
300
350
400
450
500
550
250 270 290 310 330 350 370 390 410 430 450
Weight (g)
BA
Population mean
Population expected
Population mean
Population expected
7
2
6
1
10
9
3
5
8
4
Days
50
100
150
200
250
300
350
400
450
500
550
250 270 290 310 330 350 370 390 410 430 450
Weight (g)
BA
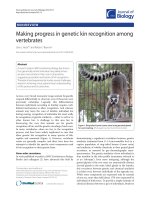
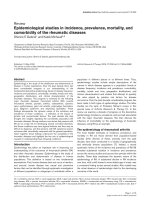
Figure 1. Mean body weight (g ± standard error) of 10 rainbow trout clones (1–10)
fed ad libitum then submitted to two periods of feed deprivation each followed by
periods of re-feeding. The bold line represents the population mean body weight. The
dotted line represents the expected population mean body weight if fish are not
submitted to feed deprivation. ‘A’ corresponds to the first experimental period, i.e.
when the genetic variability of residual feed intake is estimated. ‘B’ corresponds to
the second experimental period, i.e. when the indirect criteria are tested.
Selection for residual feed intake in fish
615
3. RESULTS
At the end of the experiment and i n the five survival tanks, s urvival percent-
ages ranged between 98 and 100% depending on tank with no clone effect.
Clones e xhibited different growth capacities during the first experimental phase
and different compensatory growth capacities after feed deprivation during the
second phase (Fig. 1).
The repeatability of the one-day meal feed intake was l ow 0. 13 ± 0.06, as
well as the phenotypic correlations between the dif ferent one -day meal feed
intakes (Tab. I), underlining the need for repeated measurements. Nevertheless,
correlations were significant, except between the first and the second records.
3.1. Between clone variability for residual feed intake
Significant c lone and tank e f fects were found for BW and FI on each exper -
imental day (Tab. II), with between clone variation representing 63% of the phe-
notypic variance o f the initial BW (Tab. III). Significant differences between
clones and between tanks were also found for the CI, and BWG (Tab. II),
between clone variation representing 29% of the phenotypic CI variance. Sub-
stantial between clone variations were found for RFI as well (Tab. II). Since
the interaction between clone and tank eff ects w as very close to significance,
we performed a likelihood ratio test on this interaction with PROC M IXED.
The results showed that we could not reject the null hypothesis (absence o f sig-
nificant interactions). The model taking into account the interaction between
clone and t ank effects showed a strong clone effect on RFI (Tab. II). Therefore,
when for a 100 g weight gain, the mean CI of the populations was 105 g, the
RFI varied between –1 1.1 g for the most efficient clone and 26.6 g for the least
efficient clone. Between clone variations in RFI represented 23% of the total
phenotypic variation (Tab. III). A positive genetic correlation was found
between the RFI and CI (R = 0 .755; P = 0.012), which indicates that the fish
eating most had the lowest RFI.
3.2. Validity of indirect criteria
No mort ality was recorded during the second experi mental phase (i.e. 100%
survival), indicating that fish overcame the feed deprivation and re-feeding
without any major problem. During feed deprivation, fish w eight loss was on
average 4.38 and 5.44% during the first and second challenges, respectively
(clone means o f G were À0.050 and À0.065 during the first and second feed
deprivation periods, respectively). Fish growth r ate G, which was 0.136 during
616
L. Grima et al.
the initial growing phase, i ncreased by 1.8 to 2.1 times during r e-feeding (clone
means of G were 0.245 and 0.292 during the first and second re-feeding periods,
respectively). A strong correlation was found between the genetic values G
fd1
and G
fd2
, measured in the first and the s econd periods of feed deprivation
(R = 0.93; P < 0.001), and between Gr
f1
and Gr
f2
(R = 0 .95; P < 0 .001).
Genetic components of variability for weight loss during feed deprivation and
compensatory growth were significantly dif ferent from 0 (between 0.32 and
0.51, Tab. III).
Table III. Genetic components of variability measured from 10 rainbow trout clones
(VG/VP, where VG is the genetic variance, and VP the phenot ypic variance), given
with the respective standard errors (± S.E.) in: body wei ght at the beginning of the
experiment (BW
255
), cumulative intake (CI), residual feed intake (RFI), and indirect
criteria: G
g
, G
fd1
, G
rf1
, G
fd2
, and G
rf2
(growth rates at different periods g = basic
growth, fd1 = first three-week feed deprivation, rf1 = first three-week re-feeding,
fd2 = second three-week feed deprivation, rf2 = second three-week re-feeding).
a
N = 365.
VG/VP ± S.E.
a
BW
255
0.63 0.11
CI 0.29 0.11
RFI 0.23 0.09
G
g
0.69 0.10
G
fd1
0.43 0.12
G
rf1
0.46 0.12
G
fd2
0.32 0.11
G
rf2
0.51 0.12
Table II. Mean values and F test values of clone, tank, and clone*tank effects on body
weight (BW), one-day meal feed intake (FI), body weight gain (BWG), cumulative
feed intake (CI), and residual feed inta ke (RFI) from 10 rainbow trout clones.
Exponents indicate the age of the fish when traits were recorded.
BW
255
BW
277
BW
298
FI
255
FI
277
FI
298
BWG
a
CI
a
RFI
a
Mean (g) 88.2 132.7 184.6 1.55 1.51 2.03 96.4 71.42 0
F
clone
105.7
***
104.5
***
111.8
***
5.29
**
6.1
***
14.8
***
86.1
***
15.0
***
11.2
***
F
tank
17.1
***
22.4
***
16.0
***
2.09 11.6
***
17.2
***
10.14
***
11.1
***
11.7
***
F
clone*tank
1.08 1.14 1.07 1.42
*
1.48
*
1.72
**
1.25 1.65
**
1.58
*
a
255–298; *P < 0.05; **P < 0.01; ***P < 0.001; N = 365.
Selection for residual feed intake in fish
617
Whether t hey were taken separately or in combination, G were not signifi-
cantly c orrelated with R F I either during feed deprivati on or during re-feeding
(Tab. IV). Nevertheless, combin i ng both p eriods of feed deprivation markedly
improved the proportion o f predicted RFI variations. Moreover , re-feeding peri-
ods seemed to be better correlated w ith RFI than were feed deprivation periods.
For both the first and second periods, the integration and weighting o f G
fd
and
G
rf
improved the proportion of explained RFI variation. The first period
explained R FI variation slightly better than the s econd one. The best predictive
criterion was obtained when all the G genetic v alues were combined in a single
index (Fig. 2). Weighting coefficients of G
fd
were lar ger in absolute value than
those of t he G
rf
, probably b ecause weight loss during feed deprivation was pro-
portionally lower than weight gain during re-feeding.
Finally, it is important to note that the basic g rowth G
g
(i.e. the growth period
recorded after the characterization of RFI) is not correlated with RFI.
4. DISCUSSION
The p resent study demonstrates substantial genetic-based variation of RFI in
rainbow trout. The use of c lones has made it possible to buffer environmental
and/or methodological variations in the t rait, such as those arising from
Table IV. Coefficients of determination (R
2
) between genetic values of indirect criteria
and residual feed intake from 10 rainbow trout clones for G
g
, G
fd1
, G
rf1
, G
fd2
, and G
rf2
(growth rates at different periods g = basic growth, fd1 = first three-week feed
deprivation, rf1 = first three-we ek re-feeding, fd2 = second three-week feed depri-
vation, rf2 = second three-week re-feeding) and composite criteria (a, b, c, d, e),
corrected by weighti ng coefficients.
P
value
= probability that the correlation differs from zero;
f
N = 10.
Indirect Criteria R
2f
P
value
G
g
0.02 0.73
G
fd1
0.07 0.46
G
rf1
0.21 0.19
G
fd2
0.01 0.74
G
rf2
0.22 0.17
G
fd1
À 0.85ÆG
fd2
c
0.20 0.19
G
rf1
+ 5.68ÆG
rf2
d
0.22 0.17
G
fd1
+ 0.36ÆG
rf1
a
0.53 0.02
G
fd2
+ 0.29ÆG
rf2
b
0.44 0.04
G
fd1
+ 0.07ÆG
rf1
– 0.44ÆG
fd2
+ 0.10ÆG
rf2
e
0.59 < 0.01
618 L. Grima et al.
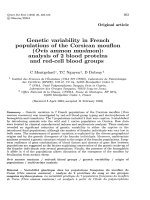
day-to-day discrepancies in feed intake measured with the X-ray technique. We
found a positive relationship between RFI a nd feed intake (Fig. 2), which is in
line with the negative phenotypic correlation generally found between feed effi-
ciency and feed intake [35]. RFI did not co-vary with initial body weight (data
not shown), thus guaranteeing that RFI differences measured between clones are
not due to initial differences in body weight (which would have implied variable
maintenance c osts [25]). Moreover i n t he present study, no c orrelation between
RFI a nd growth was observed, indicating that, in rainbow trout, high growth is
not strongly correlated w ith elevated RFI. All together these r esults suggest that
genetic variability exists for metabolic efficiency.
Overall, we have estimated that the genetic variation of R FI explains 23% of
the total phenotypi c variation and is significantly different from 0. T his result is
not surprising since genetic variability for feed efficiency is commonly observed
in endothermic terrestrial vertebrates [31]. However, because of the genetic
Weighting criteria
RFI
5
A
–15
–5
5
15
25
–15 –10 –5
0
51 5
9
7
6
8
3
4
1
10
2
Weighting criteria
RFI
A
5
15
25
0
51015
8
1
10
2
–10
–20
0
10
20
30
–20 –10 10 20 30
CI
RFI
2
8
4
9
3
6
5
10
1
7
B
RFI
1
B
Figure 2. Correlations, for 10 rainbow trout clones (1–10), between residual feed
intake (RFI) and different indirect criteria : A = weighte d criteria; B = cumulative
feed intake (CI). Weighted indirect criteria correspond to the sum of all types of G
(growth rates) corrected by the weighting coefficients (see Tab. IV). Each square
represents a clone.
Selection for residual feed intake in fish
619
structure of our population (genetically identical fish and a single d am common
to all individuals), this value cannot be compared with data found in the l itera-
ture. Few studies have assessed g enetic varia bility of feed efficiency in fish
[15,21,23,33,36,39]. Among these only one study gives precise diff erences in
RFI among families and individuals [35]. In this study, inter-individual RFI vari-
ations were measured on 40 fish held individually; fish body weight varied
between 100 and 200 g and the RFI ranged between À0.77 and 0.76 g per day.
However , these individual variations were confounded with possible tank
effects. The use of individual tanks also prevented t aking into account any effect
from social interactions. From 70 families of European whitefish (Cor egonus
lavar etu s) and using t he X-ray technique to record individual feed intake,
Quinton et al. were able to estimate genetic components of feed efficiency from
fishheldinacommontank[33]. The level of phenotypic variation explained by
genetic variations in this study was low (0.06 ± 0.10), which does not agree
with our results. This may be due to dif ference s in family structure b etween
the two studies. Indeed, in our study, for each trait recorded, the use of clones
enabled us to characterize precisely genotype performances and therefore to
emphasize the genetic component of phenotypic variations. This assumption
is corroborated by the fact that for traits easy t o m easure, such as body weight
gain, we estimated that the g enetic variation explained 63% of the total pheno-
typic variation, while Quinton et al. estimated that the genetic variation
explained 26% of the total phenotypic variation.
We have also validated that weight loss after a three-week feed deprivation
and weight gain after a three-week period of re-feeding are suitable indirect cri-
teria for the genetic improvement of RFI. The most relevant indirect criteria a re
those integrating several experimental periods. Indeed, integrating several exper -
imental periods and assigning to them weighting coefficients increase the d egree
of pred i ction from 0 .07 to 0 .20% for t he feed deprivation periods, from 21 to
53% for the first period of feed deprivation/re-feeding, and from 22 to 44%
for the second period. In addition, the combination of all the experimental
periods leads to a marked increase in t he percentage of RFI variance explained
by the i ndirect criteria, which then reached 59%. This h ighlights t he interest in
using composite criteria t hat allow combining both performances exhibited dur-
ing feed deprivation and compensatory growth periods. Since, only perfor-
mances during feed deprivation or re-feeding periods did not correlate with
RFI, we could not verify the hypothesis that weight loss during feed deprivation
and wei ght gain during re-feeding reflect variations in maintenance requirements
and metabolic efficiency. Nevertheless, we confirm that, when combining feed
deprivation and compensatory growth periods, they constitute a relevant
indicator of RFI variations. However, even when a ll the G are integrated,
620
L. Grima et al.
40% of the RFI variation remains unexplained. It may be necessary to include
additional indirect criteria in a breeding program to improve the percentage of
RFI v ariation that can be predicted. Such additional criteria could i nclude body
lipid percentage as previously proposed [34].
The significant genetic correlation between the two periods of feed depriva-
tion and the two periods of re-feeding shows that fish responses to feed depri-
vation and re-feeding are stable through time. Nevertheless, the first p eriod of
feed deprivation/re-feeding correlates better with RFI than the s econd. The
differing level of response between the two periods may be the consequence
of rapid fish adaptation to a repeated cycle o f feed deprivation and re-feeding
[1,3,42], with a m odulation of their physiological responses. F inally, we have
demonstrated that the extent of phenotypic v ariation of weight loss during feed
deprivation and compensatory growth explained b y genetic variations is signif-
icantly different from 0, confirming that, when used in combination, they are
pertinent indirect criteria for selection.
We have shown that genetic variability exists for RFI in rainbow trout, con-
firming that genetic improvement is possible for this trait. Moreover, this vari-
ability is significantly correlated with traits integrating fish performances
during feed deprivation and re-feeding. This is the first time t hat a correlation
between RFI and traits easy t o record has been reported. These traits provide
ways of studying the origin of RFI dif ferences and are excellent candidates
for future selective breeding programs on RFI based on indirect criteria.
ACKNOWLEDGEMENTS
Authors thank two anonymous referees for their constructive comments on an
earlier version of this manuscript. Authors are also grateful to Laurent Espinat
and Nicolas Collanges f or the d aily care of the fish and sampling, Marc
Vandeputte for his great help in data analyses, Sandrine Le Guillou for selection
and management of the clone breeders, Amandine Launay for verifying the
homozygous status of each breeder, and Marie Aurenche for her h elp during
the planning of the experimental protocol.
REFERENCES
[1] Ali M., Wootton R.J., Capacity for growth compensation in juvenile three-
spined sticklebacks experiencing cycles of food deprivation, J. Fish Biol. 58
(2001) 1531–1544.
[2] Becker W.A., Manual of procedures in quantitative genetics, Pullmann,
Washington, 1967.
Selection for residual feed intake in fish
621
[3] Blake R.W., Inglis S.D., Chan K.H.S., Growth, carcass composition and plasma
growth hormone levels in cyclically fed rainbow trout, J. Fish Biol. 69 (2006)
807–817.
[4] Bordas A., Tixier-Boichard M., Me´rat P., Direct and correlated responses to
divergent selection for residual food-intake in rhode- island red laying hens, Br.
Poult. Sci. 33 (1992) 741–754.
[5] Boujard T., Cuvier A., Geurden I., Lab be L., Mambrini M., Selection for growth
and feeding hierarchy in brown trout, Appl. Anim. Behav. Sci. 99 (2006)
344–356.
[6] Chevassus B., Quillet E., Krieg F., Hollebecq M.G., Mambrini M., Labbe
A.F.L., Hiseux J.P., Vandeputte M., Enhanced individual selection for selecting
fast growing fish: the ‘‘PROSPER’’ method, with application on brown trout
(Salmo trutta fario), Genet. Sel. Evol. 36 (2004) 643–661.
[7] Cho C.Y., Feeding systems for rainbow-trout and other salmonids with reference
to current estimates of energy and protein-requirements, Aquaculture 100 (1992)
107–123.
[8] Cho C.Y., Bureau D.P., Determination of the energy requirements of fish with
particular reference to salmonids, J. Appl. Ichthyol. 11 (1995) 141–163.
[9] Crews D.H., Genetics of feed evaluation and national cattle evaluation: a review,
Genet. Mol. Res. 4 (2005) 152–165.
[10] Diter A., Quillet E., Chourrout D., Suppression of first egg mitosis induced by
heat shocks in the rainbow-trout, J. Fish Biol. 42 (1993) 777–786.
[11] Gilmour A.R., Gogel B.J., Cullis B.R., Welham S.J., Thompson R., ASReml
user guide release 1.0, 2002.
[12] Gjedrem T., Developments in fish breeding and genetics, Acta Agr. Scand.
A Anim. Sci. (1998) 19–26.
[13] Gunsett F.C., Problems associated with selection for traits defined as a ratio
of two component traits, in: Proceedings of the 3rd World Congress of
Genetics Applied to Livestock Production, 1986, Vol. 11, Lincoln, NE, USA,
pp. 437–442.
[14] Helland S.J., GrisdaleHelland B., Nerland S., A simple method for the
measurement of daily feed intake of groups of fish in tanks, Aquaculture 139
(1996) 157–163.
[15] Henryon M., Jokumsen A., Berg P., Lund I., Pedersen P.B., Olesen N.J.,
Slierendrecht W.J., Genetic variation for growth rate, feed conversion efficiency,
and disease resistance exists within a farmed population of rainbow trout,
Aquaculture 209 (2002) 59–76.
[16] Herd R., Oddy V., Richardson E., Biological basis for variation in residual feed
intake in beef cattle. 1. Review of potential mechanisms, Aust. J. Exp. Agr.
(2004) 44.
[17] Hoque M.A., Suzuki K., Kadowaki H., Shibata T., Oikawa T., Genetic
parameters for feed efficiency traits and their relationships with growth and
carcass traits in Duroc pigs, J. Anim. Breed. Genet. 124 (2007) 108–116.
622 L. Grima et al.
[18] Jobling M., Techniques for measuring feed intake, in: Coves D., Damsgard B.,
Kristiansen H.R., Koskela J., Petursdottir T.E., Kadri S., Gudmundsson O.
(Eds.), Food intake in fish, Oxford, 2001, pp. 49–96.
[19] Jobling M., Jorgensen E.H., Siikavuopio S.I., The influence of previous feeding
regime on the compensatory growth-response of maturing and immature Arctic
Charr, Salvelinus-Alpinus, J. Fish Biol. 43 (1993) 409–419.
[20] Kause A., Tobin D., Dobly A., Houlihan D., Martin S., Mantysaari E.A., Ritola
O., Ruohonen K., Recording strategies and selection potential of feed intake
measured using the X-ray method in rainbow trout, Genet. Sel. Evol. 38 (2006)
389–409.
[21] Kause A., Tobin D., Houlihan D.F., Martin S.A.M., Mantysaari E.A., Ritola O.,
Ruohonen K., Feed efficiency of rainbow trout can be improved through
selection: different genetic potential on alternative diets, J. Anim. Sci. 84 (2006)
807–817.
[22] Kinghorn B., Genetic-variation in food conversion efficiency grow th in
rainbow-trout, Aquaculture 32 (1983) 141–155.
[23] Kolstad K., Grisdale-Helland B., Gjerde B., Family differences in feed
efficiency in Atlantic salmon (Salmo salar), Aquaculture 241 (2004) 169–177.
[24] Komen H., Thorgaard G.H., Androgenesis, gynogenesis and the production of
clones in fishes: a review, Aquaculture 269 (2007) 150–173.
[25] Lupatsch I., Kissil G.W., Sklan D., Comparison of energy and protein efficiency
among three fish species gilthead sea bream (Sparus aurata), European sea bass
(Dicentrarchus labrax) and white grouper (Epinephelus aeneus): energy
expenditure for protein and lipid deposition, Aquaculture 225 (2003) 175–189.
[26] Mambrini M., Sanchez M.P., Chevassus B., Labbe L., Quillet E., Boujard T.,
Selection for growth increases feed intake and affects feeding behavior of brown
trout, Livest. Prod. Sci. 88 (2004) 85–98.
[27] Mambrini M., Medale F., Sanchez M.P., Recalde B., Chevassus B., Labbe L.,
Quillet E., Boujard T., Selection for growth in brown trout increases feed intake
capacity without affecting maintenance and growth requirements, J. Anim. Sci.
82 (2004) 2865–2875.
[28] McCarthy I.D., Houlihan D.F., Carter C.G., Moutou K., Variation in individual
food-consumption rates of fish and its implication s for the study of fish nutrition
and physiology, Proc. Nut. Soc. 52 (1993) 427–436.
[29] McCarthy I.D., Houlihan D.F., Carter C.G., Individual variation in protein-
turnover and growth efficiency in rainbow-trout, Oncorhynchus-mykiss
(Walbaum), Proc. R. Soc. B Bio. 257 (1994) 141–147.
[30] Nikki J., Pirhonen J., Jobling M., Karjalainen J., Compensatory growth in
juvenile rainbow trout, Oncorhynchus mykiss (Walbaum), held individually,
Aquaculture 235 (2004) 285–296.
[31] Pitchford W.S., Genetic improvement of feed efficiency of beef cattle: what
lessons can be learnt from other species?, Aust. J. Exp. Agr. 44 (2004) 371–382.
Selection for residual feed intake in fish
623
[32] Quillet E., Dorson M., Le Guillou S., Benmansour A., Boudinot P., Wide range
of susceptibility to rhabdoviruses in homozygous clones of rainbow trout, Fish
Shellfish Immunol. 22 (2007) 510–519.
[33] Quinton C.D., Breeding salmonids for feed efficiency in current fishmeal and
future plant-based diet environments, Genet. Sel. Evol. 39 (2007) 431–446.
[34] Quinton C.D., Kause A., Ruohonen K., Koskela J., Genetic relationships of
body composition and feed utilization traits in European whitefish (Coregonus
lavaretus L.) and implications for selective breeding in fishmeal- and soybean
meal-based diet environments, J. Anim. Sci. 85 (2007) 3198–3208.
[35] Silverstein J.T., Relationships among feed intake, feed efficiency, and growth in
juvenile rainbow trout , N. Am. J. Aquacult. 68 (2006) 168–175.
[36] Silverstein J.T., Hostuttler M., Blemings K.P., Strain differences in feed
efficiency measured as residual feed intake in individually reared rainbow trout,
Oncorhynchus mykiss (Walbaum), Aquac. Res. 36 (2005) 704–711.
[37] Snowder G.D., van Vleck L.D., Estimates of genetic parameters and selection
strategies to improve the economic efficiency of postweaning growth in lambs,
J. Anim. Sci. 81 (2003) 2704–2713.
[38] Thodesen J., Grisdale-Helland B., Helland S.J., Gjerde B., Feed intake, growth
and feed utilization of offspring from wild and selected Atlantic salmon (Salmo
salar), Aquaculture 180 (1999) 237–246.
[39] Thodesen J., Gjerde B., Grisdale-Helland B., Storebakken T., Genetic variation
in feed intake, growth and feed utilization in Atlantic salmon (Salmo salar),
Aquaculture 194 (2001) 273–281.
[40] Thodesen J., Storebakken T., Shearer K.D., Rye M., Bjerkeng B., Gjerde B.,
Genetic variation in mineral absorption of large Atlantic salmon (Salmo salar)
reared in seawater, Aquaculture 194 (2001) 263–271.
[41] Tixier-Boichard M., Boichard D., Groeneveld E., Bordas A., Restricted
maximum-likelihood-estimates of genetic-parameters of adult male and female
rhode-island red chickens divergently selected for residual feed consumption,
Poultry. Sci. 74 (1995) 1245–1252.
[42] Wu L., Xie S., Cui Y., Wootton R.J., Effect of cycles of feed deprivation on
growth and food consumption of immature three-spined sticklebacks and
European minnows, J. Fish Biol. 62 (2003) 184–194.
624 L. Grima et al.