Báo cáo sinh học: "Genetic variation in eight Chinese cattle breeds based on the analysis of microsatellite markers" potx
Bạn đang xem bản rút gọn của tài liệu. Xem và tải ngay bản đầy đủ của tài liệu tại đây (582.27 KB, 12 trang )
Original article
Genetic variation in eight Chinese cattle
breeds based on the analysis
of microsatellite markers
Weibin SUN
1
, Hong CHEN
1,2
*
, Chuzhao LEI
1
, Xueqin LEI
3
,
Yinghan Z
HANG
1
1
College of Animal Science and Technology, Northwest A&F University, Shaanxi Key
Laboratory of Molecular Biology for Agriculture, Yangling, Shaanxi 712100, China
2
Institute of Cellular and Molecular Biology, Xuzhou Normal University, Xuzhou,
Jiangsu 221116, China
3
Henan Sci-tech University, Luoyang, Henan 471000, China
(Received 16 December 2007; accepted 16 May 2008)
Abstract – Genetic variability and genetic relationships were investigated among eight
Chinese cattle breeds using 12 microsatellite markers. Three hundred and fifty-two alleles
were detected and the average number of alleles per locus ranged from 8.33 ± 1.67 in the
Jiaxian breed to 21.33 ± 5.60 in the Qinchuan breed with a mean value of 13.91. The total
number of alleles per microsatellite ranged from 21 (INRA005, HEL1)to40(HEL13), with a
mean of 29.33 per locus. The fixation indices at the 12 loci in the eight breeds were very low
with a mean of 0.006. A principal components analysis and the construction of a neighbor-
joining tree showed that these eight Chinese cattle breeds cluster into three groups i.e. the
Yanbian and Chinese Holstein, the Nanyang and Jiaxian,and the four remaining breeds. This
clustering agrees with the origin and geographical distributions of these Chinese breeds.
Chinese cattle breed / microsatellite DNA / genetic variability / genetic relationship
1. INTRODUCTION
Since t he 1980s, the Chinese beef industry has expanded considerably and
this progress has been accompanied by the introduction of several foreign spe-
cialized beef breeds, especially from Europe. European breeds are often used as
sire lines for crossbreeding with Chinese indigenous cattle breeds. Such breed-
ing schemes have contributed in improving individual weight gain and beef
carcass weight of Chinese breeds [27], which only account for two-thirds of
the world average level and about one half of that in developed countries, such
as Canada, Australia, and USA. However , such crossbreeding with foreign
*
Corresponding author:
Genet. Sel. Evo l. 40 (2008) 681–692
Ó INRA, EDP Sciences, 2008
DOI: 10.1051/gse:2008027
Available online at:
www.gse-journal.org
Article published by EDP Sciences
breeds also results in consistent and rapid loss of genetic diversity b y d ilution of
the autochthonous genetic makeup.
The existence of genetic polymorphism or diversity in a population is the
basis of genetic improvement by selection and needs to be accurately estimated
[23]. In the past decades, a nimal genetic diversity has been assessed according to
various criteria including phenotypic, biochemical, and molecular parameters.
With the development of molecular biology techniques, nucleotide variations
in DNA sequences can be detected directly such as microsatellite markers iden-
tified in all eukaryotic species investigated so far [3,18]. Microsatellite markers
have become the mainstay of g enetic li nkage mapping and quantitat ive trait loci
identification for economic traits and they have also been used to address ques-
tions concerning the ge netic diversity and the genetic relationships in species
such as cattle [ 11]. However, in cattle, most of t hese studies have focused o n
European breeds and little information is available on the genetic diversit y of
Chinese indigenous cattle breeds. The purpose of the present study was to eval-
uate the genetic diversity of eight cattle breeds in China based on microsatellite
markers and to estimate the genetic relationships among these eight breeds.
2. MATERIALS AND METHODS
2.1. Sample collection for DNA analysis
Three hund red and t hirty animals from eight Chinese indigenous cattle breeds
i.e. Qinchuan (QC, 120), Nanyang (NY, 30), Jiaxian (JX, 30), Luxi (LX, 30), Bohai
(BH, 30), Jinnan (JN, 30), Chinese Holstein (CH, 30), and Yanbian (YB, 30) were
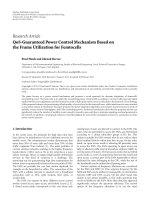
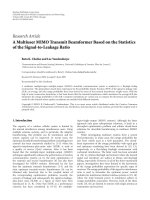
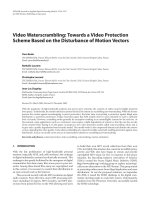
analyzed. Blood and tissue samples were collected from various geographical
locations (Fig. 1), because these breeds are distributed over fi ve Chinese provinces
(Jilin, Shandong, Shaanxi, Shanxi, and Henan). Economically, the most important
cattle breeds in China are the Qinchu an, Jinnan, Na nyang, Luxi, an d Yanbian
breeds since they represent 90% of t he retail beef market share in C hina.
2.2. DNA extraction and PCR amplification
DNA was extracted using standard SDS l ysis, proteinase K digestion, phenol/
chloroform extraction, and ethanol precipitation [19]. DNA samples were resus-
pended in TE buffer (10 mmolÆL
À1
Tris-HCl, 1 mmolÆL
À1
EDTA, pH = 8) and
stored at À20 °C.
Twelve bovine microsatellite markers were selected from the CaDBase
database on Genetic Diversity in Cattle ( />markers.html) and the USDA Cattle Genome M apping Project ( http://
www.marc.usda.gov/genome/cattle/cattle.html).
682
W. Sun et al.
Polymerase chain reactions (PCR) were performed in 12 lL reaction mix-
tures using the Biometra T Gradient Thermal Cycler ( Germany). Each reaction
mixture contained 1.0 lL (final concentration 0.5 UÆlL
À1
)ofExTaq
TM
,
DNA polymerase (TaKaRa Biotechnology Co., Ltd., Japan), 1.2 lLof
10 X PCR buffer , 1.5 lLofMgCl
2
(25 mmolÆL
À1
), 0.75 lLofdNTPs
(2.5 mmolÆL
À1
), 1.0 lL of primers (10 lmolÆL
À1
), 2.0 lL of template DNA
(50 ngÆlL
À1
), and 4.55 lL of sterile H
2
O. The following PCR conditions were
used: initial denaturation at 95 °C for 2 min, followed by 35 cycles of 30 s at
94 °C (denaturation), 30 s at the optimal temperature for each prime r pair
(annealing), and 45 s at 72 °C (elongation), and a final extension step
at 72 °C for 10 min. The reaction m ixtures were stored at 4 °C. After t he
PCR amplification, 3–4 lL of PCR product was loaded onto an 8% polyacryl-
amide non-denaturing gel with pBR322 DNA/MspI as the molecular size
marker. After electrophoresis (3–4 h at 120 V), the gels were stained with silver
Figure 1. Geographic localizations of the eight cattle breeds analyz ed in this study.
YB: Yanbian, BH: Bohai, JN: Jinnan, LX: Luxi, QC: Qinchuan, CH: Chinese
Holstein, JX: Jiaxian, NY: Nanyang.
Microsatellite analysis in Chinese cattle breeds
683
nitrate and the fragment sizes were read using the Kodak D igital Science ID
Image Analysis System.
2.3. Data analysis
First, genotyping data were processed with t he Excel Microsat ellite Toolkit
[14]( Then, we used
the F-stat software (2.9.3.2) to determine the geneti c v ar iation within and
between breeds, the number of alleles, and the heterozygosities, and the W right
F-statistics [25]andtheDISPAN software [13] to calculate genetic distances
(D
A
)[12]. A principal components analysis (PCA) of allelic frequencies was
carried out according t o t he procedures described by Cavalli-Sforza et al .[4]
using SPSS (11.5.0). Phylogenetic a nalyses were conducted with the MEGA4
software package [22] using the neighbor-joining method [18].
3. RESULTS
3.1. Genetic variability
Overall, 352 alleles were detected for the 12 microsatellite loci in 350 animals
from the eight Chinese cattle breeds s tudied with the number of alleles p er locus
ranging from 21 (INRA005, HEL1)to40(HEL13) and with a m ean of 29.33.
When analyzing the breeds separately, the number of alleles per locus ranged
from 8.33 ± 1.67 (Jiaxian breed) to 21.33 ± 5.60 (Qinchuan breed) w ith a mean
of 13.91 (Tabs. I and II). Overall, 61 breed-private alleles w ere found in t he eight
breeds, 25 were identified in the Qi nchuan breed, w hile only one was d etected in
each of the Jiaxian and Jinnan breeds. The mean number of alleles per locus in
the Qinchuan breed was significantly larger than that i n t he other b reeds. Except
for m icros atellites BM1824, TGLA227,andBM315 in the N anyang breed,
TGLA227, HEL 5, HEL9,andBM315 in Jinnan, BM2113 and HEL13 in Chinese
Holstein, TGLA227 in Luxi, INRA005 in Jiaxian, and HEL9 and INRA005 in
Yanbian, which were in Hardy-Weinberg equilibrium (P > 0.05), all other loci
departed from the Hardy-Weinberg equilibrium ( P <0.01 or P < 0.05, data
are not shown here).
For the 12 microsatellite loci, observed heterozygosities and expected hetero-
zygosities ranged from 0 .78 (INRA005)to0.95(BM1824) a nd from 0.86
(TGLA126, INRA005)to0.93(HEL13), respectively. The values of observed
heterozygosity and expected heterozygosity at loci BM1824, BM2113,
TGLA126,andHEL1 dif fered significantly (P <0.01orP < 0.05). Observed
heterozygosities and expected heterozygosities across the eight breeds varied
684
W. Sun et al.
Table I. Number of microsatellite alleles observed (N), range of allele sizes, observed heterozygosities (H
O
), expected heterozygosities
(H
S
), PIC, allelic richness, and fixation indices at each locus.
Locus Number of
alleles (N)
Sizes of
alleles (bp)
H
O
H
S
PIC Allelic
richness
Fixation indices
F
IS
F
IT
F
ST
BM1824 28 171–247 0.95
a
0.89
b
0.87 7.40 À0.06 À0.02 0.04
BM2113 31 124–170 0.98
A
0.91
B
0.88 7.87 À0.07 À0.04 0.03
CSSM66 36 175–247 0.91 0.90 0.86 7.50 À0.01 0.03 0.03
ETH152 28 179–235 0.85 0.90 0.86 7.81 0.06
**
0.10 0.04
TGLA126 22 113–149 0.92
a
0.86
b
0.86 6.71 À0.06 À0.02 0.04
TGLA227 31 67–125 0.94 0.90 0.86 7.67 À0.05
*
À0.002 0.05
INRA005 21 135–177 0.78 0.86 0.82 6.17 0.10 0.14 0.04
HEL1 21 101–145 0.94
A
0.89
B
0.85 6.83 À0.06 À0.03 0.02
HEL5 31 119–205 0.73 0.91 0.87 7.70 0.20 0.23 0.04
HEL9 33 141–193 0.94 0.91 0.88 7.88 À0.03 0.00 0.03
HEL13 40 142–228 0.87 0.93 0.89 8.27 0.07
**
0.09 0.02
BM315 30 102–174 0.91 0.92 0.88 8.08 0.01
**
0.04 0.03
Total 352 – – – – – – – –
Mean 29.33 – 0.89 0.90 0.87 – 0.008 0.04 0.04
Notes: H
O
, H
S
marked with different letters were significantly different to each other (
a,b
: P < 0.05,
A,B
: P < 0.01); F
IS
values marked with
**
or
*
were significantly different from zero (
**
P < 0.01,
*
P < 0.05).
Microsatellite analysis in Chinese cattle breeds
685
from 0.81 (Qinchuan breed) to 0.95 (Luxi breed) and from 0.86 (Jiaxian breed)
to 0.93 (Jinnan breed), respectively. F
IS
values of the Qinchuan and Yanbian
breeds were significantly different from 0 (P <0.01orP < 0.05). Allelic rich-
ness (mean number of alleles per locus) in the eight populations ranged from
6.17 (INRA005)to8.27(HEL13), with a m ean of 7.49. F
IS
values at loci
ETH152, TGLA227, HEL13,andBM315 differed significantly from 0
(P <0.0lorP < 0.05). I n all the eight breeds, F
IS
values were very low, with
negative v alues in J iaxian, Luxi, and Bohai breeds and positive values i n
Qinchuan, Nanyang, Jinnan, Chinese Holstein, and Yangbian breeds. The means
of F
IS
, F
IT
,andF
ST
at the 12 microsate llite loci a nd in the eight breeds we r e
0.01, 0.04, and 0.04, which indicate that 4% of the genetic variability depends
on the breed and 96% on the individual’s genotype. Average polymorphism
information c ontent (PIC) v alues for the 12 l oci ranged from 0.82 (INRA005)
to 0.89 ( HEL13) and all these loci appeared to be highly informative (PIC >0.5)
in the eight breeds.
3.2. Breed relationships and genetic distances
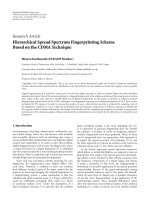
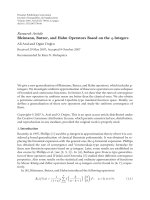
A PCA was p erformed for allelic frequencies using the breed as the only fac-
tor to summarize breed relationships (Fig. 2). The percentages of v ariance
explained by the first three components were 41.63%, 13.98%, and 1 1.25%,
respectively. According to the principal component matrix (not shown here),
Table II. Mean number of alleles per locus (NA), expected and observed
heterozygosities (H
S
and H
O
), PIC, breed-private allele numbers, and F
IS
observed
from the 12 microsatellites in eight Chinese cattle breeds.
Breeds NA H
S
H
O
PIC Private
allele
number
F
IS
Qinchuan 21.33 0.81 0.91 0.90 25 0.09
**
Nanyang 13.08 0.89 0.90 0.87 14 0.01
Jiaxian 8.33 0.87 0.86 0.80 1 À0.02
Luxi 14.67 0.95 0.91 0.88 5 À0.05
Bohai 13.92 0.92 0.89 0.86 2 À0.03
Jinnan 13.67 0.92 0.93 0.87 1 0.003
Chinese Holste in 12.58 0.86 0.89 0.85 4 0.04
Yanbian 13.67 0.90 0.91 0.88 9 0.01
*
Total – – – – 61 –
Mean – 0.81 0.90 0.87 7.63 0.006
Note: F
IS
values marked with
**
or
*
were significantly different from zero (
**
P < 0.01,
*
P < 0.05).
686 W. Sun et al.
the first principal components of the eight breeds were all positive, the second
principal c omponents were negative for the Yanbian, Chinese Holstein, and
Bohai b reeds and positive for the o thers, the third principal components w e re
positive for the Qinchuan, Luxi, and Jinnan breeds and negative for the others.
Thus, these eight cattle breeds can be roughly divided into three groups:
Yanbian, Chinese Holstein, and Bohai breeds in one group, Qinchuan, Luxi,
and Jinnan breeds in the second group, and Jiaxian and Nanyang breeds in
the third group.
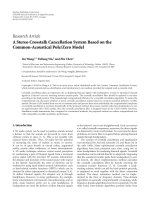
Allele frequencies were u sed to generate the D
A
genetic distance for each pair
of cattle breeds (Tab. III). The D
A
genetic distances ranged from 0.229 (between
Bohai a nd Jiaxian breeds) to 0.56 (between Yanbian and Nanyang breeds).
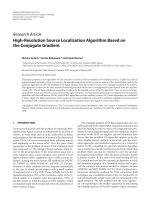
These D
A
genetic distances were used to construct a neighbor-joining tree
(Fig. 3) revealing the clustering of the eight populations into three groups:
(1) Yanbian and Chinese Holstein breeds; (2) Qinchuan, Luxi, and Jinnan
breeds; and (3) Nanyang, Jiaxian, and Bohai breeds.
Figure 2. Three-dimensional plot of PAC1, PAC2 vs. PAC3 based on allele
frequencies of 12 microsatellite markers in eight breeds. YB: Yanbian (0.403, 0.716,
and 0.136); CH: Chinese Holstein (0.559, 0.538, and 0.010); BH: Bohai (0.747,
0.126, and 0.020); QC: Qinchuan (0.803, À0.116, and À0.166); LX: Luxi (0.694,
À0.118, and À0.269); JN: Jinnan (0.656, À0.224, and À0.541); NY: Nanyang (0.588,
À0.443, and 0.425); and JX: Jiaxian (0.629, À0.161, and 0.554).
Microsatellite analysis in Chinese cattle breeds
687
4. DISCUSSION
4.1. Genetic diversity
Population genetic diversity can be evaluated by t he number of alleles per
locus, the average number of alleles for all loci, heterozygosity, and PIC value.
In this study, 352 alleles were found for the 12 microsatellite loci across the eight
Chinese bovi ne breeds examined. The average number of alleles per l ocus,
considering all eight populations, was 29.33. It has been determined that
microsatellite loci used to estimate genetic distances should have at least
four alleles in order to reduce the sta nda rd errors of distance estimates [ 1].
Thus, all the m icrosatellite markers u sed i n t his s tudy are suitable f or population
Figure 3. Genetic relationships between eight Chinese cattle breeds. Placements
were inferred using the neighbor-joining method. Numbers represent the percentage
of times that a node occurred in 1000 bootstrap replicates. YB: Yanbian, BH: Bohai,
JN: Jinnan, LX: Luxi, QC: Qinchuan, CH: Chinese Holstein, JX: Jiaxian,
NY: Nanyang.
Table III. D
A
genetic distances computed using allele frequencies of the 12 micro-
satellite makers among eight Chinese cattle breeds.
Breeds Qinchuan Nanyang Jiaxian Bohai Luxi Jinnan Chinese
Holstein
Yanbian
Qinchuan 0
Nanyang 0.389 0
Jiaxian 0.370 0.3841 0
Bohai 0.297 0.441 0.229 0
Luxi 0.278 0.452 0.417 0.291 0
Jinnan 0.301 0.449 0.490 0.298 0.265 0
Chinese
Holstein
0.332 0.516 0.475 0.331 0.343 0.364 0
Yanbian 0.402 0.558 0.547 0.369 0.392 0.459 0.381 0
688 W. Sun et al.
genetic diversity analyses. Sixty-one bree d-private alleles were identified over
the eight Ch inese bovine breeds with 25 present in the Qinchuan b reed and only
one in each of the Jiaxian and Jinnan breeds. The fact that in this study a higher
number of alleles and breed-private alleles were found at each locus in t he
Qinchuan breed can be explained by its larger population size. Th e l ar ger a pop-
ulation is, the more alleles with low frequencies can be detected [26].
Takezaki et al.[21] have suggested that for markers to be useful to measure
genetic variation, they should have an average heterozygosity higher than 0.3 in
the population. Marker heterozygosities in the eight populations of this study
range between 0.73 and 0.98 and thus it was considered that they were
appropriate.
PIC is an indicator of the degree of informativeness of a marker. According t o
the criteria of Botstein et al.[2], all 12 microsatellite loci included in this study
are highly informative (PIC > 0.5) and thus will be useful to evaluate the
genetic diversity in Chinese bovine breeds. The mean PIC content in the eight
studied populations was between 0.85 and 0.90, the Chinese Holstein breed
showing the lowest value and the Qinchuan breed the highest. The low PIC
of Chinese Holstein may be due to the high selection pressure applied in t his
breed for 100 years [16].
Since the early 19th century, when the concept of a breed grew in currency,
many European bovine breeds have become genetically isolated and in most cases
their o rigins can be traced to a small pool of founder individuals. This is also the
case for Chinese Holstein cattle, which h ave experienced a similar breeding prac-
tice. Thus, not only t he narrow genetic background of this breed but a lso the
inbreeding and the higher selection pressure, have contributed to the loss of
genetic variation, which is revealed by reduced allele numbers and lower PIC val-
ues [20]. Meanwhile, breeding strategies for Chinese native bovine breeds have
changed over time [5], but no extensive b re eding program for a specialized selec-
tion has be en undertaken during a sufficiently long period. Thus, these breeds still
possess an abundant genetic polymorphism at most loci, and indeed the 12 micro-
satellite loci analyzed in the eight breeds, here, are highly polymorphic.
4.2. Relationships and origin of Chinese bovine breeds
In Bovine Breeds i n C hina, published in 1986, 28 Chinese n ative breeds were
classified into three groups i.e. humpless, semi-humped, and humped types from
the north to the south [16]. The Yanbian breed, present in the north of China, is
humpless cattle and has been shown to be genetically close to European breeds
based on b lood polymorphisms [24] and karyotype analyses [8]. In our study,
we found that the Yanbian breed is positioned close to the Chinese Holstein
Microsatellite analysis in Chinese cattle breeds
689
breed both by PCA and construction of a phylog enetic tree with D
A
distances
(Figs. 2 and 3). The Nanyang breed is obviously humped cattle and has a
zebu-like Y chromosome [ 8] and could be phylogenetically close t o zebus,
but mtDNA sequencing analyses have indicated that the Nanyang breed
possesses maternal origins from both Bos taurus and Bos i ndicus [9]. Qinchuan,
Jinnan, Luxi, Bohai, and Jiaxian are semi-hump breeds and they are all distrib-
uted in central China and have complex Y chromosomal types [8]andmtDNA
haplotypes [ 9]. It has been shown that these breeds result from c rossbreeding
between northern breeds (B. taurus) and southern breeds (B. indicus)[7,10]
clustered together. In this study, the largest D
A
distance was found between the
Yanbian and Nanyang breeds (0.558), which is consistent with their geographical
localization (Fig. 1). The Bohai breed is the only Chinese bovine breed, which
has a black coat and thus it d if fers from other Chinese bovine breeds, w h ich
are yellow or red. The Bohai breed is positioned close to the Yanbian breed as
shown by PCA and by their geographic distributions, but in the phylogenetic tree,
it is found close to the Nanyang and Jiaxian breeds (Fig. 3).
Genetic and archeological evidence supports at least two domestication
events for cattle from dif ferent wild progenitors. The aurochs types B. taurus,
also termed taurine cattle, are postulated to have originated in the Near East
and Africa, while B. indicus, or zebu, have arisen in India and Africa [10].
The earliest domestic cattle known in North China were the progenies of the
Longhorn of B. taurus from Western Europe, which were distinguished from
bachryser os and B os p r imigenius taurus, a nd appeared with the introgression
of Mongolian i nto the huge and extensive area to the north of China [6,7,15].
These breeds gradually adapted to the l ocal environmental conditions and
expanded southward but the Qinling Mountains and the temperature and
weather conditions constituted natural barriers to t heir expansion. Meanwhile,
the humped zebu i nhabited the areas of the Yangtze and Zhujiang valleys and
might have originated from the Bibos genus, such as the zebu, Bos bateng,
and even Bos gaurus , w hich were also the progenitors of the zebu in South-
eastern Asia [6,7,17]. The cattle breeds localized in the central parts of
China a nd detouring the Qinling Mountains are situated at a cross-point and thus
the analysis of their origin, domestication, and migration is much more
complicated.
ACKNOWLEDGEMENTS
We thank Ms Helene Hayes for her kind help in editing the language and also
thank t he detailed co mments and advice from the reviewers. We are also grateful
to Dr. Minqiang Wang (Yantai University, C hina) a nd Mr. Xiaohong Lan
690
W. Sun et al.
(the Director of Shaanxi Qinchuan Cattle Farm, China) f or their generous help in
sample collection. This work was supported by the National Natural Science
Foundation of China (30471238, 30070551), the National High Technology
Research and Development P rogram of China (863 Program) (No.
2006AA10Z197), National Key Technology R&D Program (No.
2006BAD01A10-5), Innovative Foundation of Outstanding Talent from Henan
Province (No. 0521001900), Sustaining Program for Topnotch Persons of
Northwest A&F University (No. 01140101), Natural Science Foundation of
Xuzhou Normal University (No. 2003XY2 34), and Program for New Century
Excellent Talents in University of 2007 (NCET).
REFERENCES
[1] Barker J.S.F., A global protocol for determining genetic distances among
domestic livestock breeds, in: Proceedings of the 5th World Congress on
Genetics Applied to Livestock Production, Guelph and Ontario, Canada, 1994,
pp. 501–508.
[2] Botstein D., White R.L., Skolnick M., Davis R.W., Construction of a genetic
linkage map in human using restriction fragment length polymorphisms, Am. J.
Hum. Genet. 32 (1980) 314–331.
[3] Bradley D.G., Loftus R.T., Cunningham P., MacHugh D.E., Genetics and
domestic cattle origins, Evol. Anthropol. 6 (1998) 79–86.
[4] Cavalli-Sforza L.L., Menozzi P., Piazza A., The history and geography of human
genes, Princeton University Press, Princeton, NJ, 1994.
[5] Chen H., Strategies of selection and breeding for the beef performance in Qinchuan
cattle, J. Yellow Cattle Sci. 2 (2002) 1–4 (in Chinese with English abstract).
[6] Chen Y.C., Cao H.H., Diversity of Chinese yellow cattle breeds and their
conservation, Chin. Biodivers. 9 (2001) 275–283 (in Chinese with English abstract).
[7] Chen Y.C., Wang Y.Y., Cao H.H., Zhang Y., Characterist ics of Chinese yellow
cattle ecospecies an d their course of utilization, China Agriculture Press,
Beijing, China, 1990 (in Chinese).
[8] Lei C., Chen H., Hu S., Study on the Y chromosome polymorphisms and
origination and classification of Chinese cattle breeds, Acta Agriculturae Boreali
occidentalis Sinic a 4 (2000) 43–47 (in Chinese with English abstract).
[9] Lei C.Z., Chen H., Zhang H.C., Cai X., Liu R.Y., Luo L.Y., Wang C.F., Zhang
W., Ge Q.L., Zhang R.F., Lan X.Y., Sun W.B., Origin and phylogeographical
structure of Chinese cattle, Anim. Genet. 37 (2006) 579–582.
[10] Loftus R.T., MacHugh D.E., Bradley D.G., Sharp P.M., Cunningham E.P.,
Evidence for two independent domestications of cattle, Proc. Natl. Acad. Sci.
USA 91 (1994) 2757–2761.
[11] McHugh D.E., Loftus R.T., Bradley D.G., Sharp M., Cunningham E.P.,
Microsatellite DNA variation within and among European cattle breeds, Proc.
R. Soc. Lond. Ser. B 256 (1994) 25–31.
Microsatellite analysis in Chinese cattle breeds
691
[12] Nei M., Tajima F., Tateno Y., Accuracy of estimated phylogenetic trees from
molecular data, J. Mol. Evol. 19 (1983) 153–170.
[13] Ota T., DISPAN: genetic distance and phylogenetic analysis, Penn. State
University, University Park, PA, 1993.
[14] Park S.D.E., Trypanotolerance in West African cattle and the population genetic
effects of selection, Ph.D. thesis, University of Dublin, 2001.
[15] Payne W.J.A., Tropical cattle: origins, breeds and breeding policy, Blackwell
Science, Oxford, 1995.
[16] Qiu H., Qing Z.R., Chen Y.C., Wang A.D., Bovine breeds in China, Shanghai
Scientific and Technical Press, Shanghai, China, 1988 (in Chinese).
[17] Ron M., Blanc Y., Band M., Ezra E., Weller J.I., Misidentification rate in Israeli
dairy cattle population and its implications for genetic improvement, J. Dairy
Sci. 79 (1996) 676–681.
[18] Saitou N., Nei M., The neighbor-joining method: a new method for
reconstructing phylogenetic trees, Mol. Biol. Evol. 4 (1987) 406–425.
[19] Sambrook J., Russell D.W., Molecular cloning: a laboratory manual, 2nd edn.,
Cold Spring Harbor Laboratory Press, Beijing, 1992.
[20] Shan X., Zhang Y., Ning L.I., Effects of several microsatellite DNA loci on milk
production in dairy cattle, Acta Genet. Sinica 5 (2002) 430–433 (in Chinese with
English abstract).
[21] Takezaki N., Nei M., Genetic distances and reconstruction of phylogenetic tree
from microsatellite DNA, Genetics 144 (1996) 389–399.
[22] Tamura K., Dudley J., Nei M., Kumar S., MEGA4: molecular evolutionary
genetics analysis (MEGA) softwar e version 4.0, Mol. Biol. Evol. 24 (2007)
1596–1599.
[23] Tautz D., Notes on the definition and nomenclature of tandemly repetitive DNA
sequences, in: Pena S.D.J., Chakraborty R., Epplen J.T., Jeffreys A.J. (Eds.),
DNA Fingerprint: State of the Science, Birka¨user Verlag, Basel, 1993, p. 21.
[24] Wang Y., Cao H., Pang Z., Study on the blood polymorphisms of Chinese
yellow cattle breeds and their genetic relationships, in: Ecological Character-
istics and Utilization Directions, China Agriculture Press, Beijing, 1990 (in
Chinese with English abstract).
[25] Weir B.S., Cockerham C.C., Estimating F statistics for the analysis of population
structure, Evolution 38 (1984) 1358–1370.
[26] Yan L., Zhang D., Effects of sample size on various geneti c diversity measures
in population genetic study with microsatellite DNA markers, Acta Zool. Sinica
2 (2004) 279–290 (in Chinese with English abstract).
[27] Zhang Y., Several problems on the structure of Chinese animal production and
beef industry, J. Yellow Cattle 2 (2003) 4–8 (in Chinese with English abstract).
692 W. Sun et al.