Báo cáo sinh học: "Estimation of prediction error variances via Monte Carlo sampling methods using different formulations of the prediction error variance" ppsx
Bạn đang xem bản rút gọn của tài liệu. Xem và tải ngay bản đầy đủ của tài liệu tại đây (395.95 KB, 9 trang )
BioMed Central
Page 1 of 9
(page number not for citation purposes)
Genetics Selection Evolution
Open Access
Research
Estimation of prediction error variances via Monte Carlo sampling
methods using different formulations of the prediction error
variance
John M Hickey*
1,2,3
, Roel F Veerkamp
1
, Mario PL Calus
1
, Han A Mulder
1
and
Robin Thompson
4,5,6
Address:
1
Animal Breeding and Genomics Centre, Animal Sciences Group, PO Box 65, 8200 AB, Lelystad, The Netherlands,
2
Grange Beef Research
Centre, Teagasc, Dunsany, Co. Meath, Ireland,
3
School of Agriculture, Food and Veterinary Medicine, College of Life Sciences, University College
Dublin, Belfield, Dublin 4, Ireland,
4
School of Mathematical Sciences, Queen Mary, University of London, Mile End Road, London E1 4NS, UK,
5
Centre for Mathematical and Computational Biology, Rothamsted Research, Harpenden AL5 2JQ, UK and
6
Department of Biomathematics and
Bioinformatics, Rothamsted Research, Harpenden AL5 2JQ, UK
Email: John M Hickey* - ; Roel F Veerkamp - ; Mario PL Calus - ;
Han A Mulder - ; Robin Thompson -
* Corresponding author
Abstract
Calculation of the exact prediction error variance covariance matrix is often computationally too
demanding, which limits its application in REML algorithms, the calculation of accuracies of
estimated breeding values and the control of variance of response to selection. Alternatively Monte
Carlo sampling can be used to calculate approximations of the prediction error variance, which
converge to the true values if enough samples are used. However, in practical situations the
number of samples, which are computationally feasible, is limited. The objective of this study was
to compare the convergence rate of different formulations of the prediction error variance
calculated using Monte Carlo sampling. Four of these formulations were published, four were
corresponding alternative versions, and two were derived as part of this study. The different
formulations had different convergence rates and these were shown to depend on the number of
samples and on the level of prediction error variance. Four formulations were competitive and
these made use of information on either the variance of the estimated breeding value and on the
variance of the true breeding value minus the estimated breeding value or on the covariance
between the true and estimated breeding values.
Introduction
In quantitative genetics the prediction error variance-cov-
ariance matrix is central to the calculation of accuracies of
estimated breeding values ( ) [e.g. [1]], to REML algo-
rithms for the estimation of variance components [2], to
methods which restrict the variance of response to selec-
tion [3], and can be used to explore trends in Mendelian
sampling deviations over time [4]. The mixed model
equations (MME) for most national genetic evaluations
range from 100,000 to 20,000,000 equations and inver-
sion of systems of equations of this size is generally not
possible because of their magnitude or because of loss of
Published: 9 February 2009
Genetics Selection Evolution 2009, 41:23 doi:10.1186/1297-9686-41-23
Received: 17 December 2008
Accepted: 9 February 2009
This article is available from: />© 2009 Hickey et al; licensee BioMed Central Ltd.
This is an Open Access article distributed under the terms of the Creative Commons Attribution License ( />),
which permits unrestricted use, distribution, and reproduction in any medium, provided the original work is properly cited.
ˆ
u
Genetics Selection Evolution 2009, 41:23 />Page 2 of 9
(page number not for citation purposes)
numerical precision [5]. Methods that approximate the
prediction error variances (PEV) and calculate the accu-
racy of provide biased estimates in some circumstances
by ignoring certain information [e.g. [6]]. Variance com-
ponents upon which genetic evaluations of large popula-
tions are based are generally estimated using reduced data
sets. The use of reduced data sets may create bias in the
estimates as REML only provides unbiased estimates of
variance components when all the data on which selec-
tion has taken place is included in the analysis [7]. Vari-
ance of response to selection is generally not controlled in
breeding programs although it might be a risk to them [3].
Approximations of the PEV without needing to invert the
coefficient matrix or to delete data, can be obtained by
comparing Monte Carlo samples of the data and succes-
sive solutions of the mixed model equations of this data.
However different formulations have been presented to
approximate the PEV in this way [8-11]. Approximations
of the PEV using these formulations converge to the exact
PEV (PEV
exact
) as the number of Monte Carlo samples
increases, but the number of samples is generally limited
by computational requirements in practice [e.g. [12]].
Also, differences in the rates of convergence have been
shown to depend on the level of PEV
exact
for a given
genetic variance ( ) [10]. Consequently, when finding
the optimal number of iterations required, both the differ-
ent formulations, and the level of PEV
exact
need to be taken
into account. Some of the formulations are weighted aver-
ages of other formulations, with the weighting depending
on the sampling variances of these. Garcia-Cortes et al.
[10] use asymptotic approximations of these sampling
variances. Alternative weighting strategies could use
empirically approximated sampling variances based on
independent replicates of samples or using leave-one-out
Jackknife procedures [13,14].
The objective of this study was to compare the conver-
gence to PEV
exact
of ten different formulations of the PEV,
using simulations based on data and pedigree from a
commercial population containing animals with different
levels of PEV and using different numbers of samples (n =
50, 100, , 950, 1000). Four of the formulations were pre-
viously published, four were alternative versions of these,
and two were derived as part of this study.
Methods
Monte Carlo sampling procedure for calculating PEV
The Monte Carlo sampling procedure for calculating the
sampled PEV has been described extensively elsewhere for
single breed [8-10] and multiple breed scenarios [12].
Assuming a simple additive genetic animal model without
genetic groups y = Xb + Zu + e, where the distribution of
random variables is y ~ N(Xb, ZGZ' + R), u ~ N(0, G), and
e ~ N(0, R), the three steps involved in calculating the
sampled PEV are as follows: 1. Simulate n samples of y
and u using the pedigree and the distributions of the orig-
inal data, modified to account for the fact that the expec-
tation of Xb does not affect the distribution of random
variables [15,16] thus the samples of y can be simulated
using random normal deviates from N(0, ZGZ' + R)
instead of N(Xb, ZGZ' + R). 2. Set up and solve the mixed
model equations for the data set using the n simulated
samples of y instead of the true y. This accounts for the
fixed effects structure of the real data. 3. Calculate the
sampled PEV for some formulation.
Formulations of PEV
Ten formulations of the sampled PEV are shown in Table
1. The first three formulations (PEV
GC1
, PEV
GC2
, and
PEV
GC3
) were outlined by Garcia-Cortes et al. [10] and the
fourth formulation (PEV
FL
) was outlined by Fouilloux
and Laloë [8]. PEV
AF1
, PEV
AF2
, PEV
AF3
, and PEV
AF4
are
alternative versions of these formulations, which rescale
the formulations from the Var (u) and to the in order
to account for the effects of sampling on the Var(u). Two
new formulations of the sampled PEV (PEV
NF1
, and
PEV
NF2
) are also given in Table 1. The ten formulations
differ from each other in the way in which they compare
information relating to the Var(u), the Var( ), the Var (u
- ), or the Cov(u, ).
Approximation of sampling variance of PEV
Formulae, based on Taylor series approximations, to pre-
dict the asymptotic sampling variances for each of the ten
formulations of sampled PEV at different levels of PEV
exact
are given in Table 1. The sampling variance can also be
approximated stochastically using a number (e.g. 100) of
independent replicates of the n samples or by applying a
leave-one-out Jackknife [13,14] to the n samples.
Application to test data set
Data and model
A data set containing 32,128 purebred Limousin animals
with records for a trait (height) and a corresponding ped-
igree of 50,435 animals was extracted from the Irish Cattle
Breeding Federation database. In the simulations the trait
ˆ
u
σ
g
2
σ
g
2
ˆ
u
ˆ
u
ˆ
u
Genetics Selection Evolution 2009, 41:23 />Page 3 of 9
(page number not for citation purposes)
Table 1: Previously published, alternative, and new formulations of the prediction error variance for a random effect u with , the
assumptions pertinent to each formulation, the information used in each formulation, and the asymptotic sampling variances of each
formulation
Formulation Assumptions Uses information on Asymptotic sampling variance
1
PEV
GC1
= - Var( )
Cov(u, ) = Var( )
Var(u) =
2r
4
/n
2
PEV
GC2
= Var(u - )
11
Cov(u, ) ≠/= Var( )
Var(u) =
u -
2(1-r
2
)
2
/n
3
Cov(u - , ) = 0
Var(u) =
, u -
{[2r
4
(1-r
2
)
2
]/[(1-r
2
)
2
+ r
4
]} /n
4
PEV
FL
= - Cov(u, )
Cov(u, ) = Var( )
Var(u) =
Cov(u, )
r
2
(1+r
2
)/n
5
PEV
AF1
= - [Var( )/Var(u)]
Cov(u, ) = Var( )
Var(u) ≠
, u
4r
4
(1-r
2
)/n
6
PEV
AF2
= [Var(u - )/Var(u)]
11
Cov(u, ) ≠/= Var( )
Var(u) ≠
u - , u
4r
2
(1-r
2
)
2
/n
7
Cov(u - , ) = 0
Var(u) ≠
, u - , u
4r
4
(1 - r
2
)
2
/n
8
PEV
AF4
= - [Cov(u, )/Var(u)]
Cov(u, ) = Var( )
Var(u) ≠
Cov(u, ), u
r
2
(1-r
2
)/n
9
PEV
NF1
= [1 - Cov(u, )
2
/(Var(u) × Var( ))] 4r
2
(1-r
2
)
2
/n
10
PEV
NF2
= {Var(u - )/[Var( ) + Var(u - ]}
Cov(u - , ) = 0 and u -
4r
4
(1-r
2
)
2
/n
1
Garcia-Cortes et al. (1995) formulation 1
2
Garcia-Cortes et al. (1995) formulation 2
3
Garcia-Cortes et al. (1995) formulation 3
4
Fouilloux and Laloë (2001) formulation
5
Corrects PEV
GC1
for Var(u) ≠ and corresponds to Lidauer et al. (2007)
6
Corrects PEV
GC2
for Var(u) ≠
7
Corrects PEV
GC3
for Var(u) ≠
8
Corrects PEV
FL
for Var(u) ≠
9
Based on the classical formulation of the accuracy of an EBV
10
Implicitly weighs information on Var ( ) and Var(u, ) and corrects for Var(u) ≠
11
No assumption made about the relationship between Var( )and Cov(u, )
σ
g
2
σ
g
2
ˆ
u
ˆ
u
ˆ
u
σ
g
2
ˆ
u
σ
g
4
ˆ
u
ˆ
u
ˆ
u
σ
g
2
ˆ
u
σ
g
4
PEV
GC3
PEV
GC1
Var(PEV
GC1
)
PEV
GC2
Var(PEV
GC2
)
1
Var
=
⎡
⎣
⎢
⎤
⎦
⎥
+
⎡
⎣
⎢
⎤
⎦
⎥
((PEV
GC1
)
1
Var(PEV
GC2
)
+
ˆ
u
ˆ
u
σ
g
2
ˆ
u
ˆ
u
σ
g
4
σ
g
2
ˆ
u
ˆ
u
ˆ
u
σ
g
2
ˆ
u
σ
g
2
σ
g
2
ˆ
u
σ
g
2
ˆ
u
ˆ
u
σ
g
2
ˆ
u
σ
g
4
ˆ
u
σ
g
2
ˆ
u
ˆ
u
σ
g
2
ˆ
u
σ
g
4
PEV
AF3
PEV
AF1
Var(PEV
AF1
)
PEV
AF2
Var(PEV
AF2
)
1
Var
=
⎡
⎣
⎢
⎤
⎦
⎥
+
⎡
⎣
⎢
⎤
⎦
⎥
((PEV
AF1
)
1
Var(PEV
AF2
)
+
ˆ
u
ˆ
u
σ
g
2
ˆ
u
ˆ
u
σ
g
4
σ
g
2
ˆ
u
σ
g
2
ˆ
u
ˆ
u
σ
g
2
ˆ
u
σ
g
2
ˆ
u
ˆ
u
σ
g
2
σ
g
2
ˆ
u
ˆ
u
ˆ
u
σ
g
2
ˆ
u
ˆ
u
ˆ
u
ˆ
u
σ
g
4
σ
g
2
σ
g
2
σ
g
2
σ
g
2
ˆ
u
ˆ
u
σ
g
2
ˆ
u
ˆ
u
Genetics Selection Evolution 2009, 41:23 />Page 4 of 9
(page number not for citation purposes)
was assumed to have a of 1.0 and residual variance
of 3.0. Fixed effects were contemporary group, techni-
cian who scored the animal, parity of dam, age of animal
at scoring and sex.
Calculation of exact PEV
The PEV
exact
were calculated for the extracted data set by
setting up and solving the MME, with fixed effects of con-
temporary group, technician who scored the animal, par-
ity of dam, and a second order polynomial of age of
animal at scoring nested within sex, and random animal
and residual effects, using the BLUP option in ASReml
[17] which fully inverts the left hand side of the MME.
Sampled PEV
Following the Monte Carlo sampling procedure described
above, 100,000 samples of the extracted data set were sim-
ulated assuming a of 1.0 and of 3.0. For each of
the simulated data sets MME, using the same design
matrix (X) as used when estimating the PEV
exact
, were set
up and solved using MiX99 [18]. The sampled PEV of the
for each animal in the pedigree was approximated
using the formulations of the sampled PEV described in
Table 1 using n samples (n = 50, 100, , 950, 1000).
Stochastic approximations of the sampling variance of the
sampled PEV were calculated using 100 independent rep-
licates of the n samples, and using the leave-one-out Jack-
knife on n samples, for the different formulations, with
the exception of PEV
GC3
and PEV
AF3
. To calculate the sam-
pling variance for PEV
GC3
and PEV
AF3
using n independent
replicates would have required more than 100,000 sam-
ples (due to the need to generate sampling variances of
component formulations) generated for this study so
therefore these were not considered. Asymptotic sampling
variances for all ten formulations were calculated using
the formulae in Table 1.
Alternative weighting strategies
Of the formulations presented in Table 1, PEV
GC3
and
PEV
AF3
are weighted averages of PEV
GC1
and PEV
GC2
and of
PEV
AF1
and PEV
AF2
respectively with the weighting
dependent on the sampling variances of the component
formulations. Garcia-Cortes et al. [10] suggest weighting
by asymptotic approximations of the sampling variances.
The sampling variances could also be approximated
empirically using independent replicates of n samples or
by leave-one-out Jackknife procedures [13,14]. These
alternative weighting strategies were compared by calcu-
lating sampling variances using 100 independent repli-
cates of the n samples, using the n samples and a leave-
one-out Jackknife procedure [14], and using the asymp-
totic sampling variances outlined in Table 1 as part of an
iterative procedure, which involved two iterations. In the
first iterations the asymptotic sampling variances were cal-
culated using the PEV
GC1
and PEV
GC2
of the component
formulations, in the second they used the PEV
GC3
approx-
imated in the first iteration.
Calculation of required variances and covariances
It was not possible to store each of the 100,000 simulated
values for each of the 50,435 animals in the main memory
of the computer simultaneously meaning that textbook
formulae to calculate the different variances and covari-
ances required for the different formulations was not pos-
sible. Textbook updating algorithms to calculate the
variance can be numerically unreliable [19]. Instead the
required variances were calculated using a one pass updat-
ing algorithm based on Chan et al. [19] which updates the
estimated sum of squares with a new record as it reads
through the data and takes the form:
where n are the number samples at any stage in the updat-
ing procedure and T and S are the sum and sum of squares
of the data points 1 through n. It was modified to calculate
the covariances between X and Y by changing
to
. Both of these
algorithms were tested using one replication of 100,000
samples and found to be stable.
Results
As the was taken to be 1.0, the PEV ranged between
0.00 and 1.0. For the purpose of categorizing the results
PEV with values between 0.00 and 0.33 were regarded as
low, values between 0.34 and 0.66 were regarded as
medium, and values between 0.67 and 1.00 were regarded
as high.
Henderson [20] showed that it is much easier to form A
-1
than A, where A is the numerator relationship matrix
among animals. This follows from the fact that, if the indi-
viduals are listed with ancestors above descendants, A can
be written as TMT' where M is a diagonal matrix and T is
a lower triangular matrix with non-zero diagonal ele-
σ
g
2
σ
r
2
σ
g
2
σ
r
2
ˆ
u
SS n
T
n
n
x
i
n
nn
=+−
()
−
−
⎛
⎝
⎜
⎞
⎠
⎟
−
⎡
⎣
⎢
⎤
⎦
⎥
⎛
⎝
⎜
⎜
⎜
⎜
⎜
⎞
⎠
⎟
⎟
⎟
⎟
⎟
⎛
⎝
⎜
⎜
⎜
⎜
⎜
−1
1
1
1
2
⎞⎞
⎠
⎟
⎟
⎟
⎟
⎟
,
T
n
n
x
i
−
−
()
−
⎡
⎣
⎢
⎤
⎦
⎥
1
1
2
T
x
n
n
T
y
n
n
xy
ii
−
−
−
−
()
−
⎡
⎣
⎢
⎤
⎦
⎥
×
()
−
⎡
⎣
⎢
⎤
⎦
⎥
1
1
1
1
σ
g
2
Genetics Selection Evolution 2009, 41:23 />Page 5 of 9
(page number not for citation purposes)
ments and i, j th elements that are non-zero if the j th indi-
vidual is an ancestor of the i th [21]. The matrix T has a
simple inverse with both the diagonal elements and i, j th
elements being non-zero if the j th individual is a parent
of the i th individual. Hence A has a simple inverse. It is
interesting to note that an animal effect can be written as
an accumulation of independent terms from its ancestors
, where u
si
and u
di
are the additive
genetic effects of the sire and dam of animal i and m
i
is the
Mendelian sampling effect with variance
, where F
i
is the average inbreeding of the
parents of animal i. Hence there is a simple recursive pro-
cedure for generation of the additive effects u
i
by generat-
ing independent Mendelian sampling terms m
i
with
diagonal variance matrix .
General trends of sampled PEV
While all different formulations of the sampled PEV con-
verged to the PEV
exact
and the sampling variance of the
PEV reduced as the number of samples (n) increased, con-
vergence rates differed between the formulations. For
example, PEV
GC2
converged at a slower rate than all other
formulations when the convergence rate was measured by
the correlation between PEV
exact
and sampled PEV (Fig. 1).
PEV
GC1
, PEV
AF3
, PEV
AF4
, and PEV
NF2
, all converged at a
very similar rates and had the best convergence across all
formulations.
As well as depending on the numbers of samples, the con-
vergence rate also depended on the level of the PEV
exact
.
The sampled PEV calculated using different formulations
had different sampling variances and within each formu-
lation the sampling variances differed depending on the
level of the PEV
exact
(Fig. 2). Of the previously published
formulations PEV
GC1
and PEV
FL
had low sampling vari-
ance at high PEV
exact
, with PEV
GC1
being better than PEV
FL
.
PEV
GC2
had low sampling variance at low PEV
exact
.
Accounting for the effects of sampling on the Var(u)
reduced the sampling variance in regions where the previ-
ously published formulations had high sampling vari-
ances but had little (or even slightly negative) effect where
these formulations had low sampling variances. PEV
AF4
,
which is the alternative version of PEV
FL
gave major
improvements in terms of sampling variance low and
intermediate PEV
exact
. Its performance was almost identi-
cal to PEV
NF2
, PEV
AF3
, and PEV
GC3
, which had low sam-
um
ii
u
si
u
di
=+
+
()
2
A
mg
i
F
i
=
−
()
1
2
2
σ
A
m
i
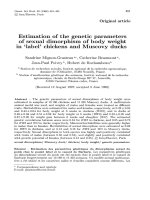
Correlations between exact prediction error variance and different formulations of sampled prediction error variance
1
using n samples (n = 50, 100, , 950, 1000), for 18,855 non-inbred animalsFigure 1
Correlations between exact prediction error variance and different formulations of sampled prediction error
variance
1
using n samples (n = 50, 100, , 950, 1000), for 18,855 non-inbred animals.
1
PEV
NF2
, PEV
AF3
, PEV
AF4
are
not shown as they have trends, which match PEV
GC3
0.75
0.8
0.85
0.9
0.95
1
0 200 400 600 800 1000
Number of samples
Correlation
GC1
GC2
GC3
AF1
AF2
FL
NF1
Genetics Selection Evolution 2009, 41:23 />Page 6 of 9
(page number not for citation purposes)
pling variance at both high and low PEV. No formulation
had relatively low sampling variance for intermediate
PEV.
Comparison of formulations
Different formulations were compared in greater detail
using n = 300 samples (Table 2), which is a practical
number of samples. PEV
GC3
, PEV
AF3
, PEV
AF4
, and PEV
NF2
were the best formulations across all of the ten formula-
tions. The slopes and R
2
of their regressions were always
among the best where PEV
exact
was low, intermediate, or
high (Table 2). These formulations gave good approxima-
tions at both high and low PEV
exact
their performance was
less good at intermediate PEV, measured by each of the
summary statistics (Table 2).
PEV
GC1
and PEV
FL
gave good approximations for high
PEV
exact
and poor approximations for low PEV
exact
. PEV
GC2
gave good approximations for low PEV
exact
and poor
approximations for high PEV
exact
. Improving the pub-
lished formulations by correcting for the effects of sam-
pling resulted in better approximations in areas where the
published formulations were weak. Slight (dis)improve-
ments were observed where the previously published for-
mulations were strong. Of the new formulations PEV
NF1
gave poor approximations and PEV
NF2
gave good approx-
imations.
Using the three alternative weighting strategies to com-
bine the component formulations for PEV
GC3
and PEV
AF3
gave almost identical results (Table 3).
Required number of samples
The formulations PEV
GC3
, PEV
AF3
, PEV
AF4
, and PEV
NF2
gave similar approximations and had the lowest sampling
variance. Even when a few samples (n = 50) were used,
Sampling variances of sampled prediction error variance approximated asymptotically (As) and empirically
1
(Em) using different formulations of the prediction error variance using 300 samples for different levels of exact prediction error varianceFigure 2
Sampling variances of sampled prediction error variance approximated asymptotically (As) and empirically
1
(Em) using different formulations of the prediction error variance using 300 samples for different levels of
exact prediction error variance. (A) Sampling variances for PEV
GC1
and PEV
GC2
. (B) Sampling variances for PEV
AF1
and
PEV
AF2
. (C) Sampling variances for PEV
FL
and PEV
AF4
. (D) Sampling variances for PEV
NF1
and PEV
NF2
2
.
1
Empirical sampling vari-
ances were approximated using 100 independent replicates and presented as averages within windows of 0.001 of the exact
prediction error variance.
2
PEV
GC3
, and PEV
AF3
were similar to PEV
NF2
.
A
0.000
0.001
0.002
0.003
0.004
0.005
0.006
0.007
0.00 0.20 0.40 0.60 0.80 1.00
PEV Exact
Sampling variance
GC1 As
GC2 As
GC1 Em
GC2 Em
B
0.000
0.001
0.002
0.003
0.004
0.005
0.006
0.007
0.00 0.20 0.40 0.60 0.80 1.00
PEV Exact
Sampling variance
AF1 As
AF2 As
AF1 Em
AF2 Em
C
0.000
0.001
0.002
0.003
0.004
0.005
0.006
0.007
0.00 0.20 0.40 0.60 0.80 1.00
PEV Exact
Sampling variance
FL As
AF4 As
FL Em
AF4 Em
D
0.000
0.001
0.002
0.003
0.004
0.005
0.006
0.007
0.00 0.20 0.40 0.60 0.80 1.00
PEV Exact
Sampling variance
NF1 As
NF2 As
Genetics Selection Evolution 2009, 41:23 />Page 7 of 9
(page number not for citation purposes)
low and high PEV were well approximated and intermedi-
ate PEV
exact
were poorly approximated. Correlations
between PEV
NF2
and PEV
exact
were 0.88 for low, 0.96 for
high PEV
exact
and 0.51 for intermediate PEV
exact
. To
increase the correlation for intermediate PEV
exact
to at least
0.90 at least 550 samples was needed. At this number of
samples the correlations for low and high PEV
exact
were ≥
0.99. To obtain a satisfactory level of convergence 300
samples were sufficient.
Discussion
Differences between formulations
Ten different formulations of the PEV approximated using
sampling were compared and these were each shown to
converge to the PEV
exact
at different rates. Within each of
these formulations differences in convergence were
observed at different levels of PEV
exact
. PEV
GC1
and its cor-
responding alternative formulation PEV
AF1
make use of
information on the Var( ). PEV
GC2
and its corresponding
alternative formulation PEV
AF2
makes use of information
on the Var(u - ). The sampling variance of the Var( ) is
lower at high PEV
exact
than it is at low PEV
exact
(Fig. 3),
therefore the formulations using information on the
Var( ) are more suited to approximating high PEV
exact
than to low PEV
exact
. The opposite is the case for formula-
tions which use information on the Var(u - ), they per-
form better at low PEV
exact
. Formulations PEV
GC3
, PEV
AF3
,
and PEV
NF2
use information on both the Var( )and the
Var (u - ) and result in curves for their sampling vari-
ance which are symmetric about the mean PEV
exact
. They
either explicitly or implicitly weight this information by
the inverse of its sampling variance. PEV
FL
and PEV
AF4
make use of information on the Cov(u, ).
With infinite samples the Var(u) is equal to the , but
due to sampling error resulting from using a limited
number of samples this not likely to be true in practice.
Therefore each of the alternative formulations makes use
of information on the Var(u) in addition to making use of
information on either/or/both of the Var( ) and the
Var(u - ) or the Cov(u, ). The Var( ) = Cov(u, )
when the Cov((u - ), ) = 0. The Var( ) ≠ Cov(u, )
when the Cov((u - ), ) ≠ 0.
Competitive formulations
Of the ten different approaches four competitive formula-
tions, PEV
GC3
, PEV
AF3
, PEV
AF4
, and PEV
NF2
, were identi-
ˆ
u
ˆ
u
ˆ
u
ˆ
u
ˆ
u
ˆ
u
ˆ
u
ˆ
u
σ
g
2
ˆ
u
ˆ
u
ˆ
u
ˆ
u
ˆ
u
ˆ
u
ˆ
u
ˆ
u
ˆ
u
ˆ
u
ˆ
u
Table 2: Intercept, slope, R
2
, and root mean squared error (RMSE) of regressions of exact prediction error variance on sampled
prediction error variance approximated using one of 10 different formulations of the prediction error variance using 300 samples, for
18,855 non-inbred animals
PEV
exact
PEV
GC1
PEV
GC2
PEV
GC3
PEV
FL
PEV
AF1
PEV
AF2
PEV
AF3
PEV
AF4
PEV
NF1
PEV
NF2
Intercept 0.00–0.33 0.09 0.01 0.01 0.09 0.05 0.02 0.01 0.02 0.01 0.01
0.34–0.66 0.26 0.32 0.17 0.31 0.27 0.30 0.18 0.18 0.29 0.17
0.67–1.00 0.09 0.29 0.06 0.05 0.09 0.06 0.02 0.02 0.04 0.04
Slope
0.00–0.33 0.62 0.90 0.93 0.62 0.77 0.89 0.93 0.93 0.91 0.95
0.34–0.66 0.57 0.43 0.71 0.47 0.54 0.48 0.68 0.69 0.49 0.71
0.67–1.00 0.91 0.67 0.94 0.95 0.91 0.93 0.98 0.97 0.96 0.96
R
2
0.00–0.33 0.65 0.94 0.95 0.65 0.76 0.91 0.95 0.94 0.93 0.95
0.34–0.66 0.59 0.43 0.68 0.49 0.54 0.48 0.67 0.69 0.49 0.70
0.67–1.00 0.96 0.64 0.97 0.97 0.95 0.90 0.98 0.98 0.92 0.98
RMSE 0.00–0.33 0.05 0.02 0.02 0.05 0.04 0.03 0.02 0.02 0.02 0.02
0.34–0.66 0.03 0.03 0.02 0.03 0.03 0.03 0.02 0.02 0.03 0.02
0.67–1.00 0.02 0.06 0.02 0.02 0.02 0.03 0.01 0.02 0.03 0.01
Table 3: Coefficients of regressions of PEV
GC3
and PEV
AF3
(sampling variances calculated empirically) on PEV
GC3
and
PEV
AF3
(sampling variances calculated using Jackknife) and on
PEV
GC3
and PEV
AF3
(sampling variances calculated
asymptotically and weighting done iteratively)
Jackknife Asymptotic
PEV
GC3
PEV
AF3
PEV
GC3
PEV
AF3
Intercept 0.00 0.00 0.00 0.01
Slope 1.00 1.00 1.00 1.00
R
2
1.00 1.00 1.00 1.00
RMSE 0.01 0.00 0.00 0.01
Genetics Selection Evolution 2009, 41:23 />Page 8 of 9
(page number not for citation purposes)
fied. These gave similar approximations. Of the four, two,
PEV
GC3
and PEV
AF3
, were weighted averages of component
formulations. The weighting was based on the sampling
variances of their component formulations. These sam-
pling variances can be calculated using a number of inde-
pendent replicates, using Jackknife procedures, or
asymptotically. Each of these approaches gave almost
identical results but the Jackknife and asymptotic
approaches were far less computationally demanding.
Computational time
A single BLUP evaluation for the routine Irish multiple
breed beef genetic cattle evaluation (January 2007) which
included a pedigree of 1,500,000 and 493,092 animals
with performance records on at least one of the 15 traits
could be run using MiX99 [18] in 366 min on a 64 bit PC,
with a 2.40 GHz AMD Opteron dual-core processor and 8
gigabytes of RAM [12]. Using n = 300 samples and PEV
NF2
the accuracy of the estimated breeding values could be
estimated in 1,830 hours on a single processor. Several
samples can be solved simultaneously on multiple proc-
essors thereby reducing computer time. Nowadays PC's
are available that contain two quad core 64 bit processors
(i.e. 8 CPU's) and cost approximately 5,000 euro. Using
six of these PC's the accuracy of estimated breeding values
for the Irish data set could be estimated in less than 38.1
h.
Application
The Monte Carlo sampling approach using one of these
four competitive formulations can be used to improve
many tasks in animal breeding. Stochastic REML algo-
rithms [e.g. [9]] can be improved in terms of speed of cal-
culation using these formulations, therefore allowing
variance components to be estimated using REML in large
data sets. These REML formulations are usually written in
terms of additive genetic effects u'A
-1
u and trace [A
-1
PEV],
where PEV is the prediction error covariance matrix for
the estimated breeding values. The results of Henderson
[22] show how the REML formulations can be equiva-
lently written as in terms of Mendelian sampling effects m
m'A
-1
m and trace [A
m
-1
PEV
m
], where PEV
m
is the predic-
tion error covariance matrix for the Mendelian sampling
effects. As A
m
is diagonal we see that we only need to com-
pute the sampling variances of the Mendelian sampling
terms. When the sampling was carried out in this study
we, in error, did not correct the Mendelian sampling terms
for inbreeding. We therefore have only reported results for
non-inbred animals and think that the incorrect genera-
tion will have a minimal effect on the sampling variances,
which are presented as an empirical check on the formu-
lae. There may be circumstances where a Stochastic REML
approach may be faster than Gibbs sampling and have
less bias than Method R [23]. Calculating variance com-
ponents using more complete data sets would facilitate a
reduction in the bias of estimated variance components
caused by the ignoring of data on which selection has
taken place in the population [12], due to computational
limitations. Calculation of unbiased accuracy of within
breed [8] and across breed [12] estimated breeding values
can be improved by reducing the computational time
required of calculation or reducing the sampling error for
a given computational time. Application of an algorithm
controlling the variance of response to selection [24] to
large data sets can be speeded up. The variance of response
to selection is a risk to breeding programs [3], which is
generally not explicitly controlled using the approach out-
lined by Meuwissen [24] due to the inability to generate a
prediction error (co)variance matrix for large data sets.
Computational power is a major limitation of stochastic
methods, particularly when large data sets are involved,
however this is dissipating rapidly with the improvement
in processor speed, parallelization, and the adoption of
64-bit technology, however in the meantime determinis-
tic methods will continue to be used for large scale BLUP
analysis.
Conclusion
PEV approximations using Monte Carlo estimation were
affected by the formulation used to calculate the PEV. The
difference between the formulations was small when the
number of samples increased, but differed depending on
the level of the exact PEV and the number of samples. Res-
caling from the scale of Var(u) to the scale of
improved the approximation of the PEV and four of the
10 formulations gave the best approximations of PEV
exact
thereby improving the efficiency of the Monte Carlo sam-
pling procedure for calculating the PEV. The fewer sam-
σ
g
2
X-Y plot of the exact prediction error variance and the
Var( ) and Var(u - )
Figure 3
X-Y plot of the exact prediction error variance and
the Var( ) and Var(u - ).
ˆ
u
ˆ
u
ˆ
u
ˆ
u
Publish with Bio Med Central and every
scientist can read your work free of charge
"BioMed Central will be the most significant development for
disseminating the results of biomedical research in our lifetime."
Sir Paul Nurse, Cancer Research UK
Your research papers will be:
available free of charge to the entire biomedical community
peer reviewed and published immediately upon acceptance
cited in PubMed and archived on PubMed Central
yours — you keep the copyright
Submit your manuscript here:
/>BioMedcentral
Genetics Selection Evolution 2009, 41:23 />Page 9 of 9
(page number not for citation purposes)
ples that are required the less the computational time will
be.
Competing interests
The authors declare that they have no competing interests.
Authors' contributions
RT derived most of the mathematical equations. JH
derived the remaining equations, carried out the simula-
tions and wrote the first draft of the paper. RV supervised
the research and mentored JH. MC and HM took part in
useful discussions and advised on the simulations. All
authors read and approved the final manuscript.
Acknowledgements
The authors acknowledge the Irish Cattle Breeding Federation for provid-
ing funding and data. Robin Thompson acknowledges the support of the
Lawes Agricultural Trust.
References
1. Henderson CR: Best linear unbiased estimation and prediction
under a selection model. Biometrics 1975, 31:423-447.
2. Patterson HD, Thompson R: Recovery of inter-block informa-
tion when block sizes are unequal. Biometrika 1971, 58:545-554.
3. Meuwissen THE, Woolliams JA: Maximizing genetic response in
breeding schemes of dairy cattle with constraints on vari-
ance of response. J Dairy Sci 1994, 77:1905-1916.
4. Lidauer M, Vuori K, Stranden I, Mantysaari E: Experiences with
Interbull Test IV: Estimation of genetic variance. Proceedings
of the Interbull Annual Meeting: Dublin, Ireland 2007, 37:69-72.
5. Harris B, Johnson D: Approximate reliability of genetic evalua-
tions under an animal model. J Dairy Sci 1998, 81:2723-2728.9.
6. Tier B, Meyer K: Approximating prediction error covariances
among additive genetic effects within animals in multiple-
trait and random regression models. J Anim Breed Genet 2004,
121:77-89.
7. Jensen J, Mao IL: Transformation algorithms in analysis of sin-
gle trait and of multitrait models with equal design matrices
and one random factor per trait: a review. J Anim Sci 1988,
66:2750-2761.
8. Fouilloux MN, Laloë D: A sampling method for estimating the
accuracy of predicted breeding values in genetic evaluation.
Genet Sel Evol 2001, 33:473-486.
9. Garcia-Cortes LA, Moreno C, Varona L, Altarriba J: Variance com-
ponent estimation by resampling. J Anim Breed Genet 1992,
109:358-363.
10. Garcia-Cortes LA, Moreno C, Varona L, Altarriba J: Estimation of
prediction error variances by resampling. J Anim Breed Genet
1995, 112:176-182.
11. Thompson R: Integrating best linear unbiased prediction and
maximum likelihood estimation. Proceedings of the 5th World
Congress on Genetics Applied to Livestock Production: Guelph, Canada
1994, 18:337-340.
12. Hickey JM, Keane MG, Kenny DA, Cromie AR, Mulder HA, Veerkamp
RF: Estimation of accuracy and bias in genetic evaluations
with genetic groups using sampling. J Anim Sci 2008,
86:1047-1056.
13. Efron B: Bootstrap methods: another look at the jackknife.
Ann Stat 1979, 7:1-26.
14. Tukey J: Bias and confidence in not quite large samples. Ann
Math Statist 1958, 29:614.
15. Klassen DJ, Smith SP: Animal model estimation using simulated
REML. Proceedings of the 4th World Congress on Genetics Applied to
Livestock Production: Edinburgh 1990, 12:472-475.
16. Thallman RM, Taylor JF: An indirect method of computing
REML estimates of variance components from large data
sets using an animal model. J Dairy Sci 1991, 74(Suppl 1):160.
17. Gilmour AR, Cullis BR, Welham SJ, Thompson R: ASReml User
Guide (Release 2). VSN International, Hemel Hempstead, HP1
1ES, UK; 2006.
18. Lidauer M, Stranden I, Vuori K, Mantysaari E: MiX99 User Manual
MTT, Jokioinen, Finland; 2006.
19. Chan TF, Golub GH, LeVeque RJ: Algorithms for computing the
sample variance: analysis and recommendations. Am Stat
1983, 37:242-247.
20. Henderson CR: A simple method for computing the inverse of
a numerator relationship matrix used in prediction of breed-
ing values. Biometrics 1976, 32:69.
21. Thompson R: Sire evaluation. Biometrics 1979, 35:339-353.
22. Henderson CR: Applications of Linear Models in Animal Breeding Guelph,
Ontario, Canada, University of Guelph; 1984.
23. Reverter A, Golden BL, Bourdon RM, Brinks JS: Method R variance
components procedure: application on the simple breeding
value model. J Anim Sci 1994, 72:2247-2253.
24. Meuwissen TH: Maximizing the response of selection with a
predefined rate of inbreeding. J Anim Sci 1997, 75:934-940.