Báo cáo sinh học: " Precision of genetic parameters and breeding values estimated in marker assisted BLUP genetic evaluation" potx
Bạn đang xem bản rút gọn của tài liệu. Xem và tải ngay bản đầy đủ của tài liệu tại đây (294.87 KB, 10 trang )
BioMed Central
Page 1 of 10
(page number not for citation purposes)
Genetics Selection Evolution
Open Access
Research
Precision of genetic parameters and breeding values estimated in
marker assisted BLUP genetic evaluation
Stefan Neuner*
1
, Christian Edel
1
, Reiner Emmerling
1
, Georg Thaller
2
and
Kay-Uwe Götz
1
Address:
1
Bavarian State Research Center for Agriculture, Institute of Animal Breeding, D-85580 Grub, Germany and
2
Christian-Albrechts-
University, Institute of Animal Breeding and Husbandry, D-24098 Kiel, Germany
Email: Stefan Neuner* - ; Christian Edel - ;
Reiner Emmerling - ; Georg Thaller - ; Kay-Uwe Götz - Kay-
* Corresponding author
Abstract
In practical implementations of marker-assisted selection economic and logistic restrictions
frequently lead to incomplete genotypic data for the animals of interest. This may result in bias and
larger standard errors of the estimated parameters and, as a consequence, reduce the benefits of
applying marker-assisted selection. Our study examines the impact of the following factors:
phenotypic information, depth of pedigree, and missing genotypes in the application of marker-
assisted selection. Stochastic simulations were conducted to generate a typical dairy cattle
population. Genetic parameters and breeding values were estimated using a two-step approach.
First, pre-corrected phenotypes (daughter yield deviations (DYD) for bulls, yield deviations (YD)
for cows) were calculated in polygenic animal models for the entire population. These estimated
phenotypes were then used in marker assisted BLUP (MA-BLUP) evaluations where only the
genotyped animals and their close relatives were included.
Models using YD of cows (bull dams) in addition to DYD of bulls resulted in much smaller standard
errors for the estimated variance components. The bias in DYD models was larger than in models
including YD. Depth of pedigree had the strongest impact on the standard errors of all the
estimated variance components. As expected, estimation of variance components was less precise
with larger proportions of animals without genotypes in the pedigree. Accuracies of MA-BLUP
breeding values for young bull candidates were strongly affected by the inclusion of cow
information, but only marginally influenced by pedigree depth and proportions of genotyped
animals.
Background
Advances in molecular genetics have led to the identifica-
tion of several genes and of genetic markers linked or
associated with genes that affect traits of interest in live-
stock (QTL). Once QTL are detected, the aim of animal
breeders is to integrate linked markers for QTL into the
breeding program, in so-called marker assisted selection
schemes (MAS). An overview about different possibilities
to apply marker- and gene-assisted selection is given by
Dekkers [1]. While the highest benefits are expected from
Published: 4 March 2009
Genetics Selection Evolution 2009, 41:26 doi:10.1186/1297-9686-41-26
Received: 24 February 2009
Accepted: 4 March 2009
This article is available from: />© 2009 Neuner et al; licensee BioMed Central Ltd.
This is an Open Access article distributed under the terms of the Creative Commons Attribution License ( />),
which permits unrestricted use, distribution, and reproduction in any medium, provided the original work is properly cited.
Genetics Selection Evolution 2009, 41:26 />Page 2 of 10
(page number not for citation purposes)
gene-assisted selection using direct markers [1], in many
cases, practical applications of MAS have to rely on anon-
ymous markers that are often assumed to be in popula-
tion-wide linkage equilibrium with the QTL.
The statistical model for using marker information in
BLUP (best linear unbiased prediction) (MA-BLUP)
genetic evaluations was developed by Fernando and
Grossman [2]. The MA-BLUP methodology allows the
simultaneous estimation of QTL and polygenic effects.
The QTL effect is accounted for in the mixed model as an
extra random effect with the covariance structure propor-
tional to the IBD (identity by descent) matrix at the QTL
position given the linked markers [2].
Components of an integrated system to apply MAS for
routine evaluations are given by Dekkers [1]. In nearly all
implementations, it will be necessary to take three deci-
sions: i) how many animals are to be included in the MA-
BLUP model, ii) which phenotypes should be used, and
iii) how much effort is justified in order to completely
genotype ancestors of the current young bull generation.
The aim of our study is to examine these three questions
with respect to bias and standard errors of estimated vari-
ance components and accuracies of MA-BLUP breeding
values by means of simulation.
Methods
A stochastic simulation model was applied to generate a
data set that was then analyzed with five different models.
Each simulation cycle consisted of two phases: data gener-
ation and analysis of the simulated data sets. The number
of replicates for each variant was 100.
Data generation
In the simulation, data was generated for a conventional
dairy cattle breeding scheme on a small scale. The general
procedure is described in detail by Neuner et al. [3].
Parameters of the simulated population and base param-
eters of the progeny-testing program are shown in Table 1.
The time horizon for data generation was 34 years in the
current study.
A single-trait model for 305-day milk yield with a herita-
bility of 0.36 and an additive genetic variance of 260,100
kg
2
was chosen. Genetic parameters were in agreement
with the actual first lactation parameters of German Fleck-
vieh [4]. The overall breeding value of each animal was
the sum of a 'residual polygenic breeding value' and a
'QTL breeding value'. A single biallelic QTL with an allele
frequency of 0.5 was assumed and the QTL was bracketed
by two marker loci located 3 cM and 2 cM apart, each with
10 alleles but different allelic distributions. Allele frequen-
cies for the marker 3 cM apart from the QTL were 40, 19,
15, 12, 7, 2, 2, 1, 1 and 1% (polymorphic information
content, PIC = 0.732), and for the marker 2 cM apart were
60, 20, 8, 4, 2, 2, 1, 1, 1 and 1% (PIC = 0.555), respec-
tively. The Haldane mapping function [5] was assumed to
simulate meiosis. The multipoint polymorphism content
[6] for the simulated QTL position was 0.753.
All calculations assumed a QTL accounting for 20% of the
overall additive genetic variance of the trait investigated,
without dominance effects at the QTL.
Analysis of simulated data sets
In routine genetic evaluations of dairy cattle all pedigreed
animals are included. However, when applying MAS, only
a small fraction of animals might be genotyped at genetic
markers. Since only the genotyped animals provide infor-
mation for the estimation of QTL variance components
and breeding values in MA-BLUP models, the 'two-step
approach' as described by Liu et al. [7], Druet et al. [8] and
Bennewitz et al. [9] was used in this study.
MA-BLUP using a two-step approach
In the first step, a classical polygenic animal model (AM)
evaluation, assuming the true variance components are
known, was conducted for the entire population in order
to estimate daughter yield deviations (DYD) for bulls and
yield deviations (YD) for cows, respectively [10]. The ped-
igree contained about 260,000 animals of which 251,000
were cows with phenotypic records. To estimate AM-
based breeding values, DYD, and YD, the package MiX99
[11] was used.
Table 1: Simulated characteristics of the cow population and of
the breeding program
Cow population
Milking cows, nb 20,000
Cows in lactation, % %
Lactation 1 35
Lactation 2 27
Lactation 3 21
Lactation 4 17
Bull dams, nb 250
Age at first calving, months 24
Intergestation period, months 12
AI bull population
Age at birth of first progeny, months 24
Age at first breeding value estimation, months 60
Service life as proven bull, months 48
Maximum age, months 108
Bulls sampled, nb/year 72
Sires for insemination service per year, nb 10
Sires of bulls used per year, nb 4
Daughter records per bull sampled, nb 70
Genetics Selection Evolution 2009, 41:26 />Page 3 of 10
(page number not for citation purposes)
The second evaluation step was applied only to a subset of
genotyped animals from the population (MA-BLUP pedi-
gree). Usually the pedigree used for MA-BLUP evaluations
contains only young bull candidates, young bulls cur-
rently used, waiting bulls and their parents and one or
more generations of ancestors. For the current study it was
assumed that complete marker information was theoreti-
cally available for all animals in the MA-BLUP pedigree.
Phenotypic observations in step 2 were either DYD of
bulls alone, or DYD together with YD of cows. The differ-
ent amount of information available for DYD was
accounted for by applying weighting factors to DYD. YD
were not weighted, because each cow had only one record
in the current study (Druet 2006; personal communica-
tion) and fixed effects that may have an impact on the
accuracy of the estimation of YD, e.g. herd effects, were
not assumed. When using DYD and YD together in one
model for MA-BLUP evaluations, it is necessary to con-
sider that these two information types represent different
amounts of genetic and residual variance. Neuner et al. [3]
have provided a detailed description of this issue. In order
to account for these differences weighting of information
was necessary. The weighting factors EDC (effective
daughter contributions, Fikse and Banos [12]) and [3]
were applied to twice the DYD in DYD-YD evaluations.
An MA-BLUP model equivalent to that of Fernando and
Grossman [2] was used for the estimation of MA-BLUP
breeding values:
y
i
=
+ u
i
+ v
i
+ e
i
(1)
where y
i
is the record (YD for dams and twice the DYD for
sires) of individual i, u
i
is the residual polygenic effect of
individual i, v
i
is the effect of QTL-genotype of individual
i and e
i
is the residual. QTL effects were included in the
evaluations in terms of the IBD (identical by descent)
matrix. In contrast to Fernando and Grossman [2], IBD
matrices applied to (1) are genotypic relationship matri-
ces at the QTL and not gametic relationship matrices.
According to (1) the total estimated breeding value (EBV)
in MA-BLUP models is the sum of the estimates of the
polygenic and the QTL effect obtained by solving the
mixed model equations:
Pedigree for MA-BLUP
Based on the complete pedigree used for AM evaluations
in step 1, two pedigrees were derived for MA-BLUP. The
difference between them was the depth of the pedigree.
The 'short pedigree' includes actual selection candidates
for progeny testing and young bulls progeny tested during
the last four years. In addition, all their parents and grand-
parents were included. Animals in the deep pedigree were
actual selection candidates for progeny testing and bulls
tested during the last eight years as well as parents and
grandparents of all these bulls. In total, the short pedigree
spanned three generations and contained 1,821 animals,
whereas the deep pedigree comprised four generations
with 2,671 animals. The main characteristics for these two
pedigrees are given in Table 2. Table 2 is based on the
observed numbers of animals during the simulation proc-
ess.
Schemes with missing genotypes
For random QTL models according to Fernando and
Grossman [2] an IBD matrix reflects the covariance struc-
ture of QTL gametic effects in the pedigree. George et al.
[13] have reported an extensive overview on algorithms to
calculate IBD matrices even for complex pedigrees and
incomplete marker information. They concluded that
simulation-based algorithms like the multiple-site segre-
gation sampler LOKI [14] are efficient tools to calculate
IBD matrices for complex pedigree structures.
To analyze the effect of missing genotypes, three IBD
matrices were calculated for each simulated data set and
pedigree size. The first IBD matrix was calculated for the
situation where all animals in the MA-BLUP pedigree were
genotyped at all markers. Another two IBD matrices were
built up for two different genotyping structures: moderate
and extensive gaps. To generate the data sets with missing
genotypes, realistic constraints were introduced. Old ani-
EBV u v
iii
=+
ˆˆ
(2)
Table 2: Main characteristics of the short and the deep pedigree and the related phenotypic data that are used for MA-BLUP
evaluations
Short pedigree Deep pedigree
Animals, nb 1,821 2,671
Bulls, nb 790 1,071
Cows, nb 1,031 1,600
Animals with records (DYD, YD) in the MA-BLUP pedigree, nb 1,461 2,311
Bulls with record (DYD) in the MA-BLUP pedigree, nb 430 711
Cows with record (YD) in the MA-BLUP pedigree, nb 1,031 1,600
Waiting bulls without records in the MA-BLUP pedigree, nb 144 144
Young bull candidates without records in the MA-BLUP pedigree, nb 216 216
Genetics Selection Evolution 2009, 41:26 />Page 4 of 10
(page number not for citation purposes)
mals at the top of the pedigree are more often not geno-
typed than animals at the bottom of the pedigree, and
missing genotypes occur more often for females than for
males. Hence, missing genotypes were generated depend-
ent on the position of an animal in the pedigree and its
sex. Simulated proportions of missing genotypes for the
two scenarios of incomplete genotyping are given in Table
3. Scenario 1 could be regarded as a situation that occurs
at the start of MA-BLUP in realistic breeding programs.
Genotypes are available for most bulls, but most of the
older females in the pedigree are not genotyped. Scenario
2 is an extreme situation, with only very sparse genotypic
information for the ancestors of current young bull candi-
dates and progeny tested bulls of the last four (eight)
years. Missing genotypes in scenario 2 depend on the
missing genotypes in scenario 1, i.e. all animals having
missing genotypes in scenario 1 have missing genotypes
in scenario 2 as well.
In total, the proportion of missing genotypes is about
41% for scenario 1 and 61% for scenario 2 for both pedi-
gree depths. All IBD matrices applied for MA-BLUP evalu-
ations were genotypic relationship matrices for the QTL
and calculated using the package LOKI [14].
Genetic parameters for MA-BLUP models and MA-BLUP
EBV were estimated with the ASREML package [15] using
a MA-BLUP model equivalent to that of Fernando and
Grossman [2] and assuming the QTL position is known
from the mapping experiment.
Parameter combinations applied
Overall, we have examined twelve different models for
MA-BLUP evaluations (two information types, two pedi-
gree depths and three degrees of genotyping gaps). In
order to limit the amount of variants presented in the
paper, we decided to use a stepwise presentation. First, we
will compare the DYD model and the DYD-YD model
only in the case of complete information and short pedi-
gree. Second, we will proceed with the comparison of
short and deep pedigree for the DYD-YD model only and
finally we will discuss the effects of missing genotypes in
the context of the DYD-YD model with a deep pedigree.
The variants are summarized in the first three columns of
Table 4.
Parameters studied
Parameters considered for the estimation of variance com-
ponents were the bias of estimated variance components
and their standard errors.
The estimates deviation from the simulated parameters
was used to check for bias due to the pedigree depth and/
or missing genotypes. Standard errors of the estimates
were used to assess the precision of estimates between dif-
ferent models. In order to assess the fit of the genetic
model, the likelihood ratio test (LRT = -2 ln(L
0
(no QTL
present)-L
1
(QTL present)) was calculated. L
0
and L
1
repre-
sent the likelihood values at the REML solutions of evalu-
ations where no QTL was assumed to be segregating (no
QTL present), and where a QTL was assumed to be segre-
gating (QTL present), respectively.
To examine the impact of the different models on the esti-
mation of MA-BLUP breeding values, the correlation of
true and estimated breeding values was calculated for each
group of animals (bulls, cows, young bull candidates).
Results
Results presented are the averages of 100 replicates for a
20% simulated proportion of genetic variance explained
by the QTL. Even if QTL variances close to zero were esti-
mated in single replicates as an effect of a weak data struc-
ture, especially in DYD models for short pedigrees, these
estimates were not excluded from the analysis in all inves-
tigated situations. This was necessary, as it was our inter-
est, to elaborate and characterize the range of estimated
parameters when a QTL is known to segregate with a fixed
variance. In contrast, studies that aim at a possible gain
due to MAS [16] allow for the exclusion of replicates that
will not give benefits for the breeding program, because
structure of the data and relevant parameters indicate that
MAS will not improve selection.
Variance component estimation
Results for the estimation of variance components for the
investigated combinations of phenotypic information,
pedigree depth and missing genotypes are summarized in
Table 4. The first two lines of table 4 concern the question:
which amount of phenotypic information should be
used? In DYD models, the additive genetic variance ( )
was underestimated while the genetic variance explained
ˆ
a
2
Table 3: Proportions of genotypes that are assumed to be missing for moderate and extensive gaps in the genotyping structure
Missing genotypes Sire Paternal grandsire Maternal grandsire Dam Paternal granddam Maternal granddam
Scenario 1, moderate 0.15 0.30 0.50 0.30 0.85 0.90
Scenario 2, extensive 0.50 0.70 0.80 0.90 0.90 0.90
According to the position of an animal in the pedigree, probabilities for being non-genotyped were chosen.
Genetics Selection Evolution 2009, 41:26 />Page 5 of 10
(page number not for citation purposes)
by the QTL ( ) and the ratio of and were over-
estimated. The estimates in DYD-YD models were closer
to the simulated parameters. The standard errors of the
estimated variance components were lower in DYD-YD
models.
Figure 1 visualizes the variation of the estimated genetic
variances in DYD and DYD-YD models. The amplitude in
DYD-YD models is smaller for both and . The
benefit of using YD in addition to DYD is also confirmed
by the higher LRT of the DYD-YD model (see Figure 1).
The effect of increasing the depth of the pedigree is sum-
marized in the second and third lines of Table 4. The val-
ues of the estimated components are nearly the same
whether the short or deep pedigree is applied, but stand-
ard errors indicate an increased accuracy for the estimates
in the deep pedigree. The graphs in Figure 2 visualize the
estimated standard errors. Increasing the pedigree depth
reduces notably the variation between the replicates,
which can also be seen from the higher LRT.
Results for the impact of missing genotypes are shown in
lines three to five of Table 4. Missing genotypes do not
lead to biased estimates for variance components. How-
ever, they increase the standard error for whereas the
standard errors for all other variance components are
hardly affected (see Figure 2).
Accuracy of MA-BLUP EBV
To evaluate the consequences of the varying conditions
for the estimation of MA-BLUP breeding values, accura-
cies were calculated for proven bulls, cows and young bull
candidates. Correlations between simulated and esti-
mated breeding values were assessed for the overall MA-
BLUP EBV (2), the residual polygenic breeding value (
in (2)), and the breeding value at the QTL (QTL-EBV,
in (2)). The results shown in Table 5 are again averages of
100 replicates.
Accuracies in AM evaluations were 0.950 for proven bulls,
0.760 for cows and 0.560 for young bulls. Average MA-
BLUP accuracies for all categories of animals are hardly
affected by the model, pedigree depth or missing geno-
types, but strongly affected by the inclusion of YD. The
increase in pedigree depth causes a slight improvement of
accuracy for young bulls, because the gametic effects can
be estimated more accurately. However, this slight
increase is gradually lost as the amount of missing geno-
types increases.
Discussion
Questions examined in this study came up during the
implementation of MAS for Simmental cattle in Germany
and Austria. Our main interest was to find out how to set
up an appropriate MA-BLUP system given that it was
already decided to use MAS, and in view of the fact that
not all relevant animals can be genotyped. In this study,
we have investigated the impact of three factors on the
estimation of variance components for marker-assisted
selection under realistic assumptions: phenotypic infor-
mation, depth of the pedigree and missing genotypes.
Design and simulation
Early studies about properties of MAS are in most cases
based on nucleus breeding programs [17,18], but this
assumption does not hold for the majority of cattle breed-
ˆ
qtl
2
ˆ
a
2
ˆ
qtl
2
ˆ
a
2
ˆ
qtl
2
ˆ
qtl
2
ˆ
u
i
ˆ
v
i
Table 4: Simulated and estimated parameters for the estimation of variance components when evaluation models were only based on
daughter yield deviations (DYD) for bulls or DYD for bulls in combination with yield deviations (YD) for cows
Phenotypic information Pedigree depth Missing genotypes log LR
s.e.( ) s.e.( ) s.e.( )
DYD short none 244,267 664,150 55,460 1.855 0.227 39,033 478,491 38,232
DYD-YD short none 259,493 459,265 52,924 2.539 0.204 20,033 31,899 31,892
DYD-YD deep none 260,677 458,426 50,293 7.284 0.193 16,100 25,221 19,392
DYD-YD deep moderate 260,738 458,418 50,462 6.400 0.194 16,109 25,246 20,996
DYD-YD deep extensive 260,899 458,271 51,020 5.373 0.196 16,133 25,284 23,333
Simulated parameters 260,100 462,400 52,020 0.200
Different pedigree structures (short and deep) and levels of missing genotypes (none, moderate and extensive) were applied; parameters shown are
the additive genetic variance ( ), the residual variance ( ), the genetic variance explained by one QTL ( ), the log likelihood ratio (log LR),
the ratio of and , and the estimated standard errors for the estimated variance components (s.e.); the values are averages over 100
replicates
ˆ
a
2
ˆ
e
2
ˆ
qtl
2
ˆ
qtl
a
2
ˆ
a
2
ˆ
e
2
ˆ
qtl
2
ˆ
a
2
ˆ
e
2
ˆ
qtl
2
ˆ
a
2
ˆ
qtl
2
Genetics Selection Evolution 2009, 41:26 />Page 6 of 10
(page number not for citation purposes)
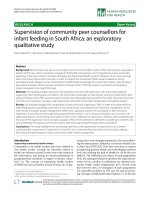
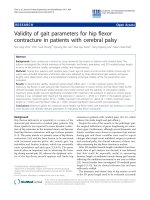
Estimated ( ) additive genetic variance and variance explained by a QTL compared to the simulated ( ) parameters for a short depth of pedigree (see text for details)Figure 1
Estimated ( ) additive genetic variance and variance explained by a QTL compared to the simulated ( )
parameters for a short depth of pedigree (see text for details). Figure 1a presents results for MA-BLUP models using
only daughter yield deviations (DYD) of bulls as phenotypic information, whereas Figure 1b shows the results for MA-BLUP
evaluations using DYD of bulls and yield deviations (YD) of cows together.
150000 250000 350000
0 50000 150000
Short pedigree, DYD model
additive genetic variance
QTL variance
simulated variances
estimated variances
1a
150000 250000 350000
0 50000 150000
Short pedigree, DYD-YD model
additive genetic variance
QTL variance
simulated variances
estimated variances
1b
Genetics Selection Evolution 2009, 41:26 />Page 7 of 10
(page number not for citation purposes)
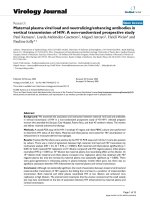
Estimated ( ) additive genetic variance and variance explained by one QTL in comparison to their simulated ( ) parameters when phenotypic information is used for bulls and cowsFigure 2
Estimated ( ) additive genetic variance and variance explained by one QTL in comparison to their simulated
( ) parameters when phenotypic information is used for bulls and cows. Phenotypic information corresponds to
daughter yield deviations (DYD) of bulls and yield deviations (YD) of cows; Figure 2a presents results for MA-BLUP models
with a short depth of pedigrees (see text for details), whereas in Figure 2b deep pedigrees were used for MA-BLUP evalua-
tions.
150000 250000 350000
0 50000 150000
Short pedigree, DYD-YD model
additive genetic variance
QTL variance
simulated variances
estimated variances
2a
150000 250000 350000
0 50000 150000
Deep pedigree, DYD-YD model
additive genetic variance
QTL variance
simulated variances
estimated variances
2b
Genetics Selection Evolution 2009, 41:26 />Page 8 of 10
(page number not for citation purposes)
ing programs in Europe. Therefore, in this study, MAS was
integrated in an existing breeding program using a two-
step approach as is the case for practical applications in
France and Germany [19,7].
Genetic parameters, information content of genetic mark-
ers and variance explained by the QTL in the simulation
were in agreement with recent results found in German
Simmental cattle (unpublished data). Allele frequencies
of 0.5 for alternative QTL alleles were assumed to reduce
the risk of loosing alternative alleles due to random drift
along the simulation process. As mentioned by Rön-
negård and Carlborg [20] simulations have shown that
random QTL models are capable of giving unbiased esti-
mates even when the QTL is biallelic. Furthermore, the
assumptions of a biallelic QTL and balanced allele fre-
quencies reflect findings for QTL in cattle. A well-known
example for a biallelic QTL is the K232A substitution in
DGAT1. Estimated allele frequencies for alleles at K232A
were 0.548 and 0.452 in German Holsteins [21]. Another
biallelic QTL is reported for the bovine prolactin receptor
in Finnish Ayrshire [22] with allele frequencies of 0.45/
0.55 for snp 6. Guillaume et al. [23] have reported the pro-
portions of genetic variance explained by single QTL used
for the French MAS-program, which range from 5 to 40%
for individual QTL. Hence, a QTL explaining 20% of the
genetic variance in this study is in the scope of findings for
MAS programs in reality. In contrast to practical applica-
tions of MAS using multiple QTL [23,7] this study was
restricted to a single QTL. Our intention was to examine
the influence of different structures of information (pedi-
gree depth, completeness of genotyping) on the estima-
tion of QTL effects. We did not want to examine the effect
of several QTL on the accuracy of genetic parameters or on
the benefits of MAS. We think that our conclusions will
also hold for situations with more QTL, because, in prac-
tice, we observe that animals are either genotyped for all
QTL or not genotyped at all.
Choice of phenotypic information
According to our results, the choice of phenotypic infor-
mation in MA-BLUP models is important. We have shown
(Neuner et al., [3]) that the two-step approach intrinsi-
cally causes a loss of information because not all relatives
contribute to the MA-BLUP breeding value. In conse-
quence, some proportion of the QTL information is
required to compensate this loss of information. The
inclusion of yield deviations for dams reduces this loss of
information. As we have shown here, yield deviations also
improve the precision for the estimated variance compo-
nents and deviations from the simulated parameters
become smaller. Neuner et al. [3] have already discussed
the topic concerning the 'choice of weighting factors in
MA-BLUP models'. According to the results, the weighting
factors daughter equivalents and effective daughter contri-
butions do not introduce bias. One challenge is to com-
bine correctly DYD and YD in one model as these two
types of information contain different amounts of genetic
and residual variance [3].
Pedigree depth
The advantage of a more extensive pedigree of genotyped
animals for MA-BLUP is obvious. The more animals have
complete information, the smaller is the observed stand-
ard error of the estimated parameters. Similar to the effect
of having more offspring for progeny tested bulls, a
deeper pedigree implies more data and more informative
matings for the estimation of QTL effects of parents and
grandparents in MA-BLUP models. Our results show that
using a deep pedigree with many gaps is still preferable
over a short but complete pedigree. The reason for this is
that a deeper pedigree improves the estimation of poly-
genic and residual variances as compared to shorter pedi-
grees.
The effect of a more parsimonious pedigree has also been
shown by George et al. [13]. By altering the number of off-
Table 5: Accuracies of estimated breeding values in MA-BLUP evaluation models that were only based on daughter yield deviations
(DYD) for bulls or on DYD for bulls and yield deviations for cows
Phenotypic information Pedigree depth Missing genotypes Proven bulls Cows Young bull candidates
MA-BLUP MA-BLUP MA-BLUP Residual polygenic QTL-EBV
DYD short none 0.942 0.388 0.480 0.437 0.296
DYD-YD short none 0.944 0.679 0.556 0.497 0.348
DYD-YD deep none 0.945 0.689 0.566 0.501 0.437
DYD-YD deep moderate 0.945 0.689 0.563 0.501 0.418
DYD-YD Deep extensive 0.945 0.688 0.560 0.500 0.390
Different pedigree structures (short and deep) and levels of missing genotypes (none, moderate and extensive) were applied; accuracies are shown
for the overall breeding values of MA-BLUP evaluations, the residual polygenic breeding value and breeding value for the QTL position (QTL-EBV);
in breeding value estimation, the estimated variance components were used; the results are averages over 100 replicates per scenario.
Genetics Selection Evolution 2009, 41:26 />Page 9 of 10
(page number not for citation purposes)
spring per mating from 1.8 to 14.3 offspring per mating,
the number of progeny per parent providing information
to estimate genetic parameters and MA-BLUP EBV was
higher. Even if the approach of George et al. [13] was dif-
ferent from the one in our study, similar effects of a larger
pedigree were observed: more accurate estimates and
increased power.
Missing genotypes
The third factor investigated was the effect of missing gen-
otypes in MA-BLUP evaluations. If marker information
was complete and could be used to infer the transmission
of QTL alleles, then the IBD matrix would only contain 1s
and 0s. At the other extreme, if no marker information
was available, the IBD matrix would become identical to
the numerator relationship matrix, i.e. all covariance ele-
ments with the parents will be equal to 0.5, signifying
equal probability of inheriting either allele from a parent.
In the end, this would result in identical estimators for
residual polygenic and QTL variance. Several approaches
exist to deal with the problem that non-genotyped ani-
mals do not contribute information for QTL models [13].
A well-known approach is the multiple-site segregation
sampler LOKI [14] that was used in this study. We found
that missing genotypes did not lead to biased variance
components. In contrast to our results, George et al. [13]
have reported that, if more genotypes are missing, the QTL
variance is overestimated, the residual polygenic variance
is underestimated and bias is increased. The main reason
for these contradictory results could be that the structure
of pedigree and missing data in our study allowed a much
better reconstruction of missing genotypes by LOKI. In the
sheep pedigree of George et al. [13] the number of male
progeny and grand progeny was smaller than that in the
cattle breeding program of this research. Thus, less
descendants are available to contribute information for
the reconstruction of their ancestors' genotypes. Further-
more, the amount of phenotypic information per sire is
very different in both studies. Compared to George et al.
[13], both the better ability to reconstruct missing geno-
types and the higher amount of phenotypic information
for MA-BLUP result in unbiased estimates in our study.
Effects on accuracy of MA-BLUP
A QTL explaining 20% of the additive genetic variance was
intentionally chosen, because such a QTL is in the order
of magnitude that we observed in Simmental cattle and
because it shows nicely that MA-BLUP is not necessarily
more accurate than conventional BLUP. Our results show
that the accuracy of MA-BLUP breeding values is little
affected by the pedigree depth and hardly affected by
missing genotypes. However, it is strongly affected by the
inclusion of YD in the MA-BLUP system [3]. Guillaume et
al. [23] have reported empirical results for the accuracies
of EBV for young bulls in the French MAS program. The
results of our study are in line with their findings for milk
yield. When 40% of the genetic variance were marked
with four QTL, they found an increase in accuracy for EBV
of young bulls in MA-BLUP models of 0.030 compared to
the AM model. In our study, we observed accuracies that
were 0.006 higher for one QTL explaining 20% of the
genetic variance. The main reason for this small increase
was the loss of information due to the two-step approach.
As mentioned by Neuner et al. [3] the loss has to be com-
pensated before additional gain can arise. With respect to
accuracy of EBV in MA-BLUP models, Villanueva et al.
[16] have investigated the benefit of increased pedigree
and marker information. They simulated four additional
generations of random selection in order to extend their
data set. The increased amount of marker genotype infor-
mation significantly increased the accuracy of the estima-
tion of the QTL effects from 0.54 to 0.65. Parameters in
their study were 0.25 for the heritability and 0.24 for the
ratio of genetic variance explained by the QTL. Spelman
[24] also concluded that if more animals are genotyped in
each generation and if more generations of genotypic
information are used for MAS, an increase in accuracy of
the estimation of QTL effects and therefore in MAS supe-
riority are obtained.
At present many research programs are conducted in order
to implement genomic breeding value estimations as
described by Meuwissen et al. [25]. Although first imple-
mentations exist [26] it is not sure that MAS schemes will
be abandoned. Improvements in existing MAS programs
will directly improve the selection until genomic selection
will be applied. We also expect that QTL mapping based
on the variance component approach [13] will continue
in the future. Our results can be helpful in optimizing the
choice of individuals to be genotyped.
In genomic selection projects, which animals to genotype
and which source of phenotypic information to use will
also have to be decided. Comparable to our study, we
expect it will be necessary to rank animals selected for gen-
otyping by their importance in the pedigree and their
impact on further generations. For the phenotypic infor-
mation, applied appropriate weighting and combination
of DYD and YD will also be necessary for a correct mode-
ling of genetic and residual variances. As soon as dams
will be genotyped for genomic selection, considering their
genotypes and YD for parameter estimation will help to
improve the accuracy of estimated QTL effects in the same
way as in our current study.
Conclusion
The main conclusion of this study is that phenotypic
information of cows and an increased depth of the pedi-
gree have an important impact on the precision of genetic
parameters estimated in MA-BLUP models. Furthermore,
Genetics Selection Evolution 2009, 41:26 />Page 10 of 10
(page number not for citation purposes)
deep pedigrees with many missing genotypes provide
more accurate estimates than short pedigrees with com-
plete genotyping. While the estimation of variance com-
ponents is considerably improved by a deep pedigree with
no missing genotypes, the accuracy of MA-BLUP genetic
evaluation is hardly affected by these factors. As a conse-
quence, if exact QTL parameters are available from other
sources, the same accuracy of MA-BLUP can also be
achieved with a short pedigree and many missing geno-
types.
Competing interests
The authors declare that they have no competing interests.
Authors' contributions
The questions examined in this study were established
from several discussions including all authors. All authors
participated in setting up the design, performing the study
and helped to draft the manuscript. The main impact of
each is as follows: SN wrote the simulation programs, per-
formed the study and wrote the first draft of the manu-
script. CE gave support for a realistic modeling of missing
genotypes and pedigree depth according to German Sim-
mental cattle, to set up the simulation study using LOKI
and for the interpretation of results. RE made suggestions
for simulating the population structure, helped during
programming and integrating of software packages MIX
and ASREML and also checked programs and results. GT
participated in setting up the design and conception of the
study, helped to discuss the results and to draw conclu-
sions and revised the manuscript to improve readability.
KUG conceived the study and helped to perform it,
revised large parts of the manuscript with respect to con-
tent and readability. All authors read and approved the
final manuscript.
Acknowledgements
The authors gratefully acknowledge financial support from of the German
Federal Ministry of Education and Research (projects FUGATO MAS Net,
grant no. 0313390F and FUGATO+ BRAIN grant no. 0315136C) and of the
Förderverein Biotechnologieforschung, Bonn.
References
1. Dekkers JCM: Commercial application of marker- and gene-
assisted selection in livestock: Strategies and lessons. J Anim
Sci 2004, 82(E-Suppl):E313-328.
2. Fernando RL, Grossman M: Marker assisted selection using best
linear unbiased prediction. Genet Sel Evol 1989, 21:467-477.
3. Neuner S, Emmerling R, Thaller G, Götz KU: Strategies for esti-
mating genetic parameters in marker-assisted best linear
unbiased prediction models in dairy cattle. J Dairy Sci 2008,
91:4344-4354.
4. Interbull: Description of national genetic evaluation system
and trend validation for production traits. 2007 [http://www-
interbull.slu.se/national_ges_info2/framesida-ges.htm].
5. Haldane JBS: The combination of linkage values, and the calcu-
lation of distances between the loci of linked factors. J Genet
1919, 8:299-309.
6. Rijsdijk FR, Sham PC: Improved estimation of multipoint IBD
sharing and multipoint information content by linear regres-
sion. Behaviour Genet 2002, 32:211-220.
7. Liu Z, Reinhardt F, Szyda J, Thomsen H, Reents R: A marker
assisted genetic evaluation system for dairy cattle using a
random QTL model. Interbull Bull 2004, 32:170-174.
8. Druet T, Fritz S, Boichard D, Colleau JJ: Estimation of genetic
parameters for quantitative trait loci for dairy traits in the
French Holstein population. J Dairy Sci 2006, 89:4070-4076.
9. Bennewitz J, Reinsch N, Reinhardt F, Liu Z, Kalm E: Top down
preselection using marker-assisted estimates of breeding
values in dairy cattle. J Anim Breed Genet 2004, 121:307-318.
10. VanRaden PM, Wiggans GR: Derivation, calculation, and use of
national animal model information. J Dairy Sci 1991,
74:2737-2746.
11. Vuori K, Strandén I, Lidauer M, Mäntysaari EA: MiX99 – Effective
solver for large and complex linear mixed models. Proceedings
of the 8th World Congress on Genetics Applied to Livestock Production: 13–
18 August 2006; Belo Horizonte .
12. Fikse WF, Banos G: Weighting factors of sire daughter infor-
mation in international genetic evaluations. J Dairy Sci 2001,
84:1759-1767.
13. George AW, Visscher PM, Haley CS: Mapping quantitative trait
loci in complex pedigrees: a two-step variance component
approach. Genetics 2000, 156:2081-2092.
14. Heath SC: Markov chain Monte Carlo segregation and linkage
analysis for oligogenic models. Am J Hum Genet 1997,
61:748-760.
15. Gilmour AR, Thompson R, Cullis BR: Average information
REML: an efficient algorithm for variance parameter estima-
tion in linear mixed models. Biometrics 1995, 51:1440-1450.
16. Villanueva B, Pong-Wong R, Woolliams JA:
Marker assisted selec-
tion with optimised contributions of the candidates to selec-
tion. Genet Sel Evol 2002, 34:679-703.
17. Meuwissen THE, Goddard ME: The use of marker haplotypes in
animal breeding schemes. Genet Sel Evol 1996, 28:161-176.
18. Ruane J, Colleau JJ: Marker-assisted selection for a sex-limited
character in a nucleus breeding population. J Dairy Sci 1996,
79:1666-1678.
19. Druet T, Fritz S, Colleau JJ, Gautier M, Eggen A, Rossignol MN,
Boscher MY, Malafosse A, Boichard D: Genetic markers in breed-
ing programs. Proceedings of the 26th European Holstein and Red Hol-
stein Conference: May 2005; Prague [o/pdf/
26ehc_prague/druet.pdf].
20. Rönnegård L, Carlborg Ö: Separation of base allele and sam-
pling term effects gives new insights in variance component
QTL analysis. BMC Genet 2007, 8:1-14.
21. Thaller G, Krämer W, Winter A, Kaupe B, Erhardt G, Fries R: Effects
of DGAT1 variants on milk production traits in German cat-
tle breeds. J Anim Sci 2003, 81:1911-1918.
22. Viitala S, Szyda J, Blott S, Schulman N, Lidauer M, Maki-Tanila A,
Georges M, Vilkki J: The role of the bovine growth hormone
receptor and prolactin receptor genes in milk, fat and pro-
tein production in Finnish Ayrshire dairy cattle. Genetics 2006,
173:2151-2164.
23. Guillaume F, Fritz S, Boichard D, Druet T: Correlations of marker-
assisted breeding values with progeny-test breeding values
for eight hundred ninety-nine French Holstein bulls. J Dairy Sci
2008, 91:2520-2522.
24. Spelman RJ: Major factors in marker-assisted selection genetic
response in dairy cattle populations. Proceedings of the 6th World
Congress on Genetics Applied to Livestock Production: 11–16 January
1998; Armidale 1998, 26:365-368.
25. Meuwissen THE, Hayes BJ, Goddard ME: Prediction of total
genetic value using genome-wide dense marker maps. Genet-
ics 2001, 157:1819-1829.
26. VanRaden PM, Van Tassell CP, Wiggans GR, Sonstegard TS, Schnabel
RD, Schenkel F: Genomic data and cooperation result in faster
progress. Interbull Bull 2008, 38:.