Báo cáo sinh học: "Genomic scan for quantitative trait loci of chemical and physical body composition and deposition on pig chromosome X including the pseudoautosomal region of males" ppsx
Bạn đang xem bản rút gọn của tài liệu. Xem và tải ngay bản đầy đủ của tài liệu tại đây (301.87 KB, 9 trang )
BioMed Central
Page 1 of 9
(page number not for citation purposes)
Genetics Selection Evolution
Open Access
Research
Genomic scan for quantitative trait loci of chemical and physical
body composition and deposition on pig chromosome X including
the pseudoautosomal region of males
Carol-Anne Duthie
1
, Geoff Simm
1
, Miguel Pérez-Enciso
2
, Andrea Doeschl-
Wilson
1
, Ernst Kalm
3
, Pieter W Knap
4
and Rainer Roehe*
1
Address:
1
Animal Breeding and Development, Sustainable Livestock Systems Group, Scottish Agricultural College, West Maibns Road, Edinburgh,
EH9 3JG, UK,
2
ICREA, Dept. Food and Animal Science, Universitat Autònoma de Barcelona, 08193 Bellaterra, Spain,
3
Institute of Animal Breeding
and Husbandry, Christian-Albrechts-University of Kiel, Hermann-Rodewald-Strasse 6, D-24118 Kiel, Germany and
4
PIC Germany, Ratsteich 31,
D-24837 Schleswig, Germany
Email: Carol-Anne Duthie - ; Geoff Simm - ; Miguel Pérez-Enciso - ;
Andrea Doeschl-Wilson - ; Ernst Kalm - ; Pieter W Knap - ;
Rainer Roehe* -
* Corresponding author
Abstract
A QTL analysis of pig chromosome X (SSCX) was carried out using an approach that accurately
takes into account the specific features of sex chromosomes i.e. their heterogeneity, the presence
of a pseudoautosomal region and the dosage compensation phenomenon. A three-generation full-
sib population of 386 animals was created by crossing Pietrain sires with a crossbred dam line.
Phenotypic data on 72 traits were recorded for at least 292 and up to 315 F
2
animals including
chemical body composition measured on live animals at five target weights ranging from 30 to 140
kg, daily gain and feed intake measured throughout growth, and carcass characteristics obtained at
slaughter weight (140 kg). Several significant and suggestive QTL were detected on pig
chromosome X: (1) in the pseudoautosomal region of SSCX, a QTL for entire loin weight, which
showed paternal imprinting, (2) closely linked to marker SW2456, a suggestive QTL for feed intake
at which Pietrain alleles were found to be associated with higher feed intake, which is unexpected
for a breed known for its low feed intake capacity, (3) at the telomeric end of the q arm of SSCX,
QTL for jowl weight and lipid accretion and (4) suggestive QTL for chemical body composition at
30 kg. These results indicate that SSCX is important for physical and chemical body composition
and accretion as well as feed intake regulation.
Introduction
To understand the genetic control of economically impor-
tant traits in pigs a large number of studies have investi-
gated QTL that contribute to variation in these traits e.g.
[1-4]. Most QTL have been identified on autosomes with
only a few on the sex chromosomes. One reason may be
that the role of sex chromosomes in the genomic regula-
tion of these traits is less important. Another reason may
come from the fact that, until recently, software modelling
more appropriately the specific features of sex chromo-
somes was not available. Indeed, the mammalian X chro-
mosome is considerably larger than the Y chromosome
Published: 11 March 2009
Genetics Selection Evolution 2009, 41:27 doi:10.1186/1297-9686-41-27
Received: 4 March 2009
Accepted: 11 March 2009
This article is available from: />© 2009 Duthie et al; licensee BioMed Central Ltd.
This is an Open Access article distributed under the terms of the Creative Commons Attribution License ( />),
which permits unrestricted use, distribution, and reproduction in any medium, provided the original work is properly cited.
Genetics Selection Evolution 2009, 41:27 />Page 2 of 9
(page number not for citation purposes)
and carries more genes [5,6]. For example, 1 250 genes are
known on the human X chromosome but only 147 on the
Y chromosome [7]. As a result, female cells, which carry
two copies of the X chromosome, contain twice as many
X-linked genes than males. Mammals have developed a
mechanism to balance the dosage of the X chromosome
genes between sexes, called the dosage compensation
phenomenon [8,9]. Furthermore, chromosomes X and Y
only share a small homologous region called the pseudo-
autosomal region [10].
Because QTL mapping software taking into account the
specific X chromosome features was not available, most
studies have adopted a regression based approach analyz-
ing males and females separately, which decreases the
power of QTL detection e.g. [11,1,12]. Recently, Perez-
Enciso et al. [13] have developed software combining a
mixed model methodology and a maximum likelihood
approach, which can model the specific X chromosome
features in a QTL analysis.
Therefore, the aim of the present study was to investigate
QTL on pig chromosome X (SSCX) for chemical and phys-
ical body composition and deposition using a methodol-
ogy, which accurately takes into account the features
associated with this chromosome.
Methods
Animal resources
This study was based on data recorded from a three-gener-
ation full-sib design, developed from a cross between
seven unrelated Pietrain grandsires, all heterozygous (Nn)
at the ryanodine receptor 1 (RYR1) locus, and 16 unrelated
grand-dams from a three-way cross of Leicoma boars with
Landrace x Large White dams. Eight boars from the F
1
gen-
eration, were mated to 40 sows over two parities to pro-
duce the F
2
generation comprising 315 pigs. Forty-eight
gilts and 46 barrows of the F
2
generation were housed
individually in straw-bedded pens and fed manually with
a weekly recording of feed consumption. The remaining
animals (117 gilts and 104 barrows) were housed in
mixed sex groups of up to 15 pigs in straw-bedded pens.
Animals housed in groups were fed with an electronic
feeding station (ACEMA 48), which recorded feed con-
sumption at each visit. According to body weight ranges,
three different pelleted diets were provided i.e. containing
13.8 MJ ME/kg and 1.2% lysine for range 30–60 kg, 13.8
MJ ME/kg and 1.1% lysine for 60–90 kg and 13.4 MJ ME/
kg and 1.0% lysine for 90–140 kg. Maximal protein dep-
osition was reached by providing pigs with ad libitum
access to diets, which were formulated slightly above
requirement. For a more detailed description of the
project management see Landgraf et al. [14,15] and Mohr-
mann et al. [16,17].
Physical body composition
Pigs were slaughtered at 140 kg body weight in a commer-
cial abattoir. Phenotypic measurements on 37 traits
related to physical body composition were collected by
two methods, the AutoFOM device and dissection. The
AutoFOM device used an automatic ultrasound scanning
technique to produce a three-dimensional image of the
pig [18], which provided measurements of valuable car-
cass cuts, including average fat thickness, belly weight,
lean content, lean content of the belly and weights of
entire and trimmed shoulder, loin and ham without
bones. The right side of each carcass was dissected into
weights of the primal cuts, neck, shoulder, loin, ham and
belly. The former four cuts were dissected into lean and fat
tissue. Furthermore, weights of the jowl, thick rib, flank,
front as well as hind hock, tail and claw were recorded.
Further measurements were made on the cold left carcass
side, for carcass length, sidefat thickness, fat content and
area of the belly as well as loin eye area, fat area, and thin-
nest fat measure (fat degree B) calculated at the 13
th
/14
th
rib interface. Landgraf et al. [14] have described more pre-
cisely the dissection of carcasses.
Chemical body composition
Phenotypic information was obtained for 25 traits related
to chemical body composition and deposition. Protein
content of the loin and intramuscular fat content were
measured by near-infrared reflectance spectroscopy in the
musculus longissimus thoracis et lumborum. The deuterium
dilution technique, an in vivo method determining chem-
ical body composition based on body water was used to
determine protein, lipid and ash contents of the empty
body at target body weights of 30, 60, 90, 120, and 140 kg.
The accuracy of this technique has been verified in previ-
ous studies using magnetic resonance imaging on live ani-
mals [17] and chemical analysis of serially-slaughtered
animals [15]. This method measures the water content of
the empty body, from which the percentage of fat-free
substance of the empty body can be estimated. Based on
the percentage of the fat-free substance, protein and ash
content of the empty body are estimated, and lipid con-
tent is the deviation of the fat-free content from one. The
equations for estimating these chemical components were
developed by Landgraf et al. [15] using the data of the F
1
generation of the three-generation full-sib population
analyzed in the present study. Protein and lipid accretion
rates at four stages of growth were calculated as the differ-
ence between protein or lipid composition at two consec-
utive target weights divided by days of growth between the
target weights. Furthermore, daily gain, feed intake and
food conversion ratio were recorded at different stages of
growth. Means and standard deviations of the 72 traits
analyzed in the present study are presented in Additional
file 1, Table S1.
Genetics Selection Evolution 2009, 41:27 />Page 3 of 9
(page number not for citation purposes)
Genotypic data
Blood samples were collected from F
0
, F
1
and F
2
animals
from the vena jugularis and DNA was isolated. All animals
were genotyped for eight informative microsatellite mark-
ers covering SSCX. Markers and their distances were taken
from the published USDA linkage map [19], which pro-
vided all information on their positions and alleles (Table
1). The average distance between markers was 18.3 cM
and the largest gap was 22.4 cM. Linkage analysis was per-
formed with Crimap [20]. The marker order agrees with
the USDA linkage map but distances between markers dif-
fer from those in the USDA linkage map, which is proba-
bly due to the fact that the marker coverage in the present
study is not as good as in the USDA map.
Statistical analysis
QTL mapping was carried out using the software QxPak
version 2.16 [13]. This program uses mixed models and
the maximum likelihood method to estimate the QTL
location and effects. A fixed effects model that estimates
additive and dominance effects was chosen for the QTL
analysis. In cases where the dominance effect was not sig-
nificant, the analysis was repeated with an additive-only
model. Maternal and paternal imprinting was tested for
only in the pseudoautosomal region. In this analysis, the
additive estimate is defined as half of the difference
between animals homozygous for alleles from the grand-
paternal sire line and those homozygous for alleles from
the grand-maternal dam line. A positive additive genetic
value indicates that the allele originating from the grand-
paternal sire line (Pietrain) showed an increasing QTL
effect compared to the allele from the grand-maternal
dam line and vice versa. The dominance effect is defined as
the deviation of heterozygous animals from the mean of
both types of homozygous animals. Fixed effects and cov-
ariates were fitted in the models depending on their signif-
icance for the trait. Sex, ryanodine receptor genotype
(MHS-genotype) and batch were included in the model
for all traits. In addition, housing was included as a fixed
effect for feed intake and food conversion ratio traits.
Body weight at slaughter was fitted in the model as a cov-
ariate for carcass characteristics measured at slaughter. For
chemical body composition traits measured at different
target weights, body weight at that target weight was fitted
in the model as a covariate. Protein and lipid accretion,
daily gain, feed intake and food conversion ratio were
adjusted for the small differences between target and
actual body weight at the start and end of the considered
weight range. The analysis provides likelihood ratios
under the models tested and associated nominal P-values.
A previous study by Perez-Enciso et al. [21] has shown that
nominal P-values 0.005 and 0.001 correspond to 5% and
1% chromosome-wide significant P-values, respectively,
based on the chi-squared distribution with two degrees of
freedom. Therefore, in the present study, nominal P-val-
ues <0.001, 0.005 and 0.01 were treated as significant at
the 1%, 5% and suggestive at the 10% chromosome-wide
level, respectively. Confidence intervals of QTL were esti-
mated using the 1-LOD drop method [22].
Methodology
The mixed model methodology applied in this study
includes all pedigree information and uses the Maximum
Likelihood Method to estimate the QTL effects. Due to the
flexibility of the methodology, we were able to take into
account the heterogeneity between the sex chromosomes,
the presence of the pseudoautosomal region and the sex
chromosome dosage compensation phenomenon. The
methodology applied here is described in Perez-Enciso et
al. [23] and implemented in the programme QxPak.
In more detail, the main issues relate to modelling the
mammalian dosage compensation and computing the p
s
,
ρ
sA
and
ρ
sB
coefficients. p
si
is the average probability for the
ith individual of a gene within segment s to originate from
breed A.
ρ
sA(i, i')
,
ρ
sB(i, i')
is the probability of individuals i
and i' having received identical-by-descent (IBD) alleles of
breed A(B).
Table 1: Markers used in the present QTL mapping project, their relative map position based on the USDA pig map, their position
from linkage analysis using CRIMAP in this experimental population, number of different alleles, heterozygosity in F
1
generation (H)
and polymorphic information content in the F
2
generation (PIC)
Marker Position (cM)
USDA MAP
Position (cM) experimental data Number of alleles H PIC
SW949 0.0 0.0 6 0.65 0.53
SW980 11.9 36.2 7 0.87 0.80
SW1903 33.0 46.4 5 0.87 0.70
SW2456 55.4 56.5 6 0.81 0.67
SW259 74.4 63.6 5 0.89 0.70
SW1943 87.4 73.5 5 0.70 0.70
SW707 107.9 78.2 4 0.49 0.59
SW2588 128.4 79.8 4 0.25 0.37
Genetics Selection Evolution 2009, 41:27 />Page 4 of 9
(page number not for citation purposes)
In the non-pseudoautosomal region of the X chromo-
some the male phenotype is expressed as:
γ
M
=
μ
M
+ g
2
+ e,(1)
and the female phenotype as:
γ
F
=
μ
F
+
ψ
1
g
1
+
ψ
2
g
2
+ d
g1, g2
+ e,(2)
μ
is sex mean; g
i
, the genetic origin, indicates the haplo-
type origin, 1 for male and 2 for female;
ψ
h
is the dosage
compensation effect for hth haplotype allele effect and d
is the dominance interaction. In this case, interaction
between alleles (dominance) can be estimated only in
females. The allele contributing to the male phenotype
always comes from the mother (g
2
). Parameters
ψ
1
and
ψ
2
should always add up to 1.
The genetic covariances between two crossed individuals
are calculated as:
if i and i' are both males
if i is a male and i' is a female
if i and i' are both females
Where, is the probability of alleles
and being IBD and being of breed origin A, and
is the probability of alleles and
being IBD and being of breed origin B. is the variance
of the gene effects in breed A and is the variance of
the gene effects in breed B. We define
when i is a male and a female.
In addition, the pseudoautosomal region of the X and Y
chromosomes has been considered. This is the homolo-
gous region between the X and Y chromosomes, thus in
males, this is the only X chromosome region where
recombination can occur [23].
Results
The genomic analysis identified on the pig X chromosome
three significant QTL and five suggestive QTL for carcass
cuts, lean tissue characteristics, chemical body composi-
tion and deposition as well as daily feed intake. The addi-
tive and dominance effects of these QTL are presented in
Table 2. Two QTL were identified with imprinting effects
in the pseudoautosomal region, which are shown in Table
3. The correlations between these traits are presented in
Additional file 2, Table S2.
Carcass characteristics
A QTL significant at the 1% chromosome-wide level was
identified for entire loin weight in the pseudoautosomal
region of SSCX at 7 cM between SW949 and SW980
explaining 3.7% of the phenotypic variance (Figure 1).
The significant additive effect at this QTL indicates that
the grand-paternal Pietrain breed is associated with a 284
g higher loin weight. At a similar location in the pseudo-
autosomal region i.e. at 11 cM, a suggestive QTL was iden-
tified for loin weight without external fat explaining 2.5%
of the phenotypic variance (Figure 2). The significant
additive effect at this QTL indicates that the grand-pater-
nal Pietrain breed is associated with a 185 g higher lean
meat weight of the loin cut. At the telomeric end of the q
arm of SSCX, at the same position as SW2588 (128.4 cM)
a QTL significant at the 1% chromosome-wide level was
identified for jowl weight accounting for 5.8% of the phe-
notypic variance (Figure 1). The significant dominance
effect at this QTL indicates that heterozygous animals are
associated with a 217 g higher jowl weight.
Chemical body composition and accretion
At the telomeric end of the q arm of SSCX, at the same
position as the QTL for jowl weight and SW2588 (128.4
cM), a QTL significant at the 5% chromosome-wide level
was identified for lipid accretion rate during the growth
period between 90 and 120 kg (Figure 1). This QTL
accounts for 3.2% of the phenotypic variance and the sig-
nificant additive effect indicates that the purebred Pietrain
breed is associated with a 27 g higher lipid accretion rate
at this growth period. Suggestive QTL for protein content
of the fat-free substance and protein and lipid content of
the empty body were identified between SW259 and
SW1943 at 82–83 cM explaining 3.1, 3.8 and 3.3% of the
phenotypic variance, respectively (Figure 2). These traits
showed similar likelihood ratio profiles as they are closely
correlated (Additional file 2, Table S2). Pietrain alleles
associated with decreased additive genetic effects of pro-
tein content of the fat-free substance are found at these
QTL and heterozygous animals showed dominance effects
associated with increased lipid content of the empty body,
Cov g g g g A g g B
ii ii Ag ii Bg
( , ) Pr( ) Pr( ) ,
’’ ’
=≡∈ +≡∈
22 2 22
ss
(3)
Cov g g g g A g g B
ii
h
ii
h
Ag i i
h
Bg
h
( , ) [Pr( ) Pr( ) ],
’’
=≡∈+≡∈
=
∑
ys s
2222
1
2
(4)
Cov g g g g A g g B
ii
hh
i
h
i
h
Ag i
h
i
h
Bg
h
() [Pr ) Pr( )]
,’
’’
’
’
’
=≡∈+≡∈
yy s s
22
===
∑∑
1
2
1
2
h
,
(5)
Pr( )
’
’
gg A
i
h
i
h
≡∈ g
i
h
g
i
h
’
’
Pr( )
’
’
gg B
i
h
i
h
≡∈ g
i
h
g
i
h
’
’
s
Ag
2
()
s
Bg
2
pgA
gi i
=∈Pr( )
2
pgA
gi
h
i
h
h
=∈
=
∑
y
Pr( )
1
2
Genetics Selection Evolution 2009, 41:27 />Page 5 of 9
(page number not for citation purposes)
decreased protein content of the empty body and
increased protein content of the fat-free substance at 30 kg
body weight.
Daily gain, feed intake and food conversion ratio
A single suggestive QTL was identified for daily feed intake
at a late stage of growth (120–140 kg) in a region of SSCX
(56 cM) where no other QTL were identified (Figure 2).
This QTL accounts for 2.3% of the phenotypic variance
and the significant additive effect indicates that Pietrain
alleles are associated with a 102 g/day higher feed intake
at this stage of growth.
Imprinting in the pseudoautosomal region
Two QTL with significant imprinting effects were identi-
fied in the pseudoautosomal region (Table 3). At 6 cM,
significant paternal imprinting effects were identified for
entire loin weight, indicating that only the maternal allele
is expressed at this QTL. A QTL with significant maternal
imprinting effects was identified at 1 cM for neck weight
without external fat, indicating that only the paternal
allele is expressed at this QTL. This QTL for neck weight
without external fat was identified only when imprinting
was considered in the analysis.
Table 2: Evidence for quantitative trait loci (QTL) for carcass cuts, chemical body composition, lipid accretion and feed intake on pig
chromosome X
Trait
1
LR
2
Pos (CI)
3
% Var
4
a ± SE
5
d ± SE
5
Carcass characteristics – dissected carcass cuts
Entire loin weight (g) 11.56** 7 (0–27) 3.7 283.8 ± 82.7 -
Loin weight without external fat (g) 7.68
a
11 (0–33) 2.5 184.5 ± 66.1 -
Jowl weight (g) 17.91** 128.4 (106–128.4) 5.8 57.4 ± 37.6 216.9 ± 74.3
Chemical body composition and accretion rates
Lipid cont. empty body, 30 kg (%) 10.38
a
83 (68–108) 3.3 -0.496 ± 0.259 1.705 ± 0.532
Protein cont. empty body, 30 kg (%) 10.43
a
83 (68–109) 3.8 0.011 ± 0.006 -0.038 ± 0.012
Protein cont. FFS
EB
, 30 kg (%) 9.36
a
82 (59–128.4) 3.1 -0.093 ± 0.046 0.285 ± 0.095
LAR 90–120 g (g/day) 9.60* 128.4 (78–128.4) 3.2 26.7 ± 8.5 -
Daily gain, feed intake and food conversion ratio
DFI 120–140 g (g/day) 7.00
a
56 (36–83) 2.3 101.6 ± 38.2 -
1
Traits of FFS
EB
, LAR and DFI denote fat-free substance of the empty body, lipid accretion rate, daily feed intake, respectively
2
LR represents likelihood ratio values and superscript
a
implies a suggestive QTL at the 10% chromosome-wide level, whereas * and ** imply
significant QTL at the 5% or 1% chromosome-wide levels, respectively
3
Positions of the QTL in cM based on the USDA reference map and confidence intervals (CI) in brackets
4
Percentages of F
2
variance explained by the QTL calculated as the proportion of residual variances due to the QTL effect on the residual variances
excluding the QTL effect
5
Estimated additive (a) and dominance (d) effects and their standard errors (SE); estimates in bold represent significant additive or dominance
effects
Table 3: Evidence for quantitative trait loci (QTL) associated with imprinting effects in the pseudoautosomal region
Trait LR
1
Pos (CI)
2
% Var
3
a ± SE
4
Imprinting
Carcass characteristics (lean and fat)
Entire loin weight (g) 10.07* 6 (0–28) 3.2 133.3 ± 41.6 Paternal
Neck weight without external fat
5
(g) 8.85* 1 (0–13) 2.8 374.0 ± 124.8 Maternal
1
LR represents likelihood ratio values and * implies a significant QTL at the 5% chromosome-wide level
2
Positions of the QTL in cM based on the USDA reference map and confidence intervals (CI) in brackets
3
Percentages of F
2
variance explained by the QTL calculated as the proportion of residual variances due to the QTL effect on the residual variances
excluding the QTL effect
4
Estimated additive (a) effects and their standard errors (SE); estimates in bold represent significant additive effects
5
New QTL only identified when the imprinting effect is included in the model
Genetics Selection Evolution 2009, 41:27 />Page 6 of 9
(page number not for citation purposes)
Discussion
The aim of the present study was to investigate QTL on pig
chromosome X for traits of carcass characteristics, chemi-
cal and physical body composition and accretion rates as
well as daily gain, feed intake and food conversion ratio
considering the specific features of the sex chromosomes
as described in the introduction. There is evidence in the
literature for QTL on pig chromosome X involved in car-
cass characteristics, lean tissue, growth and fatness e.g.
[24,25,2,26,3,4]. In particular, the study by Milan et al. [2]
reported QTL on SSCX with the largest effects for leanness
and fatness traits in a cross between the French Large
White and the Meishan breeds. In the present study, QTL
were identified on SSCX for carcass characteristics (entire
carcass cuts and lean tissue), chemical body composition,
lipid accretion as well as feed intake. The QTL analysis is
based on animals from an F
2
full-sib design of crosses
between Pietrain boars and crossbred commercial dams
in order to reflect the commercial product of growing-fin-
ishing pigs. Therefore, the QTL alleles in the dam founder
may not be fixed, which has to be considered in the inter-
pretation of the results.
In pigs, the pseudoautosomal region lies at the telomeric
end of the p arm of SSCX and covers a ~11 cM region
homologous to the Y chromosome. In the present study,
this region showed important associations with entire
loin weight and lean meat of the loin cut (Figure 1 and
Figure 2). The purebred Pietrain breed is associated with
higher loin weight (284 g) and lean meat weight of the
loin cut (185 g). Within the pseudoautosomal region of
SSCX, QTL for entire carcass cuts and lean tissue have also
been reported in the literature [24,1,26]. A previous
genomic analysis on the autosomes using the same phe-
notypic data as the present study [27,16], detected Pie-
train alleles for QTL on SSC2, SSC6, SSC8, SSC9 and
SSC13 also associated with increased weights of carcass
cuts and lean tissue. However, this was not the case on
SSC14 on which a Pietrain allele was associated with
decreased weights of these characteristics, suggesting a
cryptic gene in a breed selected over a long period for lean-
ness. Although pseudoautosomal regions exist in other
mammals, their length and gene content seem to be vari-
able, for example mouse and human pseudoautosomal
regions are totally non-homologous. Previously, this
region was considered to have an important role in mei-
otic pairing and male fertility. However the variability in
gene content of this region across species and the absence
of this region in marsupials, suggest that it may not be so
important for fertility in mammals [10]. The results of the
present study indicate that this region in pigs contains
genes, which influence carcass characteristics.
QTL for lean tissue characteristics e.g. [1,2,4] have been
detected in regions other than the pseudoautosomal
region of SSCX. In the present study no QTL for lean tissue
was identified, which suggests that the favorable alleles
for lean tissue may already be fixed in the populations
analyzed here. Another surprising result is that no QTL for
fatness was identified although many reports have
described fatness QTL on pig SSCX e.g. [25,2,26,3,28].
Most of these studies were based on crosses between
breeds characterized by a high leanness and breeds char-
acterized by a high fatness i.e. Meishan, wild Boar or Ibe-
rian breeds. Therefore, these QTL may not be segregating
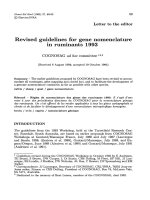
Likelihood ratio curves for evidence of significant quantitative trait loci for entire loin weight, jowl weight and lipid accre-tion rate (LAR) 90–120 kg on SSCXFigure 1
Likelihood ratio curves for evidence of significant
quantitative trait loci for entire loin weight, jowl
weight and lipid accretion rate (LAR) 90–120 kg on
SSCX. Positions in cM are based on the USDA reference
map.
0
2
4
6
8
10
12
14
16
18
20
0 20 40 60 80 100 120
Position (cM)
Likelihood ratio
Entire loin weight
Jowl weight
LAR 90-120 kg
1% threshold
5% threshold
SW980
SW1903
SW2456
SW259
SW19
4
SW707
SW2588
SW949
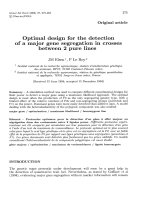
Likelihood ratio curves for evidence of suggestive quantita-tive trait loci for loin weight without external fat, protein content of the empty body at 30 kg body weight and daily feed intake (DFI) 120–140 kg on SSCXFigure 2
Likelihood ratio curves for evidence of suggestive
quantitative trait loci for loin weight without exter-
nal fat, protein content of the empty body at 30 kg
body weight and daily feed intake (DFI) 120–140 kg
on SSCX. Positions in cM are based on the USDA reference
map.
0
2
4
6
8
10
12
0 20 40 60 80 100 120
Position (cM)
Likelihood ratio
Loin weight without external fat
Protein content of the empty body, 30 kg
DFI 120-140 kg
SW980
SW1903
SW2456
SW259
SW194
3
SW707
SW258
8
SW949
10% threshold
Genetics Selection Evolution 2009, 41:27 />Page 7 of 9
(page number not for citation purposes)
in our population, which has been selected for leanness
over a long time.
It is likely that the genomic regulation of chemical body
components and their accretion is a complex process
involving more than one genomic region and regulated dif-
ferently throughout growth. Measurements of chemical
body composition in live animals are expensive. Therefore,
studies on QTL associated with these traits are limited to
two studies analyzing the data of the present population
across several autosomes [27,16]. In the present study, we
have identified a significant QTL for lipid accretion rate at
90–120 kg on SSCX, while a previous report by Duthie et al.
[27] detected QTL for the same trait on two autosomes at
60–90 kg on SSC8 and at 120–140 kg on SSC9. Pietrain
alleles were found to be associated with increased lipid
accretion rate at 60–90 kg on SSC8 and 90–120 kg on
SSCX. A significant dominance effect was identified at the
QTL for lipid accretion rate 120–140 kg on SSC9, however
no dominance effect was identified on SSCX. The QTL for
lipid accretion rate identified on SSCX is in a region con-
taining no QTL for fat tissue, unlike the QTL detected on
SSC8 and 9, which were close to numerous QTL for subcu-
taneous fat (SSC9) and a QTL for intramuscular fat (SSC8)
[27]. This result is surprising because many QTL for fat tis-
sue traits have been reported around this SSCX region
[2,23,28]. In the same location as the SSCX QTL associated
with lipid accretion rate, a QTL for jowl weight was found
(Figure 1). Heterozygous animals had a higher weight of
the jowl cut. A previous analysis of the same phenotypic
data also revealed a QTL for jowl weight on SSC1 [16] but
heterozygous animals at this QTL had a lower jowl weight.
Furthermore, a significant additive effect indicated that Pie-
train alleles were associated with lower jowl weight on
SSC1. To our knowledge, there is no other data in the liter-
ature for such QTL.
Suggestive QTL were identified in the present study for
chemical body composition at an early growth stage (30
kg body weight), in a region of SSCX where no other QTL
were identified (Figure 2). Previously, QTL for chemical
body composition for early growth stages have also been
identified on autosomes: 30 kg, SSC6, 60 kg, SSC6 and
SSC9 [27,16]. At the QTL on SSC6 and SSC9 for chemical
body composition at 30 kg and 60 kg, respectively, signif-
icant dominance effects indicate that heterozygous ani-
mals are associated with decreased protein content of the
fat-free substance and lipid content of the empty body,
but increased protein content of the empty body. In con-
trast, at the QTL on SSCX and SSC6 for chemical body
composition at 30 kg and 60 kg respectively, significant
dominance effects indicate that heterozygous animals are
associated with increased protein content of the fat-free
substance and lipid content of the empty body, and
decreased protein content of the empty body. The QTL
likelihood ratio profile for protein content of the empty
body is almost identical to the QTL for lipid content of the
empty body, which is expected for traits that change pro-
portionally in opposite directions. A large number of QTL
have been reported for lean and fat tissue as well as for
growth e.g. [29,24,2,28] in the same SSCX region as that
containing QTL for chemical body composition. There-
fore it is surprising that no QTL were identified in this
study for physical body composition traits in this region
of SSCX.
Cepica et al. [30] have assigned seven genes between
markers SW259 and SW1943, within the same region as
the QTL for chemical body composition identified in the
present study. Based on location and function, Acyl-CoA
synthetase long-chain 4 gene (ACSL4) is a potential posi-
tional candidate gene for the QTL for chemical body com-
position in the present study because it plays a key role in
the metabolism of fatty acids and thus energy balance
[31].
A suggestive QTL for daily feed intake for the growth stage
120–140 kg was identified in a region of SSCX where no
other QTL were identified in the present study (Figure 2).
Our previous analysis with the same population data on
several autosomes, identified significant QTL for daily
feed intake for growth periods 60–90 kg on SSC6 and
SSC10, 90–120 kg on SSC6 and 120–140 kg on SSC2
[27,16]. Pietrain alleles were associated with decreased
feed intake at 60–90 kg (SSC10), as expected for a breed,
which has been intensively selected for lean content
[32,33]. However, the Pietrain alleles (cryptic) at the SSCX
QTL are associated with a 102 g higher feed intake at 120–
140 kg. This is unexpected, as the Pietrain breed is well
known for its low feed intake capacity. Within the same
marker bracket (SW2456-SW259), Cepica et al. [24] have
reported a QTL for food consumption in a population
derived from a cross between wild Boar and Meishan.
Imprinting can be analyzed only in the pseudoautosomal
region of the X chromosome, where X and Y chromo-
somes are homologous. Imprinting analysis is important
to achieve a better understanding of the genetic control of
important traits and to uncover QTL, which cannot be
detected from an analysis considering only additive and
dominance effects. In the present study, the QTL for entire
loin weight showed paternal imprinting indicating that
only the maternal allele is expressed at this QTL. Moreo-
ver, a QTL for neck weight without external fat was identi-
fied, which was not detected in the analysis without
imprinting modelling. At this QTL, maternal imprinting
was identified indicating that only the paternal allele is
expressed. To the best of our knowledge, there is no infor-
mation in the literature, reporting imprinting within the
pseudoautosomal region of SSCX.
Genetics Selection Evolution 2009, 41:27 />Page 8 of 9
(page number not for citation purposes)
The literature is sparse for QTL on chromosome X in other
livestock species. In cattle and sheep, no QTL have been
reported for similar traits on the X chromosome. In cattle,
only four QTL have been reported on the X chromosome
for reproduction and disease resistance traits [34,35] and
in sheep a single QTL has been reported for parasite resist-
ance [36]. There is limited evidence for QTL affecting pro-
duction traits in these species and more effort is needed to
detect such QTL. Unlike in mammals, in chickens sex
determination operates through a ZZ/ZW sex chromo-
some system in which females represent the heteroga-
metic sex (ZW) and males the homogametic sex (ZZ) [37].
A large number of QTL for production traits have been
identified on the Z sex chromosome e.g. [38-41].
Conclusion
The results of the present study indicate that pig chromo-
some X is involved in the genomic regulation of physical
and chemical body composition as well as growth and
feed intake. Our previous analysis of the same data set
over several autosomes [27,16] detected a larger number
of significant QTL, indicating that the role of SSCX is
probably less important in the regulation of economically
important traits in pig production than that of autosomes.
However, the QTL found on SSCX did account for similar
proportions of the phenotypic variance. In summary, the
present results on sex-linked QTL in pigs give more insight
into the sex related genomic regulation of these traits,
which may be based on different features from those on
autosomal chromosomes.
Competing interests
The authors declare that they have no competing interests.
Authors' contributions
CAD performed the data analysis, wrote and prepared the
manuscript for submission. RR was the principle supervi-
sor of the study and assisted with preparation of the man-
uscript. GS, ADW, EK and PWK co-supervised the study
and reviewed the manuscript. MPE provided assistance
with the data analysis and reviewed the manuscript. All
authors read and approved the final manuscript.
Additional material
Acknowledgements
The authors are grateful for financial support from BBSRC, PIC, Genesis
Faraday and Deutsche Forschungsgemeinschaft (DFG). The authors would
also like to acknowledge Dr Mike Coffey for his invaluable assistance with
the computer program.
References
1. Geldermann H, Muller E, Moser G, Reiner G, Bartenschlager H,
Cepica S, Stratil A, Kuryl J, Moran C, Davoli R, Brunsch C: Genome-
wide linkage and QTL mapping in porcine F-2 families gen-
erated from Pietrain, Meishan and Wild Boar crosses. J Anim
Breed Genet 2003, 120:363-393.
2. Milan D, Bidanel JP, Iannuccelli N, Riquet J, Amigues Y, Gruand J, Le
Roy P, Renard C, Chevalet C: Detection of quantitative trait loci
for carcass composition traits in pigs. Genet Sel Evol 2002,
34:705-728.
3. Rohrer GA, Keele JW: Identification of quantitative trait loci
affecting carcass composition in swine: I. Fat deposition
traits. J Anim Sci 1998, 76(9):2247-2254.
4. Rohrer GA, Keele JW: Identification of quantitative trait loci
affecting carcass composition in swine: II. Muscling and
wholesale product yield traits. J Anim Sci 1998, 76:2255-2262.
5. Graves JAM: Sex chromosome specialization and degenera-
tion in mammals. Cell 2006, 124:901-914.
6. Graves JAM, Koina E, Sankovi CN: How the gene content of
human sex chromosomes evolved. Curr Opin Genet Dev 2006,
16:219-224.
7. Hubbard TJP, Aken BL, Beal K, Ballester B, Caccamo M, Chen Y,
Clarke L, Coates G, Cunningham F, Cutts T, Down T, Dyer SC, Fit-
zgerald S, Fernandez-Banet J, Graf S, Haider S, Hammond M, Herrero
J, Holland R, Howe K, Howe K, Johnson N, Kahari A, Keefe D,
Kokocinski F, Kulesha E, Lawson D, Longden I, Melsopp C, Megy K,
et al.: Ensembl 2007. Nucleic Acids Res 2007, 35:D610-D617.
8. Alberts B, Johnson A, Lewis J, Raff M, Roberts K, Walter P: The molec-
ular biology of the cell 4th edition. New York: Garland Science, Taylor
& Francis Group; 2002.
9. Heard E, Disteche CM: Dosage compensation in mammals:
fine-tuning the expression of the X chromosome. Genes Dev
2006, 20:1848-1867.
10. Graves JAM, Wakefield MJ, Toder R: The origin and evolution of
the pseudoautosomal regions of human sex chromosomes.
Hum Mol Genet 1998, 7:1991-1996.
11. de Koning DJ, Rattink AP, Harlizius B, Groenen MAM, Brascamp EW,
van Arendonk JAM: Detection and characterization of quanti-
tative trait loci for growth and reproduction traits in pigs.
Livest Prod Sci 2001, 72:185-198.
12. Knott SA, Marklund L, Haley CS, Andersson K, Davies W, Ellegren H,
Fredholm M, Hansson I, Hoyheim B, Lundstrom K, Moller M, Anders-
son L: Multiple marker mapping of quantitative trait loci in a
cross between outbred wild boar and large white pigs. Genet-
ics 1998, 149(2):1069-1080.
13. Perez-Enciso M, Misztal I: Qxpak: a versatile mixed model appli-
cation for genetical genomics and QTL analyses. Bioinformatics
2004, 20:2792-2798.
14. Landgraf S, Susenbeth A, Knap PW, Looft H, Plastow G, Kalm E,
Roehe R: Developments of carcass cuts, organs, body tissues
and chemical body composition during growth of pigs. Anim
Sci 2006, 82:889-899.
15. Landgraf S, Susenbeth A, Knap PW, Looft H, Plastow GS, Kalm E,
Roehe R: Allometric association between in vivo estimation
of body composition during growth using deuterium dilution
Additional File 1
Table S1. Means and standard deviations (SD) of carcass characteristics,
chemical body composition, accretion rates, daily gain, daily feed intake
and food conversion ratio measured on pigs of the F
2
generation.
Click here for file
[ />9686-41-27-S1.doc]
Additional File 2
Table S2. Phenotypic correlations between the traits for which QTL effects
were detected.
Click here for file
[ />9686-41-27-S2.doc]
Publish with Bio Med Central and every
scientist can read your work free of charge
"BioMed Central will be the most significant development for
disseminating the results of biomedical research in our lifetime."
Sir Paul Nurse, Cancer Research UK
Your research papers will be:
available free of charge to the entire biomedical community
peer reviewed and published immediately upon acceptance
cited in PubMed and archived on PubMed Central
yours — you keep the copyright
Submit your manuscript here:
/>BioMedcentral
Genetics Selection Evolution 2009, 41:27 />Page 9 of 9
(page number not for citation purposes)
technique and chemical analysis of serial slaughtered pigs.
Anim Sci 2006, 82:223-231.
16. Mohrmann M, Roehe R, Knap PW, Looft H, Plastow GS, Kalm E:
Quantitative trait loci associated with AutoFOM grading
characteristics, carcass cuts and chemical body composition
during growth of Sus scrofa. Anim Genet 2006, 37:435-443.
17. Mohrmann M, Roehe R, Susenbeth A, Baulain U, Knap PW, Looft H,
Plastow GS, Kalm E: Association between body composition of
growing pigs determined by magnetic resonance imaging,
deuterium dilution technique and chemical analysis. Meat Sci
2006, 72:518-531.
18. Brondum J, Egebo M, Agerskov C, Busk H: On-line pork carcass
grading with the autofom ultrasound system. J Anim Sci 1998,
76(7):1859-1868.
19. USDA: Swine Genome Mapping Project. 2007 [http://
www.ars.usda.gov/Main/docs.htm?docid=12552]. Accessed: April
2007
20. Green P, Falls k, Crooks S: Documentation for CRIMAP, version
2.4. Washington University School of Medicine, St Louis; 1990.
21. Perez-Enciso M, Clop A, Noguera JL, Ovilo C, Coll A, Folch JM, Babot
D, Estany J, Oliver MA, Diaz I, Sanchez A: A QTL on pig chromo-
some 4 affects fatty acid metabolism: Evidence from an Ibe-
rian by Landrace intercross. J Anim Sci 2000, 78:2525-2531.
22. Lander ES, Botstein D: Mapping mendelian factors underlying
quantitative traits using RFLP linkage maps. Genetics 1989,
121(1):185-199.
23. Perez-Enciso M, Clop A, Folch JM, Sanchez A, Oliver MA, Ovilo C,
Barragan C, Varona L, Noguera JL: Exploring alternative models
for sex-linked quantitative trait loci in outbred populations:
Application to an Iberian X Landrace pig intercross. Genetics
2002, 161(4):1625-1632.
24. Cepica S, Reiner G, Bartenschlager H, Moser G, Geldermann H:
Linkage and QTL mapping for Sus scrofa chromosome X. J
Anim Breed Genet 2003, 120:144-151.
25. Bidanel JP, Milan D, Iannuccelli N, Amigues Y, Boscher MY, Bourgeois
F, Caritez JC, Gruand J, Le Roy P, Lagant H, Quintanilla R, Renard C,
Gellin J, Ollivier L, Chevalet C: Detection of quantitative trait
loci for growth and fatness in pigs. Genet Sel Evol 2001,
33:289-309.
26. Perez-Enciso M, Mercade A, Bidanel JP, Geldermann H, Cepica S, Bar-
tenschlager H, Varona L, Milan D, Folch JM: Large-scale, multi-
breed, multitrait analyses of quantitative trait loci
experiments: The case of porcine X chromosome. J Anim Sci
2005, 83:2289-2296.
27. Duthie C, Simm G, Doeschl-Wilson A, Kalm E, Knap PW, Roehe R:
Quantitative trait loci for chemical body composition traits
in pigs and their positional associations with body tissues,
growth and feed intake. Anim Genet 2008, 39:130-140.
28. Rohrer GA, Thallman RM, Shackelford S, Wheeler T, Koohmaraie M:
A genome scan for loci affecting pork quality in a Duroc-Lan-
drace F-2 population. Anim Genet 2005, 37:17-27.
29. Cepica S, Bartenschlager H, Geldermann H: Mapping of QTL on
chromosome X for fat deposition, muscling and growth
traits in a wild boar – Meishan F2 family using a high-density
gene map. Anim Genet 2007, 38(6):634-638.
30. Cepica S, Masopust M, Knoll A, Bartenschlager H, Yerle M, Rohrer
GA, Geldermann H: Linkage and RH mapping of 10 genes to a
QTL region for fatness and muscling traits on pig chromo-
some X.
Anim Genet 2006, 37:603-604.
31. Mercade A, Estelle J, Perez-Enciso M, Varona L, Silio L, Noguera JL:
Characterization of the porcine acyl-CoA synthetase long-
chain 4 gene and its association with growth and meat qual-
ity traits. Anim Gene 2006, 37:219-224.
32. Roehe R: Molecular and quantitative genetic determination
of protein and lipid deposition during growth of pigs. In Pro-
ceedings of the 8th World Congress on Genetics Applied to Livestock Pro-
duction: 13–18 August 2006 CD-ROM Communication; 2006:13-06.
33. Roehe R, Plastow GS, Knap PW: Quantitative and molecular
genetic determination of protein and fat deposition. Homo
2003, 54:119-131.
34. Kuhn C, Bennewitz J, Reinsch N, Xu N, Thomsen H, Looft C, Brock-
mann GA, Schwerin M, Weimann C, Hiendieder S, Erhardt G, Med-
jugorac I, Forster M, Brenig B, Reinhardt F, Reents R, Russ I, Averdunk
G, Blumel J, Kalm E: Quantitative trait loci mapping of func-
tional traits in the German Holstein cattle population. J Dairy
Sci 2003, 86:360-368.
35. Zhang C, de Koning DJ, Hernandez-Sanchez J, Haley CS, Williams JL,
Wiener P: Mapping of multiple quantitative trait loci affecting
bovine spongiform encephalopathy. Genetics 2004,
167:1863-1872.
36. Beraldi D, Mcrae AF, Gratten J, Pilkington JG, Slate J, Visscher PM,
Pemberton JM: Quantitative trait loci (QTL) mapping of resist-
ance to strongyles and coccidia in the free-living Soay sheep
(Ovis aries). Int J Parasitol 2007, 37:121-129.
37. Ellegren H: Evolution of the avian sex chromosomes and their
role in sex determination. Trends Ecol Evol 2000, 15:188-192.
38. Ikeobi CON, Woolliams JA, Morrice DR, Law A, Windsor D, Burt
DW, Hocking PM: Quantitative trait loci for meat yield and
muscle distribution in a broiler layer cross. Livest Prod Sci 2004,
87:143-151.
39. Kerje S, Carlborg O, Jacobsson L, Schutz K, Hartmann C, Jensen P,
Andersson L: The twofold difference in adult size between the
red junglefowl and White Leghorn chickens is largely
explained by a limited number of QTLs. Anim Genet 2003,
34:264-274.
40. Sasaki O, Odawara S, Takahashi H, Nirasawa K, Oyamada Y,
Yamamoto R, Ishii K, Nagamine Y, Takeda H, Kobayashi E, Furukawa
T: Genetic mapping of quantitative trait loci affecting body
weight, egg character and egg production in F2 intercross
chickens. Anim Genet 2004, 35:188-194.
41. Zhou H, Deeb N, Evock-Clover CM, Ashwell CM, Lamont SJ:
Genome-wide linkage analysis to identify chromosomal
regions affecting phenotypic traits in the chicken. II. Body
composition. Poult Sci 2006, 85(10):1712-1721.