Báo cáo sinh học: " Introgression of a major QTL from an inferior into a superior population using genomic selection" pdf
Bạn đang xem bản rút gọn của tài liệu. Xem và tải ngay bản đầy đủ của tài liệu tại đây (1.68 MB, 10 trang )
BioMed Central
Page 1 of 10
(page number not for citation purposes)
Genetics Selection Evolution
Open Access
Research
Introgression of a major QTL from an inferior into a superior
population using genomic selection
Jørgen Ødegård*
1,2
, Anna K Sonesson
1
, M Hossein Yazdi
2
and
Theo HE Meuwissen
2
Address:
1
Nofima Marine, PO Box 5010 NO-1432, Ås, Norway and
2
Department of Animal and Aquacultural Sciences, Norwegian University of
Life Sciences, PO Box 5003, NO-1432, Ås, Norway
Email: Jørgen Ødegård* - ; Anna K Sonesson - ; M
Hossein Yazdi - ; Theo HE Meuwissen -
* Corresponding author
Abstract
Background: Selection schemes aiming at introgressing genetic material from a donor into a
recipient line may be performed by backcross-breeding programs combined with selection to
preserve the favourable characteristics of the donor population. This stochastic simulation study
investigated whether genomic selection can be effective in preserving a major quantitative trait
locus (QTL) allele from a donor line during the backcrossing phase.
Methods: In a simulation study, two fish populations were generated: a recipient line selected for
a production trait and a donor line characterized by an enhanced level of disease resistance. Both
traits were polygenic, but one major QTL affecting disease resistance was segregating only within
the donor line. Backcrossing was combined with three types of selection (for total merit index)
among the crossbred individuals: classical selection, genomic selection using genome-wide dense
marker maps, and gene-assisted genomic selection. It was assumed that production could be
observed directly on the selection candidates, while disease resistance had to be inferred from
tested sibs of the selection candidates.
Results: Classical selection was inefficient in preserving the target QTL through the backcrossing
phase. In contrast, genomic selection (without specific knowledge of the target QTL) was usually
effective in preserving the target QTL, and had higher genetic response to selection, especially for
disease resistance. Compared with pure genomic selection, gene-assisted selection had an
advantage with respect to disease resistance (28–40% increase in genetic gain) and acted as an extra
precaution against loss of the target QTL. However, for total merit index the advantage of gene-
assisted genomic selection over genomic selection was lower (4–5% increase in genetic gain).
Conclusion: Substantial differences between introgression programs using classical and genomic
selection were observed, and the former was generally inferior with respect to both genetic gain
and the ability to preserve the target QTL. Combining genomic selection with gene-assisted
selection for the target QTL acted as an extra precaution against loss of the target QTL and gave
additional genetic gain for disease resistance. However, the effect on total merit index was limited.
Published: 27 July 2009
Genetics Selection Evolution 2009, 41:38 doi:10.1186/1297-9686-41-38
Received: 12 January 2009
Accepted: 27 July 2009
This article is available from: />© 2009 Ødegård et al; licensee BioMed Central Ltd.
This is an Open Access article distributed under the terms of the Creative Commons Attribution License ( />),
which permits unrestricted use, distribution, and reproduction in any medium, provided the original work is properly cited.
Genetics Selection Evolution 2009, 41:38 />Page 2 of 10
(page number not for citation purposes)
Background
In domesticated populations, specific traits of interest
may be improved through introgression of genes from a
donor line favourable with respect to a trait of interest
(e.g., a wild population resistant to a specific disease).
However, the donor line is often inferior with respect to
other traits included in the breeding objective of the recip-
ient line (e.g., production), which hampers crossbreeding.
Introgression schemes may be carried out through a back-
cross breeding program aimed at introgressing a single
gene from the donor line into the genomic background of
a recipient line, where molecular markers can be used to
assess the presence of the introgressed gene [1]. Successful
marker-assisted introgression programs have been con-
ducted, using markers linked to known QTL positions
[2,3]. An alternative strategy to traditional introgression
schemes is to combine introgression and QTL detection
into a single step [4]. An even simpler approach is to com-
bine introgression with a genomic selection program [5],
where individuals are selected based on estimated marker
effects distributed over the entire genome. Hence, within-
strain selection for desired alleles from both lines may be
initiated directly on the F1 crossbreds avoiding loss of
time on initial QTL detection studies.
In a previous simulation study [6], genetic material was
introgressed from a donor line (inferior with respect to
production, but superior with respect to disease resist-
ance), into a recipient line (superior with respect to pro-
duction, but inferior with respect to disease resistance),
assuming that both traits were controlled by many QTL.
The results indicated that, compared with pure breeding,
an introgression program using genomic selection pro-
duces a more resistant and economically competitive
crossbred population within relatively few generations [3-
5]. Therefore, introgression combined with genomic
selection was suggested as a tool for introgressing genetic
material from inferior donor lines into recipient popula-
tions. The current study is an extension of the previous
study, taking a major QTL into consideration.
Typical introgression programs, aim at introgressing one
or more alleles of interest from the donor line, while
simultaneously reducing the amount of donor DNA to a
minimum. Here, genomic selection will not necessarily
reduce the amount of donor DNA, but should lead to an
increase of the frequency of favourable alleles, irrespective
of their origin [6]. In simulated introgression schemes,
Groen and Smith [7] have concluded that selection for
genomic similarity to the recipient line is less efficient
than selection for phenotype. In the current study, indi-
viduals are selected based on total genetic value, summed
over all markers (irrespective of origin). Hence, any
favourable allele from the donor line may be introgressed.
Introgression of major QTL alleles is therefore likely,
although not assured. This strategy is particularly relevant
when (major) QTL are not known prior to selection.
The aim of this study was to investigate whether genomic
selection methods [5] can be used to introgress a major
QTL allele through a backcrossing program in a situation
where both the location and the effect of the QTL alleles
are unknown, and when the trait is also affected by
numerous minor genes. The genomic selection schemes
was compared with classical selection schemes without
the use of any genomic information and schemes using
genomic selection for minor QTL combined with gene-
assisted selection for the major QTL. The latter alternative
can be seen as a best-case scenario for introgression of spe-
cific QTL alleles of interest.
Methods
The selection experiment was designed to use genetic
resources from two partially separated populations. Gen-
erally, two fish populations were simulated as in Ødegård
et al. [6]. The common base population was generated and
mated randomly with replacement for 10,000 generations
(effective population size N
e
= 1000), subsequently the
base population was randomly split into two equally
sized (N
e
= 1000) subpopulations, which were kept sepa-
rate for the following 250 generations. Finally, for 10 gen-
erations, one population (recipient line) was
phenotypically selected for a production trait (PT), with a
heritability of 0.1, by selecting the top 10% of males and
top 10% of females. The other population (donor line)
was randomly selected with replacement (random 10% of
the males and females). The purpose of the separation
period was to generate two partially differentiated popu-
lations that were at different genetic levels for important
traits. A single major QTL for disease resistance (DR) was
assumed to segregate only within the donor line. Ran-
domly selected sires and dams from the resulting two lines
were then used as parents for two lines; one purebred
recipient line selected for PT only (PRL = production line)
and an F1 cross in the following selection experiment over
five generations (S1 to S5). Different replicates were sim-
ulated separately, but the initial generation (S0) was iden-
tical for all scenarios within each replicate.
Selection
Two selection strategies were used for generations S1 – S5:
1) Pure breeding of the recipient line for backcrossing for
a breeding objective including only one production trait
(PT), i.e., a production line (PRL), which represents an
external commercial population included in a classical
selection program for improved production, and 2) an
introgression strategy by creating F1 crossbreds of recipi-
ent and donor lines, followed by repeated backcrossing to
the PRL, i.e., a BACKCROSS line. Backcrossing was done
only to the extent that females from the PRL were superior
Genetics Selection Evolution 2009, 41:38 />Page 3 of 10
(page number not for citation purposes)
to females recruited from within the crossbred population
based on their EBV for total merit index (TMI), i.e.,
females were selected among all candidates in both popu-
lations, while males were selected within the crossbred
population only.
For generations S0 to S5, all lines were kept at a constant
size of 1000 breeding candidates within each line. For the
parents of S0, random selection and mating using sam-
pling with replacement was applied, while, for the later
generations, truncation selection based on predicted EBV
was used (50 sires and 50 dams per line). The selected
sires and dams were randomly mated (using sampling
with replacement) to create 50 full-sib families with 20
offspring each to form selection candidates for the next
generation for each line. Additionally, all 50 families
within the BACKCROSS line each produced 20 offspring,
which were used in sib-testing for DR.
Genome structure
The genome structure in this simulation was identical to
that of Ødegård et al. [6], i.e., with 10 diploid 100 cM
chromosomes assuming the Haldane mapping function
and a Mendelian inheritance of all loci. For each chromo-
some, 500 marker loci were assumed, as well as 100 QTL
per trait (PT and DR). Markers and QTL loci were ran-
domly spaced throughout each chromosome. Rates of
mutations (per allele and meiosis for each generation) for
marker and QTL alleles were 0.0001 and 0.00001, respec-
tively. Mutation rates at markers were increased to ensure
that most markers were segregating. All mutations gener-
ated new alleles, and thus, all loci were potentially multi-
allelic. The QTL allelic effects were assumed to be additive,
and were sampled from a gamma distribution (shape and
scale parameters of 0.40 and 0.13, respectively). Since this
distribution only produces positive values, each QTL
allelic effect had a 50% probability of being switched to a
negative value. No pleiotropy was assumed, implying zero
genetic covariance between the traits before selection. At
generation t = 10,250 (10,000 + 250), QTL effects of both
traits were scaled to achieve identical background genetic
standard deviations (= 1.0) for both traits within the
recipient line for all replicates (before selection). Scaling
of QTL effects was identical for all individuals, irrespective
of population.
At generation t = 10,260 (10,000 + 250 + 10), ~80% of the
marker loci and ~15% of the QTL were segregating within
each subpopulation. Linkage disequilibrium between
adjacent markers was calculated as the standardized chi-
square,
χ
2
' [8,9]. Within each base population, average
calculated and expected [10] LD for adjacent markers
(expectation based on actual distance) were both 0.2.
At generation S0 of the selection experiment, genomes of
all individuals were scanned to identify bi-allelic QTL
affecting DR, where one of the alleles happened to be
fixed in the recipient line, but an alternative allele existed
in the donor line. The QTL displaying the largest differ-
ence in allele frequencies between the lines was assumed
to be a major QTL. The favourable allele (the allele absent
in the recipient line) was given a genotypic value [11] of a
= 2.0 (twice the background genetic standard deviation),
while the genotypic value of the alternative allele was a =
-2.0.
Data
As in the study by Ødegård et al[6]., the true breeding
value of an individual was defined as the sum of QTL
allelic effects for the individual across all 1000 QTL loci
for each trait. Phenotypes of both traits were produced by
adding normally distributed error terms, sampled from
N(0, ), to the true breeding values of each individual.
Heritabilities are presented as the following:
where is the (background) additive genetic variance
(= 1.0 for both traits) within the original recipient line
(not segregating for the major QTL), and is the resid-
ual variance (= 9.0 for both traits). The resulting back-
ground heritability (not accounting for the major QTL)
was therefore 0.10 for both PT and DR. It was assumed
that all individuals within the BACKCROSS line were gen-
otyped for the available 5000 marker loci. The PT was
recorded on all selection candidates (1000 individuals per
line and generation), while disease resistance (DR) was
recorded on full-sibs of the selection candidates, using a
challenge-test type of design (1000 individuals per gener-
ation for the BACKCROSS line). For the PRL, only the
average genetic level of DR was assumed to be available.
Individuals challenge-tested for DR were not considered
as selection candidates.
Breeding value estimation
For comparison purposes, genomic (GBLUP), gene-
assisted genomic (GasGBLUP) and classical (CBLUP) EBV
were produced and used as selection criteria. The GBLUP
were estimated as in Ødegård et al. [6] using the BLUP esti-
mation procedure of marker effects [5]. Marker by base
population effects were estimated, i.e., all markers were
traced back to their original populations. For GasGBLUP,
the same method was used, but the effect of the major
QTL was assumed known in the breeding value estima-
tion. The CBLUP were estimated using classical BLUP
σ
e
2
h
a
ae
2
2
22
=
+
σ
σσ
σ
a
2
σ
e
2
Genetics Selection Evolution 2009, 41:38 />Page 4 of 10
(page number not for citation purposes)
[12]. The CBLUP of DR for selection candidates was calcu-
lated based on sib and pedigree data (including pheno-
types back to generation S0). The GBLUP and GasGBLUP
values were scaled by a factor b , in
order to make them directly comparable to CBLUP values.
All breeding values and the factor b were re-estimated for
each generation (the latter was based on all individuals
with genomic EBV across generations).
Scenarios
Backcrossing schemes were conducted for the different
selection criteria (using CBLUP, GBLUP and GasGBLUP).
Two sets of economic weights were used; either 100%
(2:1) (Scenario 1) or 50% (3:2) (Scenario 2) higher rela-
tive weight on PT compared with DR (Table 1). In the
crossbred population, selection was for total merit index
(TMI), with the selection criteria defined as the sum of
predicted breeding values for both traits, multiplied by
their corresponding economic weights. For all settings,
the PRL was selected for PT using only the CBLUP selec-
tion criterion.
Calculation of summary statistics
A total of 50 replicates were produced for each scenario
and selection scheme. Within each replicate, the average
frequency of the favourable major QTL allele and the aver-
age level of true breeding values (DR, PT and TMI) were
calculated, and subsequently averaged over all 50 repli-
cates. Genetic gains for PT, DR and TMI were calculated as
average differences in true genetic level from generation
S0 to S5. For comparison purposes, the expected fre-
quency of the target QTL given no selection (but identical
amounts of backcrossing) was calculated as the expected
genetic contribution of the donor population (based on
pedigree) multiplied with the original frequency of the
favourable target allele in the donor population.
Results
At generation S0, the average genetic differences (in back-
ground genetic standard deviations) between the recipient
(PRL) and the F1 crossbred populations were 2.5 and -0.4
for PT and DR, respectively (difference in DR mainly due
to the major QTL). Consequently, TMI differed for the two
populations. Assuming 100% higher economic weight for
PT (economic weights 2:1), the average difference in TMI
was 2.1 genetic standard deviations, and 1.9 genetic
standard deviations, assuming 50% higher economic
weight for PT (economic weights 3:2). The initial fre-
quency of the favourable major QTL allele was 0% in the
PRL (recipient) line and, on average, 23% in the F1 BACK-
CROSS population.
Scenario 1: ratio of economic weights for PT and DR 2:1
Genetic levels by generation for PT, DR and TMI are
shown in Figure (1a, b and 1c, respectively) and genetic
gains (from S0 to S5) are shown in Table 2. As in Ødegård
et al. [6], genomic selection was in general favourable
compared with classical selection. With respect to DR (the
trait affected by the major QTL), there were substantial
differences in genetic gain between the alternatives using
classical selection (CBLUP) and those using genomic
selection (GBLUP and GasGBLUP). As a result of repeated
backcrossing with the PRL, no significant genetic gain for
DR was achieved through CBLUP. However, substantial
genetic gain was achieved when using genomic selection,
both as a result of the more efficient within-line selection
and as a result of less sustained backcrossing with the PRL.
As expected, genetic gain in DR was the highest with Gas-
GBLUP (increase by 40%, compared with GBLUP). The
selection methods differed much less with respect to
genetic gain for PT, i.e., selection for improved PT was
about as efficient using genomic or classical selection (-
1% and -2% for GBLUP and GasGBLUP, respectively)
despite more backcrossing with PRL under classical selec-
tion. Consequently, genetic gain in TMI was higher for
genomic than for classical selection (13 and 18% increase
for GBLUP and GasGBLUP, respectively). The relatively
=
(
)
Cov TBV EBV
Var EBV
(,)
()
Table 1: Description of the selection schemes
Scenario Population structure Selection criteria EW PT EW DR
1 PRL CBLUP 1 0
BACKCROSS CBLUP 2 1
BACKCROSS GBLUP 2 1
BACKCROSS GasGBLUP 2 1
2 PRL CBLUP 1 0
BACKCROSS CBLUP 3 2
BACKCROSS GBLUP 3 2
BACKCROSS GasGBLUP 3 2
PT = production trait, DR = disease resistance, EW = relative economic weight, assuming equal genetic variance for the two traits
Genetics Selection Evolution 2009, 41:38 />Page 5 of 10
(page number not for citation purposes)
limited advantage of GasBLUP over GBLUP with respect
to genetic gain in TMI (4%) can be explained by the high
relative economic weight of PT.
The frequencies of the favourable major QTL allele by gen-
eration are shown in Figure 2 (single replicates and aver-
age level). In the introgression schemes using classical
selection (CBLUP), backcrossing with the PRL line was
continued throughout the entire selection experiment,
and average expected frequency of "neutral" donor alleles
(based on pedigree) was therefore as low as 4% at genera-
tion S5 (Figure 2a). Consequently, average frequency of
the favourable major QTL allele also dropped from 23%
at generation S0 to 4% in generation S5, and ended up as
lost in 27 out of 50 replicates (Figure 2a). For the intro-
gression schemes using genomic selection (GBLUP/GasG-
BLUP), backcrossing with the PRL mainly occurred up to
generation S2, and the expected frequency of "neutral"
donor alleles in the GBLUP/GasGBLUP alternatives thus
stabilized at, respectively, 15 and 16% towards the end of
the selection experiment (Figure 2b and 2c). Using
GBLUP, the average frequency of the favourable allele for
the major QTL dropped from 23% at generation S0 to
11% at generation S2 (Figure 2b), as a result of backcross-
ing with PRL. Using GasGBLUP, the frequency of the
favourable major QTL allele was stable for S0 to S2 (Figure
2c). However, as a result of genomic/gene-assisted selec-
tion within the crossbred population, the average fre-
quency of the major QTL increased from S2 and onwards
for both GBLUP and GasGBLUP (to respectively 32% and
81% in generation S5). The favourable QTL allele was
never lost using GasGBLUP, but it was lost in 6 out of 50
replicates using GBLUP.
Scenario 2: ratio of economic weights for PT and DR 3:2
Genetic gains (from S0 to S5) are shown in Table 2. Gen-
erally, ranking of selection schemes was similar to that in
Scenario 1, with the largest differences in genetic gain
observed for DR, and the smaller differences in genetic
gain observed for PT. Again, genomic selection increased
genetic gain for TMI compared with classical selection (16
and 22% for GBLUP and GasGBLUP, respectively). Clas-
sical selection led to substantial backcrossing, and the
expected amount of "neutral" donor alleles was therefore
as low as 5% in generation S5 (Figure 3a), and had a lim-
ited effect on the frequency of the favourable major QTL,
reaching an average frequency of 5% in generation S5,
while being lost in 29 out of 50 replicates (Figure 3a).
Compared with GBLUP, GasGBLUP selection was supe-
rior with respect to genetic gain in DR (28%), slightly infe-
rior with respect to genetic gain in PT (-1%) and slightly
superior with respect to genetic gain in TMI (5%). Again,
backcrossing with the PRL mainly occurred up to genera-
tion S2 in both GBLUP and GasGBLUP selection schemes,
and the expected frequency of "neutral" donor alleles sta-
bilized at 17% and 18%, respectively (Figure 3b and 3c).
For the GBLUP selection scheme, the frequency of the
favourable major QTL allele followed the same pattern as
in the scenario above (Figure 2b), although the initial
drop (from S0 to S2) in the average frequency of the
favourable major QTL allele was smaller (from 23 in S0 to
13% in S2), as expected through reduced backcrossing.
For the GasGBLUP selection scheme (Figure 3c), the fre-
quency of the favourable major QTL allele increased
throughout the entire selection experiment, but most
markedly after generation S2, where backcrossing had
essentially ceased. The average end-frequency of the
favourable major QTL allele (at S5) was 43% and 93%, for
GBLUP and GasGBLUP schemes, respectively. Again, the
favourable allele was never lost using GasGBLUP, but it
was lost in 5 out of 50 replicates for GBLUP.
Discussion
The results of this study clearly show that genomic selec-
tion can to a large extent identify relevant DNA segments
for both traits and use this information in selection, while
classical selection has a limited effect on alleles affecting
Table 2: Average genetic gains from generation S0 to S5 of the different selection schemes for production trait (PT), disease
resistance (DR) and total merit index (TMI).
Scenario Population structure Selection criteria Genetic gain PT Genetic gain DR Genetic gain TMI
1 PRL CBLUP 3.12 (0.10) -0.04 (0.07) 2.78 (0.09)
BACKCROSS CBLUP 5.61 (0.17) 0.01 (0.11) 5.02 (0.16)
BACKCROSS GBLUP 5.56 (0.19) 1.59 (0.13) 5.69 (0.14)
BACKCROSS GasGBLUP 5.49 (0.18) 2.24 (0.12) 5.91 (0.14)
2 PRL CBLUP 3.12 (0.10) -0.04 ((0.07) 2.78 (0.09)
BACKCROSS CBLUP 5.44 (0.17) 0.32 (0.11) 4.71 (0.13)
BACKCROSS GBLUP 5.15 (0.19) 2.14 (0.12) 5.48 (0.13)
BACKCROSS GasGBLUP 5.09 (0.17) 2.73 (0.09) 5.75 (0.13)
All genetic gains are measured in Background genetic standard deviations with standard errors given in parentheses
PT = production trait, DR = disease resistance, EW = relative economic weight, assuming equal genetic variance for the two traits
Genetics Selection Evolution 2009, 41:38 />Page 6 of 10
(page number not for citation purposes)
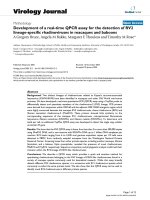
Genetic levels for a) production trait (PT), b) disease resistance (DR) and c) total merit index (TMI) by generation for the dif-ferent selection schemes under scenario 1; the selection schemes presented are; PRL, BACKCROSS CBLUP (BCL), BACK-CROSS GBLUP (BGL) and BACKCROSS gene-assisted GBLUP (BGGL)Figure 1
Genetic levels for a) production trait (PT), b) disease resistance (DR) and c) total merit index (TMI) by gener-
ation for the different selection schemes under scenario 1; the selection schemes presented are; PRL, BACK-
CROSS CBLUP (BCL), BACKCROSS GBLUP (BGL) and BACKCROSS gene-assisted GBLUP (BGGL).
Genetics Selection Evolution 2009, 41:38 />Page 7 of 10
(page number not for citation purposes)
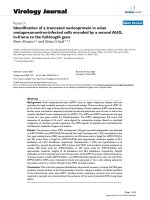
Allele frequencies of the favourable allele of the major QTL for the BACKCROSS selection scheme under a) classical (CBLUP), b) genomic (GBLUP), and c) gene-assisted genomic (GasGBLUP) selection in Scenario 1Figure 2
Allele frequencies of the favourable allele of the major QTL for the BACKCROSS selection scheme under a)
classical (CBLUP), b) genomic (GBLUP), and c) gene-assisted genomic (GasGBLUP) selection in Scenario 1.
Single dots represent individual replicates, red line average observed frequencies of the target QTL, purple line expected fre-
quencies if the target QTL is not subject to selection and green line expected frequencies of "neutral" donor alleles.
Genetics Selection Evolution 2009, 41:38 />Page 8 of 10
(page number not for citation purposes)
Allele frequencies of the favourable allele of the major QTL for the BACKCROSS selection scheme under a) classical (CBLUP), b) genomic (GBLUP), and c) gene-assisted genomic (GasGBLUP) selection in Scenario 2Figure 3
Allele frequencies of the favourable allele of the major QTL for the BACKCROSS selection scheme under a)
classical (CBLUP), b) genomic (GBLUP), and c) gene-assisted genomic (GasGBLUP) selection in Scenario 2.
Single dots represent individual replicates, red line average observed frequencies of the target QTL, purple line expected fre-
quencies if the target QTL is not subject to selection and green line expected frequencies of "neutral" donor alleles.
Genetics Selection Evolution 2009, 41:38 />Page 9 of 10
(page number not for citation purposes)
DR, even for a QTL of very large effect. Consequently,
backcrossing programs using GBLUP selection are far
more efficient in preserving and increasing frequencies of
such alleles, while for CBLUP selection programs these
alleles may easily be lost during the backcrossing process.
The advantage of genomic over classical selection with
respect to a major QTL for DR may be explained by two
main factors: 1) generally higher accuracy of selection for
GBLUP compared with CBLUP [5] and 2) for a trait solely
recorded on sibs of selection candidates, classical selec-
tion can only distinguish between families, while
genomic selection may distinguish between single indi-
viduals of different genotypes within families segregating
for the major QTL.
With respect to the major QTL, the most efficient selection
schemes were those combining genomic selection with
gene-assisted selection for the target QTL. However, the
relative advantage of GasBLUP relative to GBLUP selec-
tion was rather small with respect to genetic gain in TMI
(4–5%). In GBLUP selection, the favourable allele was
lost in a few replicates (5–6 out of 50), which never hap-
pened using GasGBLUP. Therefore, the results of this
study indicate that the main advantage of GasGBLUP
compared with GBLUP selection is that it acts as a precau-
tion against the loss of the favourable major QTL allele
during the early backcrossing phase. This is of special
importance if the allele of interest has a low frequency
within the donor population, and when the target QTL is
in unfavourable LD with other loci, since selection on the
target QTL would be detrimental for background genetic
effects. However, because of the latter, rapid introgression
of the major QTL is not necessarily a substantial advan-
tage. As long as the favourable allele of the target QTL is
preserved, it would most likely approach fixation in the
long run. Further, according to a study by Gibson [13],
less intense selection on a major QTL is likely to increase
the long-term genetic gain, implying that GBLUP selec-
tion is expected to be superior over GasGBLUP selection
in the long run, except for replicates where the favourable
QTL alleles were lost during the initial backcrossing proc-
ess. However, in Gibson's study, unfavourable LD
between the major QTL and the background genetic
effects were generated as a result of selection, while in our
case, such unfavourable relationships are present already
at the start of the selection experiment as a result of cross-
ing the two base populations, i.e., the positive QTL allele
is located on a donor chromosome segment that is more
likely to contain negative alleles with respect to PT. Thus,
in the current introgression scheme, substantial weight on
the target QTL is needed in order to avoid its loss, whereas
in Gibson's single population, risk of loss is low even if
the major QTL receives little weight.
In this study, the genotypic value of the major QTL
implies that this locus explains 2/3 of the total genetic var-
iance in DR within a population having an allele fre-
quency of 50% (assuming Hardy-Weinberg equilibrium).
The advantage of efficient introgression of the favourable
allele will increase with the effect of the allele and with the
economic weight of DR. However, for all selection meth-
ods, the efficiency of selection with respect to the target
QTL will also increase with the same factors. Preliminary
analyses using Scenario 2, showed that for a doubled gen-
otypic value of the target QTL, GasGBLUP selection only
slightly increased genetic gain for DR (7%) and hardly
increased genetic gain in TMI (1%), compared with
GBLUP selection (results not shown). Hence, the relative
advantage of gene-assisted selection is seemingly lower for
QTL of very large effect, since the favourable allele would
be preserved and effectively selected for even without
gene-assisted selection.
The GasGBLUP schemes require that knowledge on both
the exact position of the target QTL and its effect exists
prior to the selection experiment, in addition to a dense
marker map including segregating marker loci for both
populations. If this knowledge is readily available prior to
the experiment, the GasGBLUP method is naturally pre-
ferred. This can be considered a best-case scenario, but in
practical breeding schemes, these assumptions would
often be unrealistic. The GBLUP selection schemes do not
require prior knowledge about the target QTL, and are
therefore much easier to implement. An alternative
approach would be to do simultaneous QTL detection
and introgression as described in Yazdi et al. [4]. However,
the latter approach would be less efficient when applied to
complex traits affected by numerous QTL of varying
effects, while genomic selection is well suited to handle
this situation.
Due to computing time considerations, the BLUP method
of genomic selection was used. This method assumes
homogeneous genetic variance at all marker loci [5].
However, more advanced methods of genomic selection
are also available, i.e., the so-called BayesA and BayesB
methods [5]. Here, the genetic variance explained by each
marker locus is evaluated and different weights are
thereby given to different genomic regions in the EBV cal-
culation. Thus, these more advanced methods are
expected to be more effective in selecting QTL of major
importance, and the results of the current study should
therefore be considered as conservative. In a recent study
[14], where analyses were based on simulated crossbred
populations using the BayesB method, it was concluded
that fitting population-specific marker effects may not be
necessary, especially for high marker densities. However,
using the BLUP method, as in the current study, all mark-
ers are assumed to have effects of equal magnitude, not
Genetics Selection Evolution 2009, 41:38 />Page 10 of 10
(page number not for citation purposes)
only the markers in closest association with QTL (as in
BayesB). Hence, fitting population-specific markers may
be of more importance, since QTL effects are likely to be
attributed to a broader distribution of markers.
In previous stochastic simulation or deterministic studies
of introgression programs targeting a major QTL, donor
and recipient lines are often assumed to be unrelated and
fixed for alternative target QTL alleles [1,15,16]. For live-
stock and farmed fish, these assumptions are usually unre-
alistic, and provide idealized conditions for the
introgression programs. In the current study, the donor
and recipient lines were assumed to be only partially dif-
ferentiated, and the target QTL was chosen among loci
that happened to be segregating only within the donor
line (since this would make introgression necessary).
Hence, introgression of the major QTL would not be guar-
anteed by crossing the recipient line with a small sub-sam-
ple of individuals from the donor line, and one would
rarely have markers in perfect LD with the major QTL.
However, some simplified assumptions were made, i.e.,
the assumption of no pleiotropy, implying zero genetic
correlation (before selection) between disease resistance
and the production trait (e.g., growth). The latter is not
necessarily unrealistic, but the assumption of complete
absence of pleiotropic effects on all loci is most likely
over-simplified. Actually, numerous pleiotropic effects in
both directions (favourable/unfavourable) may underlie
a genetic correlation close to zero. However, under the
current assumption, different QTL for the two traits will
often be closely linked, which will have an effect that
resembles pleiotropic QTL. The practical consequences of
this assumption are thus likely to be limited. In our view,
the current method of simulation and (GBLUP) analysis
is rather realistic and conservative with respect to the pros-
pects for introgression schemes in livestock and farmed
fish populations.
Conclusion
There were substantial differences between introgression
programs using classical and genomic selection, with the
first being generally inferior with respect to both genetic
gain and the ability to preserve the target QTL. Combining
genomic selection with gene-assisted selection for the tar-
get QTL acted as an extra precaution against loss of the tar-
get QTL and gave additional genetic gain for disease
resistance. However, the effect on total merit index was
limited compared with genomic selection without specific
knowledge of the target QTL.
Competing interests
The authors declare that they have no competing interests.
Authors' contributions
JØ carried out the computer simulations and drafted the
manuscript. MHY participated in software programming.
AKS coordinated the project and helped to draft the man-
uscript. THEM participated in software programming and
helped to draft the manuscript. All authors participated in
the design of the study and read and approved the final
manuscript.
Acknowledgements
This study was funded by the Norwegian Research Council as a part of
project no. 165046 titled "Efficient combination of QTL detection and
introgression schemes in aquaculture". The computer simulations pre-
sented in this study were carried out on Titan, a LINUX cluster owned and
maintained by the University of Oslo and NOTUR. Helpful comments from
two anonymous reviewers are gratefully acknowledged.
References
1. Hospital F: Size of donor chromosome segments around
introgressed loci and reduction of linkage drag in marker-
assisted backcross programs. Genetics 2001, 158:1363-1379.
2. Bouchez A, Hospital F, Causse M, Gallais A, Charcosset A: Marker-
assisted introgression of favorable alleles at quantitative
trait loci between maize elite lines. Genetics 2002,
162:1945-1959.
3. Koudande OD, van Arendonk JA, Iraqi F: Marker-assisted intro-
gression of trypanotolerance QTL in mice. Mamm Genome
2005, 16:112-119.
4. Yazdi MH, Sonesson AK, Woolliams JA, Meuwissen THE: Combined
detection and introgression of quantitative trait loci under-
lying desirable traits. J Anim Sci 2008, 86:1089-1095.
5. Meuwissen TH, Hayes BJ, Goddard ME: Prediction of total
genetic value using genome-wide dense marker maps. Genet-
ics 2001, 157:1819-1829.
6. Ødegård J, Yazdi MH, Sonesson AK, Meuwissen THE: Incorporating
desirable genetic characteristics from an inferior into a supe-
rior population using genomic selection. Genetics 2009,
181:737-745.
7. Groen AF, Smith C: A stochastic simulation study of the effi-
ciency of marker-assisted introgression in livestock. Journal of
Animal Breeding and Genetics-Zeitschrift fur Tierzuchtung und Zuchtungs-
biologie 1995, 112:161-170.
8. Yamazaki T: Effects of overdominance on linkage in a multilo-
cus system. Genetics 1977, 86:227-236.
9. Heifetz EM, Fulton JE, O'Sullivan N, Zhao H, Dekkers JCM, Soller M:
Extent and consistency across generations of linkage disequi-
librium in commercial layer chicken breeding populations.
Genetics 2005, 171:1173-1181.
10. Sved JA: Linkage disequilibrium and homozygosity of chro-
mosome segments in finite populations. Theoretical Population
Biology 1971, 2:125-141.
11. Falconer DS, Mackay TFC: Introduction to quantitative genetics 4th edi-
tion. Longman Group Ltd; 1996.
12. Henderson CR: Applications of linear models in animal breeding Univer-
sity of Guelph; 1984.
13. Gibson JP: Short term gain at the expense of long-term
response with selection on identified loci. In Proceedings of the
5th world congress on genetics applied to livestock production University
of Guelph, Guelph, Ontario, Canada; 1994:201-204.
14. Ibanez-Escriche N, Fernando R, Toosi A, Dekkers J: Genomic selec-
tion of purebreds for crossbred performance. Genetics Selection
Evolution 2009, 41:12.
15. Visscher PM, Haley CS, Thompson R: Marker-assisted introgres-
sion in backcross breeding programs. Genetics 1996,
144:1923-1932.
16. Wall E, Visscher PM, Hospital F, Woolliams JA: Genomic contribu-
tions in livestock gene introgression programmes. Genet Sel
Evol 2005, 37:291-313.