báo cáo hóa học:" Identification of a biomarker panel using a multiplex proximity ligation assay improves accuracy of pancreatic cancer diagnosis" doc
Bạn đang xem bản rút gọn của tài liệu. Xem và tải ngay bản đầy đủ của tài liệu tại đây (1.19 MB, 12 trang )
BioMed Central
Page 1 of 12
(page number not for citation purposes)
Journal of Translational Medicine
Open Access
Research
Identification of a biomarker panel using a multiplex proximity
ligation assay improves accuracy of pancreatic cancer diagnosis
Stephanie T Chang
†1
, Jacob M Zahn
†2,3
, Joe Horecka
2,3
, Pamela L Kunz
5
,
JamesMFord
4,5
, George A Fisher
5
, Quynh T Le
1
, Daniel T Chang
1
,
Hanlee Ji
2,5
and Albert C Koong*
1
Address:
1
Department of Radiation Oncology, Stanford University School of Medicine, Stanford University, Stanford, CA, USA,
2
Stanford Genome
Technology Center, Stanford University School of Medicine, Stanford University, Stanford, CA, USA,
3
Department of Biochemistry, Stanford
University School of Medicine, Stanford University, Stanford, CA, USA,
4
Department of Genetics, Stanford University School of Medicine, Stanford
University, Stanford, CA, USA and
5
Department of Medicine, Division of Medical Oncology, Stanford University School of Medicine, Stanford
University, Stanford, CA, USA
Email: Stephanie T Chang - ; Jacob M Zahn - ; Joe Horecka - ;
Pamela L Kunz - ; James M Ford - ; George A Fisher - ;
Quynh T Le - ; Daniel T Chang - ; Hanlee Ji - ;
Albert C Koong* -
* Corresponding author †Equal contributors
Abstract
Background: Pancreatic cancer continues to prove difficult to clinically diagnose. Multiple
simultaneous measurements of plasma biomarkers can increase sensitivity and selectivity of
diagnosis. Proximity ligation assay (PLA) is a highly sensitive technique for multiplex detection of
biomarkers in plasma with little or no interfering background signal.
Methods: We examined the plasma levels of 21 biomarkers in a clinically defined cohort of 52
locally advanced (Stage II/III) pancreatic ductal adenocarcinoma cases and 43 age-matched controls
using a multiplex proximity ligation assay. The optimal biomarker panel for diagnosis was computed
using a combination of the PAM algorithm and logistic regression modeling. Biomarkers that were
significantly prognostic for survival in combination were determined using univariate and
multivariate Cox survival models.
Results: Three markers, CA19-9, OPN and CHI3L1, measured in multiplex were found to have
superior sensitivity for pancreatic cancer vs. CA19-9 alone (93% vs. 80%). In addition, we identified
two markers, CEA and CA125, that when measured simultaneously have prognostic significance
for survival for this clinical stage of pancreatic cancer (p < 0.003).
Conclusions: A multiplex panel assaying CA19-9, OPN and CHI3L1 in plasma improves accuracy
of pancreatic cancer diagnosis. A panel assaying CEA and CA125 in plasma can predict survival for
this clinical cohort of pancreatic cancer patients.
Published: 11 December 2009
Journal of Translational Medicine 2009, 7:105 doi:10.1186/1479-5876-7-105
Received: 5 September 2009
Accepted: 11 December 2009
This article is available from: />© 2009 Chang et al; licensee BioMed Central Ltd.
This is an Open Access article distributed under the terms of the Creative Commons Attribution License ( />),
which permits unrestricted use, distribution, and reproduction in any medium, provided the original work is properly cited.
Journal of Translational Medicine 2009, 7:105 />Page 2 of 12
(page number not for citation purposes)
Background
In 2008, the incidence of pancreatic cancer in the United
States was estimated to be more than 38,000, resulting in
more than 34,000 deaths per year [1]. Despite being a rel-
atively rare disease, pancreatic cancer is nevertheless the
fourth leading cause of cancer death in the United States
[2].
Despite the widespread use of aggressive combined
modality therapies, the overall 5-year survival for this dis-
ease remains less than 5%. Contributing to this high mor-
tality rate is the often late onset of clinical symptoms. The
majority of pancreatic cancer is diagnosed when metas-
tases have already occurred (microscopic and gross dis-
ease). Since surgical resection is the only therapy
associated with long-term survival, there is an urgent need
to diagnose patients at an earlier stage of disease when
removal of the primary tumor still has curative potential.
Issues complicating early diagnosis of pancreatic cancer
include the physical location of the pancreas, localized
deep within the abdominal cavity, and oftentimes non-
specific clinical symptoms such as general abdominal
pain, weight loss, and jaundice. Chronic pancreatitis, a
common disease encompassing inflammation of the pan-
creas, can present with identical symptoms. A blood-
based diagnostic test has the potential for circumventing
these confounding issues, thus enabling earlier detection
and increasing the probability of curative surgical treat-
ment.
Currently, carbohydrate antigen 19-9 (CA19-9) is the only
plasma marker routinely measured to make clinical deci-
sions pertaining to pancreatic cancer [3]. CA19-9 is most
often used to monitor recurrence in resected pancreatic
cancer patients as well as to gauge efficacy of chemother-
apy and radiotherapy in advanced cases. However, CA19-
9 is neither adequately sensitive nor specific enough to
make accurate diagnoses of pancreatic cancer based on the
results of a serological screening test [4]. CA19-9 is the sia-
lylated Lewis blood group antigen, and as such is not syn-
thesized in approximately 10% of the population [5].
Although a high plasma level of CA19-9 is suggestive of
pancreatic cancer in combination with clinical symptoms,
imaging studies are usually indicated before any biopsies
are undertaken. No other independently measured
plasma tumor marker has been shown to exceed CA19-9
in clinical utility.
A panel-based approach simultaneously measuring in
multiplex a combination of tumor markers that individu-
ally lack optimal sensitivity and specificity has the poten-
tial for yielding a diagnostic test with superior
characteristics. Previously, we used a multiplex biomar-
ker-measuring technique referred to as proximity ligation
assay (PLA) to identify a panel of human plasma biomar-
kers for pancreatic cancer [6,7]. PLA was initially devel-
oped as a technique to improve the sensitivity and
specificity of protein detection in a solution-phase, "liq-
uid sandwich ELISA" format [8,9]. As described, this
method employs pairs of antibodies coupled to DNA oli-
gonucleotides such that when the antibody pairs bind to
the target protein, the local concentration of DNA oligo-
nucleotides increases to allow for enzymatic ligation of
the two strands. The resulting amplicons are unique for
each specific protein detected and can be measured in a
highly quanititative manner by qPCR. Furthermore, PLA
can be multiplexed for simultaneous detection of multi-
ple proteins.
PLA has several advantages when compared to current
solid-phase approaches. This method of antigen quantifi-
cation is highly precise; antibody cross-reactivity signal is
not observed because of the dual-probe nucleic acid assay
design. Also, scalability of the multiplexing is superior to
existing methods, since PLA has no upper limit to single-
well multiplexing. Bead-based platforms such as Luminex
are currently limited to 200-plex assays, although in prac-
tice only up to 10 may be used simultaneously due to anti-
body crossreactivity [10]. Finally, quantification of a PLA
is versatile and can be executed on a number of platforms
including real-time PCR, mass spectrometry, next-genera-
tion sequencing and DNA microarrays. Ultimately, using
techniques such as PLA, diagnosis and staging may be
improved by detecting a unique pattern of biomarkers
that are increased as well as those that are decreased in the
plasma of patients displaying clinical symptoms of pan-
creatic cancer.
In this study, we assembled a cohort of 52 cases of locally
advanced, unresectable pancreatic ductal adenocarci-
noma (Stage II/III) and 43 healthy, age-matched controls.
To date, this dataset represents the largest cohort of pan-
creatic patients with PLA profiling of putative pancreatic
cancer biomarkers. After applying advanced statistical
methods to this dataset, we identified a panel of three
biomarkers that exceed the diagnostic accuracy of CA19-9
alone. In addition, we identified two biomarkers whose
combination are significantly prognostic for survival in
advanced, unresectable cancer, as determined by both
univariate and multivariate models.
Materials and methods
Proximity Ligation Assay
This study probes 21 putative tumor markers for relevance
in pancreatic cancer using a proximity ligation assay
(PLA). Multiplex PLA was performed on 95 frozen plasma
samples as described (3) with the following modifica-
tions. Samples were thawed and mixed in a 1:1 ratio with
buffer (Olink AB) for undiluted assays or in a 1:50 ratio
for diluted assays before incubation for 10 minutes at
Journal of Translational Medicine 2009, 7:105 />Page 3 of 12
(page number not for citation purposes)
room temperature. No PDGF-BB spike was added as in
previous studies. For probing, we mixed 2 μL of the buff-
ered plasma sample with 2 μL of any one of four probe
detection panels validated in the pilot study and incu-
bated the 4 μL mixture for 2 hours at 37°C to allow the
probes to bind analytes. Ligation was achieved by incubat-
ing 120 μL of reaction mixture with the 4 μL probed sam-
ples for 15 minutes at 30°C to dilute and separate any free
probes. To stop ligation, 2 μL of uracil-DNA excision mix
(Epicentre) was added and incubated for 15 minutes at
room temperature.
Preamplification of bar-coded amplicons required mixing
25 μL of ligation reaction mixture with 25 μL of pooled
PCR mix (Platinum Taq kit, Invitrogen). After 13 cycles at
95°C for 30 seconds and a 4-minute extension at 60°C,
the preamplification products were diluted 10-fold in TE.
For each protein assayed, a separate qPCR reaction was
required in a 384-well plate with 2 μL of diluted preampli-
cation product sample, 5 μL of iTaq mix (iTaq SYBR Green
Supermix with ROX, Bio-Rad), 2 μL qPCR primer mix,
and 1 μL water. Protein-specific qPCR detection primers
were not dried at the bottom of each well. Real-time qPCR
was performed with a sample volume of 10 μL per well for
40 cycles at 95°C for 15 seconds and 60°C for 1 minute.
To ensure standardization of values for each biomarker
investigated, all 95 samples were simultaneously probed
and evaluated on a single 384-well plate with a PBS-BSA
blank well.
Data Processing
Cycle threshold (Ct) values resulting from qPCR were
converted into estimated number of starting amplicons,
or PLA units, by calculating 10
(-0.301 × Ct+11.439)
as previ-
ously reported (7). After calculating PLA units, data were
subsequently transformed into log
2
space in order to
increase normality in the distribution of the data while
retaining the magnitude of differences between different
tumor markers.
Human Plasma Samples
This study includes 52 human EDTA blood plasma sam-
ples collected between July 2002 and May 2007 from
identically staged patients with locally advanced pancre-
atic ductal adenocarcinoma (Stage II/III) treated at Stan-
ford University Medical Center under an institutional
review board-approved protocol. All plasma samples were
collected from untreated (de novo) patients with biopsy-
proven pancreatic adenocarcinomas. Median age at blood
collection was 68 years (range 37-84 years). All patients
were treated with gemcitabine based chemotherapy and
the majority also received radiotherapy. At the end of the
study, 41 patients were deceased. As a control group, 43
additional plasma samples were collected from age-
matched, healthy volunteers under an IRB-approved pro-
tocol. Immediately after acquisition, blood samples were
centrifuged and aliquots of plasma stored at -80°C.
Biomarker Panel Selection and Modeling
All statistical analyses completed in this study were exe-
cuted using the R statistical computing environment. To
select the discrete set of biomarkers used to fit models of
pancreatic cancer diagnosis, we used the R distribution of
the Prediction Analysis of Microarrays statistical tech-
nique, PAMR. Logistic regression models were fit using
the generalized linear model function in R.
Survival Analysis and Modeling
Survival data were fit to a right-censored model using the
Survival function in the R statistical computing environ-
ment. Univariate and multivariate Cox proportional haz-
ards models were fit onto survival data using the coxph
function. Hazard ratios were calculated as the ratios of risk
by the increase or decrease of 1 log
2
PLA unit (2-fold
increase or decrease in plasma concentration of a biomar-
ker).
Results and Discussion
We used a proximity ligation assay (PLA) to measure the
levels of 21 tumor markers in the plasma of a cohort of 52
patients with unresectable, advanced pancreatic cancer as
well as a cohort of 43 healthy, age-matched volunteers.
After calculating log
2
PLA units for each tumor marker
within each sample (Materials and Methods), we initially
determined whether any of these tumor markers are sig-
nificantly elevated or reduced in the plasma of unresecta-
ble pancreatic cancer patients compared to healthy
controls. To make this comparison, we used the Welch-
Satterthwaite modification of Student's t-test to determine
statistical significance and adjust for unequal variances
between cases and controls. Of the 21 tumor markers
assayed, we found that 11 were significantly elevated in
unresectable pancreatic cancer (p < 0.05) (Table 1). One
tumor marker, EpCAM, was significant to p < 0.04; we
would expect approximately 1 tumor marker at this level
of significance by random chance given that we assayed
21 tumor markers. We therefore did not consider EpCAM
significantly different in cases versus controls. These 11
significant tumor markers were uniformly elevated in
pancreatic cancer compared to controls (Figure 1). None
of the 21 tumor markers were significantly reduced in
pancreatic cancer compared to controls. The tumor
marker with the greatest significance of difference was
Osteopontin (OPN; p < 1.2 × 10
-12
), while the largest mag-
nitude of difference between cases and controls was
CA19-9 (approximately 8-fold). Six tumor markers had a
greater than 2-fold median elevation in pancreatic cancer
compared to controls.
Journal of Translational Medicine 2009, 7:105 />Page 4 of 12
(page number not for citation purposes)
In addition to identifying tumor markers that are signifi-
cantly elevated in the plasma of pancreatic cancer
patients, we investigated whether a panel of tumor mark-
ers could diagnose the presence of pancreatic cancer more
accurately than the current standard tumor marker for
pancreatic cancer, CA19-9. Currently, CA19-9 cannot be
used as a practical diagnostic marker because of approxi-
mately 80% sensitivity and selectivity rates, as well as an
overall 20% error rate. A panel consisting of CA19-9 com-
bined with additional tumor markers could potentially
increase the sensitivity and selectivity of tumor marker
diagnosis to clinically acceptable levels. To identify an
optimal combination of tumor markers that could accu-
rately identify and classify pancreatic cancer cases versus
healthy controls on the basis of PLA data, we used an anal-
ysis scheme whereby we divided the set of samples ran-
domly into three sets: a discovery set, a modeling set, and
a test set. The purpose of the discovery set is to identify the
Table 1: Proximity ligation assay reveals 11 tumor markers that are significantly elevated in pancreatic cancer cases compared to
healthy controls.
Tumor Marker p * < Fold Difference
†
Lower 95% CI Upper 95% CI
OPN 1.20 × 10
-12
2.04 14.99 15.38
CA19-9 6.82 × 10
-12
16.41 17.57 18.55
CHI3L1 8.60 × 10
-8
3.13 18.42 19.06
CA125 4.86 × 10
-7
3.54 20.20 20.89
CEA 1.35 × 10
-5
3 17.70 18.35
VEGF 3.22 × 10
-4
2.17 14.04 14.65
MESO 0.0014 1.39 20.63 20.92
IGF2 0.0022 1.35 21.45 21.78
IL-7 0.01 1.83 15.88 16.41
MIF 0.01 1.58 16.35 16.88
ERBB2 0.02 1.18 18.57 18.84
EpCam 0.04 0.63 12.85 13.35
EGFR 0.07 0.89 16.58 16.85
IL-1 0.28 1.36 16.72 17.18
ADAM8 0.29 1.35 7.41 7.85
Galectin 0.3 0.94 10.34 10.54
CTGF 0.4 1.12 11.07 11.60
CPA1 0.46 1.07 12.06 12.38
TNF 0.49 1.22 13.03 13.44
SLPI 0.68 1.08 20.41 20.73
CA15-3 0.82 1.02 16.88 17.24
* - p-values calculated using Welch-Satterthwaite Student's t-test and a two-sided distribution
† - Fold differences calculated comparing cases to controls using log
2
medians in PLA units
Journal of Translational Medicine 2009, 7:105 />Page 5 of 12
(page number not for citation purposes)
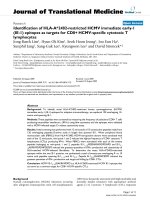
Plasma levels of 21 tumor markers in pancreatic cancer patients and healthy controls measured by proximity ligation assayFigure 1
Plasma levels of 21 tumor markers in pancreatic cancer patients and healthy controls measured by proximity
ligation assay. Each boxplot corresponds to a single tumor marker measured in 95 samples by proximity ligation assay. Pan-
creatic cancer cases (52) are depicted at left, healthy controls (43) at right. Y-axis corresponds to log
2
PLA units. Central bars
show the median for each cohort, boxes represent the interquartile 50
th
percentile (IQ50). Whiskers represent 1.5 times the
IQ50.
Journal of Translational Medicine 2009, 7:105 />Page 6 of 12
(page number not for citation purposes)
best combination of tumor markers that would most
accurately classify cases from controls. To accomplish this
discovery step, we used a classification algorithm, PAM
(Prediction Analysis of Microarrays) [11]. PAM is a semi-
supervised method that uses a shrunken centroid metric
to output a sparse number of linear terms that best classi-
fies a dataset. We randomly allocated 50 samples out of
95 to the discovery set. Following the identification of
model terms in the discovery step, we next implemented
a modeling step to fit coefficients to terms using a logistic
regression model of the form:
Where p
i
is the probability of the ith sample being either
diagnosed with pancreatic cancer, b
k
is the coefficient for
the kth model term, X
k
is the kth model term in the ith
sample. We randomly allotted 25 samples to the mode-
ling step. We maintained separate discovery and mode-
ling cohorts such that the coefficients of the predictive
model would not be subject to optimistic overfitting.
Finally, we allotted the remaining 20 samples to a test set
to validate the predictive quality of the logistic regression
model. We validated using a test set rather than a crossval-
idation approach because crossvalidation in general is
overly optimistic, and we hoped to identify a panel of
biomarkers that could be implemented clinically. Because
the test set sample size is small, only 20 samples, to
address the potential for a test set to be either overly opti-
mistic or pessimistic due to random selection, and gauge
the robustness of the data, we repeated the discovery,
modeling, and test set validation steps 10 times, each time
randomly assigning samples, recalculating model terms
via PAM, refitting model coefficients, and independently
testing the validity of the model. At no time during our
analysis of the data was there any overlap in training and
test sets for any of the 10 independent test runs, nor was
there any overlap in analysis between any of the test runs.
There existed the potential that several models with differ-
ing model terms could have been outputted from test run
to test run. For each test run, we tabulated model terms,
sensitivity, selectivity and error frequency, and compared
pe
ZbX bX bX
i
Z
iikki
=+
=+ +
−
11
11 2 2
/( )
()
,, ,
K
Table 2: Analysis of diagnostic sensitivity, selectivity and error for a panel consisting of CA19-9, OPN and CHI3L1 compared to CA19-
9 alone.
Test Run* Panel Sensitivity
†
Panel Selectivity
‡
Panel Error
§
CA19-9 Sensitivity
||
CA19-9 Selectivity** CA19-9 Error
††
1 0.92 (0.65 - 0.99) 0.88 (0.53 - 0.98) 0.10 0.92 (0.65 - 0.99) 0.88 (0.53 - 0.98) 0.10
2 1.00 (0.65 - 1.0) 0.69 (0.42 - 0.87) 0.10 0.33 (0.14 - 0.61) 0.75 (0.41 - 0.93) 0.50
3 1.00 (0.65 - 1.0) 0.69 (0.42 - 0.87) 0.10 1.00 (0.65 - 1.0) 0.62 (0.36 - 0.82) 0.25
4 1.00 (0.76 - 1.0) 0.88 (0.53 - 0.98) 0.05 0.92 (0.65 - 0.99) 1.00 (0.68 - 1.0) 0.05
5 1.00 (0.68 - 1.0) 0.92 (0.65 - 0.99) 0.15 1.00 (0.68 - 1.0) 0.83 (0.55 - 0.95) 0.10
6 0.89 (0.57 - 0.98) 0.82 (0.52 - 0.95) 0.05 0.89 (0.57 - 0.98) 0.45 (0.21 - 0.72) 0.35
7 0.75 (0.47 - 0.91) 0.75 (0.41 - 0.93) 0.05 0.67 (0.39 - 0.86) 0.75 (0.41 - 0.93) 0.30
8 1.00 (0.72 - 1.0) 0.80 (0.49 - 0.94) 0.10 0.90 (0.60 - 0.98) 0.80 (0.49 - 0.94) 0.15
9 1.00 (0.77 - 1.0) 0.71 (0.36 - 0.92) 0.10 0.69 (0.42 - 0.87) 1.00 (0.65 - 1.0) 0.20
10 0.78 (0.45 - 0.94) 1.00 (0.74 - 1.0) 0.10 0.67 (0.35 - 0.88) 0.91 (0.62 - 0.98) 0.20
Average 0.93 0.81 0.13 0.80 0.80 0.22
*- One complete run of analysis, including random sample division into training, modeling, and test sets
† - Sensitivity of logistic regression model prediction with CA19-9, OPN, and CHI3L1 as model terms. Parenthetical values represent the 95% CI.
‡ - Selectivity of logistic regression model prediction with CA19-9, OPN, and CHI3L1 as model terms. Parenthetical values represent the 95% CI.
§- Frequency of combined false negative and false positive calls in 20 test samples using a logistic regression model with CA19-9, OPN, and CHI3L1
as model terms
|| - Sensitivity of logistic regression model prediction with CA19-9 alone as a model term. Parenthetical values represent the 95% CI.
**- Selectivity of logistic regression model prediction with CA19-9 alone as a model term. Parenthetical values represent the 95% CI.
†† - Frequency of combined false negative and false positive calls in 20 test samples using a logistic regression model with CA19-9 alone as a model
term
Journal of Translational Medicine 2009, 7:105 />Page 7 of 12
(page number not for citation purposes)
the multi-marker panel model to results for a model
incorporating CA19-9 only.
After completing this analysis, we found that in 10 out of
10 independent test runs, PAM identified a panel of the
same three tumor markers, CA19-9, OPN, and CHI3L1, as
the optimal terms to classify pancreatic cancer from
healthy controls. When comparing sensitivity and selec-
tivity of the tumor marker panel to CA19-9 alone, we
found that the tumor marker panel showed a significant
increase in sensitivity (0.93 vs. 0.81) (Table 2). Selectivity
was approximately similar between the panel and CA19-9
alone. We also calculated average positive predictive value
(0.83 vs. 0.80) and average negative predictive value (0.93
vs. 0.79). Finally, overall errors in prediction made by the
three tumor marker panel were approximately 60% in fre-
quency compared to CA19-9 alone. We conclude that a
panel consisting of CA19-9, OPN, and CHI3L1 is superior
for pancreatic cancer diagnosis compared to CA19-9 alone
(Figure 2).
Beyond diagnosing pancreatic cancer, we were interested
in identifying tumor markers that are prognostic for post-
draw survival in advanced, unresectable pancreatic cancer.
To accomplish this, we fit the survival of the 52 pancreatic
cancer cases to a Cox proportional hazards model of the
form:
where h(t) is the hazard function at time t, h
0
(t) is the haz-
ard function when the value of all independent variables
is zero, b
k
is the coefficient for the kth model term, and X
k
is the kth model term. We fit both a univariate model con-
sidering only the plasma level of tumor markers as meas-
ured by the PLA, as well as a multivariate model
considering tumor marker level, gender, and whether the
patient was treated by radiotherapy (Table 3). Under both
models, only two tumor markers were significantly prog-
nostic: CEA and CA-125. Of the two, CEA is the most
prognostic. After observing this result, we also considered
that a combined multivariate Cox model using CEA,
CA125, gender, and radiotherapy would be more prog-
nostic than a multivariate model containing either tumor
marker alone. A combined model did prove to be superior
(log likelihood p < 0.003). We also considered a multivar-
iate model involving radiotherapy, ECOG performance
score, and serum albumin in combination with each of 21
biomarkers. As in previous models, only CA125 and CEA
were shown to be significantly prognostic (p < 0.05; Table
4). Following this, we divided the 52 cases into tertiles by
CEA, CA125, or both (Figure 3). The median patient in
the lower third of CEA and CA125 level will survive
approximately 4 months longer than the median patient
in the upper third. We therefore conclude that a panel of
tumor markers consisting of CEA and CA125 can prog-
nostically stratify cases of unresectable pancreatic cancer.
Conclusions
This study of 52 cases and 43 controls is the largest sample
set of pancreatic cancer patients in which PLA was used for
multiplexed detection of secreted proteins. All patients
were identically staged and were determined to have
locally advanced pancreatic cancer (Stage II/III). Further-
more, all plasma samples were obtained prior to initiating
any therapy. From this carefully defined clinical popula-
tion, we conclude that a 3-member plasma biomarker
panel consisting of CA19-9, osteopontin (OPN), and chi-
tinase 3-like 1 (CHI3L1) resulted in improved diagnostic
accuracy compared to CA19-9 alone for locally advanced,
unresectable tumors.
CA19-9 is the most widely used biomarker in pancreatic
cancer, but its use is primarily limited to monitoring
ht h t e
bX bX bX
kk
() [ ()]
()
=
++
0
11 22
K
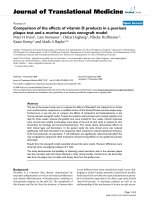
A tumor marker panel consisting of CA19-9, OPN, and CHI3L1 predicts the presence of pancreatic cancer more accurately than CA19-9 aloneFigure 2
A tumor marker panel consisting of CA19-9, OPN,
and CHI3L1 predicts the presence of pancreatic can-
cer more accurately than CA19-9 alone. (A) Each row
corresponds to 1 of 20 randomly assigned pancreatic cancer
cases or healthy controls in the test set. Each column repre-
sents a tumor marker. Cells depict normalized log
2
PLA
units. (B) Rows are as A. Columns represent either a three-
marker panel consisting of CA19-9, OPN, and CHI3L1, or
CA19-9 alone. Cells depict the model-outputted probability
that a given sample is either pancreatic cancer or healthy
control, with a cutoff of p > 0.5 to be considered pancreatic
cancer.
Journal of Translational Medicine 2009, 7:105 />Page 8 of 12
(page number not for citation purposes)
responses to cancer therapy and recurrence of resected
tumors and plays only a minor role in diagnosis. CA19-9
can be falsely elevated in patients with benign pancrea-
tico-biliary conditions such as cholestasis and pancreati-
tis. Furthermore, this Lewis blood group antigen is not
expressed in up to 10% of the population [12]. Although
the combination of CA19-9, OPN, and CHI3L1 improves
the diagnostic accuracy compared to CA19-9 alone, our
study was limited to patients with locally advanced pan-
creatic cancer. Although extrapolation of these data to an
asymptomatic population as a potential screening tool
would not be appropriate, our results suggest that the use
of biomarker panels for the initial diagnosis of pancreatic
cancer is promising. Increased or decreased levels of spe-
Table 3: Univariate and multivariate Cox proportional hazard models fit on 21 tumor markers.
Tumor Marker p* < HR
†
p
‡
<HR
§
CEA 0.00019 1.54 (1.23 - 1.93) 0.0007 1.55 (1.21 - 2.05)
CA125 0.0014 1.45 (1.16 - 1.83) 0.0025 1.43 (1.14 - 1.80)
EGFR 0.089 2.17 (0.89 - 5.30) 0.12 2.16 (0.81 - 5.75)
CPA1 0.13 1.33 (0.92 - 1.94) 0.023 1.54 (1.06 - 2.24)
ERBB2 0.24 1.31 (0.84 - 2.03) 0.0023 1.84 (1.23 - 2.76)
ADAM8 0.26 1.20 (0.87 - 1.66) 0.51 1.12 (0.80 - 1.58)
CA15-3 0.27 1.33 (0.80 - 2.20) 0.3 1.33 (0.77 - 2.30)
SLPI 0.27 1.32 (0.80 - 2.15) 0.005 1.86 (1.21 - 2.87)
MIF 0.31 0.88 (0.68 - 1.13) 0.36 0.88 (0.67 - 1.16)
Galectin 0.34 1.33 (0.74 - 2.41) 0.36 1.35 (0.72 - 2.55)
IGF2 0.37 1.25 (0.77 - 2.02) 0.042 1.63 (1.02 - 2.62)
MESO 0.42 1.18 (0.79 - 1.74) 0.062 1.45 (0.98 - 2.16)
CTGF 0.45 1.09 (0.88 - 1.34) 0.98 1.00 (0.78 - 1.27)
TNF 0.47 1.13 (0.82 - 1.56) 0.17 1.25 (0.91- 1.71)
VEGF 0.58 0.94 (0.74 - 1.19) 0.65 0.94 (0.73- 1.22)
IL-7 0.58 0.95 (0.78 - 1.15) 0.52 0.93 (0.75 - 1.16)
EpCAM 0.61 1.07 (0.83 - 1.37) 0.35 1.14 (0.86 - 1.52)
CA19-9 0.67 1.04 (0.88 - 1.23) 0.86 0.98 (0.82 - 1.18)
OPN 0.68 1.10 (0.71 - 1.69) 0.58 0.87 (0.54 - 1.41)
IL-1 0.85 0.97 (0.74 - 1.28) 0.42 0.88 (0.65 - 1.19)
CHI3L1 0.94 0.99 (0.78 - 1.27) 0.91 0.99 (0.76 - 1.28)
*- p-value derived from a univariate Cox proportional hazards model accounting for the effect of tumor marker only on prognosis
† - Hazard ratio derived from univariate Cox proportional hazards model. Parenthetical values denote 95% confidence interval.
‡ - p-value derived from a multivariate Cox proportional hazards model accounting for tumor marker, sex, and therapy on prognosis
§- Hazard ratio derived from multivariate Cox proportional hazards model. Parenthetical values denote 95% confidence interval.
Journal of Translational Medicine 2009, 7:105 />Page 9 of 12
(page number not for citation purposes)
cific proteins in the blood may indicate important infor-
mation regarding the underlying biology of pancreatic
cancer.
Other investigators have reported that CHI3L1 (also
known as YKL-40) is an important biomarker for breast
and ovarian cancer [13-17]. In solid tumors, this protein
has been shown to be important in the regulation of extra-
cellular matrix remodeling, suggesting a role in invasion
and metastases [18]. Interestingly, CHI3L1/YKL-40 was
found in a prospective Danish population study to be pre-
dictive of ultimately developing gastrointestinal cancer.
Furthermore, elevation of this biomarker also predicted
decreased survival after diagnosis [19].
Osteopontin is an important biomarker in head and neck
cancer [20,21] as well as lung cancer [22], and has been
shown to be in involved in angiogenesis by acting through
the PI3K/Akt pathway to enhance the expression of VEGF
[23]. In pancreatic cancer, Koopmann et al demonstrated
that serum OPN levels were significantly elevated in
patients with pancreatic adenocarcinoma prior to surgical
resection compared to healthy controls. Based upon
serum ELISA, these investigators reported a sensitivity of
80% and a specificity of 97% [24]. OPN is a secreted pro-
tein responsible for stimulating various signaling path-
ways, including those promoting survival and metastases
under hypoxia [25]. This protein also functions as a chem-
otactic factor for macrophages, dendritic cells, and T cells.
Depending upon the context, OPN has been shown to
have both pro- and anti-inflammatory functions [26].
We previously reported in a smaller study of 20 patients
that an 11 biomarker panel (CA19-9, CHI3L1, OPN, CA-
125, ERBB2, ADAM8, SLPI, IGF-2, VEGF, CTGF) resulted
in increased diagnostic accuracy compared to CA 19-9
alone [7]. However, in the current study, only CA19-9,
CHI3L1, and OPN retained significance in improving
diagnostic accuracy. In the previous study, although Pre-
diction Analysis of Microarrays was used to calculate a
panel, no modeling steps were carried out to optimize the
predictive value of a biomarker panel. Furthermore, k-fold
crossvalidation rather than an independent test set was
used to validate the panel hypothesis; k-fold crossvalida-
tion has the disadvantage of being statistically optimistic.
The present study also has the advantage of increased size
and statistical resolution, considering greater than twice as
many cases compared to the previous study. We postulate
that these factors account for the update in findings
between these two studies. In addition to our studies
using PLA to find multiplex panels for the diagnosis of
pancreatic cancer, recent work using the LabMAP technol-
ogy platform identified a panel of cytokines in plasma
that can detect pancreatic cancer with higher specificity
than CA19-9 measured alone using traditional ELISA
methods [27].
In this study, we found that a combination of CEA and
CA125 has superior prognostic value for locally advanced
pancreatic cancer in two survival models. CEA has been
previously shown to have some value for predicting sur-
vival in pancreatic cancer [28], and although CEA is usu-
ally measured in the context of diagnosing colorectal
cancer, this marker has also been shown to be elevated in
Table 4: Multivariate Cox proportional hazards on radiotherapy,
ECOG performance score, serum albumin and 21 tumor
markers
Tumor Marker p* < HR
†
CA125 0.033 1.37 (1.02 - 1.99)
CEA 0.037 1.43 (1.03 - 1.82)
CPA1 0.082 1.43 (0.60 - 4.33)
Adam8 0.14 1.29 (0.96 - 2.14)
Erbb2 0.17 1.42 (0.86 - 2.34)
SLPI 0.24 1.38 (0.92 - 1.81)
MESO 0.28 1.31 (0.56 - 1.81)
EGFR 0.34 1.61 (0.81 - 2.34)
VEGF 0.43 1.13 (0.75 - 1.35)
TNF 0.48 1.14 (0.61 - 2.71)
IL-7 0.54 1.07 (0.66 - 1.88)
CTGF 0.55 1.08 (0.80 - 2.14)
CA19-9 0.64 0.96 (0.84 - 1.38)
EpCam 0.51 1.12 (0.80 - 1.62)
Galectin 0.51 1.28 (0.83 - 1.54)
MIF 0.95 0.99 (0.85 - 1.36)
OPN 0.68 1.12 (0.80 - 1.57)
CHI3L1 0.8 0.96 (0.82 - 1.13)
IGF2 0.68 1.12 (0.64 - 1.97)
CA15-3 0.98 1.01 (0.80 - 1.57)
IL-1 0.5 1.12 (0.69 - 1.33)
*- p-value derived from a univariate Cox proportional hazards model
accounting for the effect of tumor marker only on prognosis
† - Hazard ratio derived from univariate Cox proportional hazards
model. Parenthetical values denote 95% confidence interval.
Journal of Translational Medicine 2009, 7:105 />Page 10 of 12
(page number not for citation purposes)
approximately half of all pancreatic cancer cases [29].
CA125 is a commonly measured marker of ovarian cancer
used in the diagnosis and treatment of that neoplasm
[30,31]. To date, no studies have implicated CA125 for
utility in pancreatic cancer prognosis.
It is unlikely that a single biomarker will result in 100%
sensitivity and 100% specificity for pancreatic cancer.
However, continued progress in biomarker discovery
efforts may one day yield a panel of biomarkers that will
approach the sensitivity and specificty required for screen-
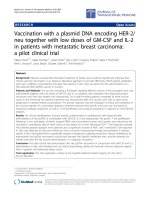
CEA and CA125 are significantly prognostic for advanced, unresectable pancreatic cancerFigure 3
CEA and CA125 are significantly prognostic for advanced, unresectable pancreatic cancer. (A) Kaplan-Meier plot
depicting survival of 52 cases of advanced, unresectable pancreatic cancer. Cohort divided into tertiles by CEA plasma levels
measured by proximity ligation assay. Red line denotes highest 33% by CEA plasma level, green line medial 33%, and blue line
lowest 33%. Tick marks represent right censored data. (B) Cohort divided into tertiles by CA125 plasma levels measured by
proximity ligation assay. Otherwise as A. (C) Cohort divided into tertiles by combined, rank-ordered levels of CEA and
CA125 as measured in plasma by PLA. Otherwise as A.
Journal of Translational Medicine 2009, 7:105 />Page 11 of 12
(page number not for citation purposes)
ing large populations with a blood test. The greatest utility
of such a test would be to identify those individuals with
precancerous lesions such as pancreatic intrepithelial neo-
plasia (PanIN) or intraductal papillary mucinous tumor
(IPMT). Because most of these lesions are microscopic
and noninvasive, it is unlikely that a blood test will have
sufficient sensitivity to detect these lesions. Biomarker
profiling of pancreatic juice obtained endoscopically is
another strategy that some investigators are using to over-
come this limitation. Although PLA has not yet been used
to characterize biomarker profiles in pancreatic juice, in
theory, this technology could be applied to this fluid
which should further increase diagnostic accuracy.
Competing interests
The authors declare that they have no competing interests.
Authors' contributions
STC, JMZ, and JH carried out Proximity Ligation Assay
experiments. STC and JMZ executed data analysis and sta-
tistical data modeling. PLK, JMF, GAF, QTL, DTC, HJ, and
ACK conceived of experiments and data analyses. STC,
PLK, JMF, GAF, QTL, DTC, HJ, and ACK collected speci-
mens and coordinated clinical data. All authors read and
approved this manuscript.
Acknowledgements
Funding: STC was supported by the University of California, San Francisco
(UCSF) Dean's Summer Research Fellowship. DTC, HJ, and ACK received
support from the Cha Family Foundation. QTL and ACK received support
from the National Institutes of Health (PO1 CA67166).
Informed Consent: All patients were recruited under a Stanford Univer-
sity IRB-approved protocol with full informed consent.
References
1. Jemal A, Siegel R, Ward E, Hao Y, Xu J, Murray T, Thun MJ: Cancer
statistics, 2008. CA Cancer J Clin 2008, 58:71-96.
2. Ries LAG, Melbert D, Krapcho M, Stinchcomb DG, Howlader N,
Horner MJ, Mariotto A, Miller BA, Feuer EJ, Altekruse SF, Lewis DR,
Clegg L, Eisner MP, Reichman M, Edwards BK, (Eds): SEER Cancer
Statistics Review, 1975-2005. Bethesda, MD: National Cancer
Institute; 2008.
3. Locker GY, Hamilton S, Harris J, Jessup JM, Kemeny N, Macdonald JS,
Somerfield MR, Hayes DF, Bast RC Jr: ASCO 2006 update of rec-
ommendations for the use of tumor markers in gastrointes-
tinal cancer. J Clin Oncol 2006, 24:5313-5327.
4. Frebourg T, Bercoff E, Manchon N, Senant J, Basuyau JP, Breton P, Jan-
vresse A, Brunelle P, Bourreille J: The evaluation of CA 19-9 anti-
gen level in the early detection of pancreatic cancer. A
prospective study of 866 patients. Cancer 1988, 62:2287-2290.
5. Magnani JL, Steplewski Z, Koprowski H, Ginsburg V: Identification
of the gastrointestinal and pancreatic cancer-associated
antigen detected by monoclonal antibody 19-9 in the sera of
patients as a mucin. Cancer Res 1983, 43:5489-5492.
6. Fredriksson S, Dixon W, Ji H, Koong AC, Mindrinos M, Davis RW:
Multiplexed protein detection by proximity ligation for can-
cer biomarker validation. Nat Methods 2007, 4:327-329.
7. Fredriksson S, Horecka J, Brustugun OT, Schlingemann J, Koong AC,
Tibshirani R, Davis RW: Multiplexed proximity ligation assays
to profile putative plasma biomarkers relevant to pancreatic
and ovarian cancer. Clin Chem 2008, 54:582-589.
8. Fredriksson S, Gullberg M, Jarvius J, Olsson C, Pietras K, Gustafsdottir
SM, Ostman A, Landegren U: Protein detection using proximity-
dependent DNA ligation assays. Nat Biotechnol 2002,
20:473-477.
9. Gullberg M, Gustafsdottir SM, Schallmeiner E, Jarvius J, Bjarnegard M,
Betsholtz C, Landegren U, Fredriksson S: Cytokine detection by
antibody-based proximity ligation. Proc Natl Acad Sci USA 2004,
101:8420-8424.
10. Fulton RJ, McDade RL, Smith PL, Kienker LJ, Kettman JR Jr:
Advanced multiplexed analysis with the FlowMetrix system.
Clin Chem 1997, 43:1749-1756.
11. Tibshirani R, Hastie T, Narasimhan B, Chu G: Diagnosis of multiple
cancer types by shrunken centroids of gene expression. Proc
Natl Acad Sci USA 2002,
99:6567-6572.
12. Goggins M: Molecular markers of early pancreatic cancer. J
Clin Oncol 2005, 23:4524-4531.
13. Johansen JS, Cintin C, Jorgensen M, Kamby C, Price PA: Serum YKL-
40: a new potential marker of prognosis and location of
metastases of patients with recurrent breast cancer. Eur J
Cancer 1995, 31A:1437-1442.
14. Cintin C, Johansen JS, Christensen IJ, Price PA, Sorensen S, Nielsen
HJ: Serum YKL-40 and colorectal cancer. Br J Cancer 1999,
79:1494-1499.
15. Dehn H, Hogdall EV, Johansen JS, Jorgensen M, Price PA, Engelholm
SA, Hogdall CK: Plasma YKL-40, as a prognostic tumor
marker in recurrent ovarian cancer. Acta Obstet Gynecol Scand
2003, 82:287-293.
16. Johansen JS, Christensen IJ, Riisbro R, Greenall M, Han C, Price PA,
Smith K, Brunner N, Harris AL: High serum YKL-40 levels in
patients with primary breast cancer is related to short recur-
rence free survival. Breast Cancer Res Treat 2003, 80:15-21.
17. Hogdall EV, Ringsholt M, Hogdall CK, Christensen IJ, Johansen JS,
Kjaer SK, Blaakaer J, Ostenfeld-Moller L, Price PA, Christensen LH:
YKL-40 tissue expression and plasma levels in patients with
ovarian cancer. BMC Cancer 2009, 9:8.
18. Johansen JS, Jensen BV, Roslind A, Price PA: Is YKL-40 a new ther-
apeutic target in cancer? Expert Opin Ther Targets 2007,
11:219-234.
19. Johansen JS, Bojesen SE, Mylin AK, Frikke-Schmidt R, Price PA, Nor-
destgaard BG: Elevated plasma YKL-40 predicts increased risk
of gastrointestinal cancer and decreased survival after any
cancer diagnosis in the general population. J Clin Oncol 2009,
27:572-578.
20. Petrik D, Lavori PW, Cao H, Zhu Y, Wong P, Christofferson E, Kap-
lan MJ, Pinto HA, Sutphin P, Koong AC, Giaccia AJ, Le QT: Plasma
osteopontin is an independent prognostic marker for head
and neck cancers. J Clin Oncol 2006, 24:5291-5297.
21. Le QT, Sutphin PD, Raychaudhuri S, Yu SC, Terris DJ, Lin HS, Lum B,
Pinto HA, Koong AC, Giaccia AJ: Identification of osteopontin as
a prognostic plasma marker for head and neck squamous
cell carcinomas. Clin Cancer Res 2003,
9:59-67.
22. Mack PC, Redman MW, Chansky K, Williamson SK, Farneth NC, Lara
PN Jr, Franklin WA, Le QT, Crowley JJ, Gandara DR: Lower oste-
opontin plasma levels are associated with superior outcomes
in advanced non-small-cell lung cancer patients receiving
platinum-based chemotherapy: SWOG Study S0003. J Clin
Oncol 2008, 26:4771-4776.
23. Dai J, Peng L, Fan K, Wang H, Wei R, Ji G, Cai J, Lu B, Li B, Zhang D,
Kang Y, Tan M, Qian W, Guo Y: Osteopontin induces angiogen-
esis through activation of PI3K/AKT and ERK1/2 in endothe-
lial cells. Oncogene 2009, 28:3412-3422.
24. Koopmann J, Fedarko NS, Jain A, Maitra A, Iacobuzio-Donahue C,
Rahman A, Hruban RH, Yeo CJ, Goggins M: Evaluation of oste-
opontin as biomarker for pancreatic adenocarcinoma. Cancer
Epidemiol Biomarkers Prev 2004, 13:487-491.
25. Le QT, Courter D: Clinical biomarkers for hypoxia targeting.
Cancer Metastasis Rev 2008, 27:351-362.
26. Wang KX, Denhardt DT: Osteopontin: role in immune regula-
tion and stress responses. Cytokine Growth Factor Rev 2008,
19:333-345.
27. Zeh HJ, Winikoff S, Landsittel DP, Gorelik E, Marrangoni AM,
Velikokhatnaya L, Winans MT, Lee K, Moser A, Bartlett D, Lotze MT,
Siegfried JM, Whitcomb D, Papacristou G, Slivka A, Bigbee WL, Lok-
shin AE: Multianalyte profiling of serum cytokines for detec-
tion of pancreatic cancer. Cancer Biomark 2005, 1:259-269.
Publish with Bio Med Central and every
scientist can read your work free of charge
"BioMed Central will be the most significant development for
disseminating the results of biomedical research in our lifetime."
Sir Paul Nurse, Cancer Research UK
Your research papers will be:
available free of charge to the entire biomedical community
peer reviewed and published immediately upon acceptance
cited in PubMed and archived on PubMed Central
yours — you keep the copyright
Submit your manuscript here:
/>BioMedcentral
Journal of Translational Medicine 2009, 7:105 />Page 12 of 12
(page number not for citation purposes)
28. Yasue M, Sakamoto J, Teramukai S, Morimoto T, Yasui K, Kuno N,
Kurimoto K, Ohashi Y: Prognostic values of preoperative and
postoperative CEA and CA19.9 levels in pancreatic cancer.
Pancreas 1994, 9:735-740.
29. Ni XG, Bai XF, Mao YL, Shao YF, Wu JX, Shan Y, Wang CF, Wang J,
Tian YT, Liu Q, Xu DK, Zhao P: The clinical value of serum CEA,
CA19-9, and CA242 in the diagnosis and prognosis of pancre-
atic cancer. Eur J Surg Oncol 2005, 31:164-169.
30. Baron AT, Boardman CH, Lafky JM, Rademaker A, Liu D, Fishman
DA, Podratz KC, Maihle NJ: Soluble epidermal growth factor
receptor (sEGFR) [corrected] and cancer antigen 125
(CA125) as screening and diagnostic tests for epithelial ovar-
ian cancer. Cancer Epidemiol Biomarkers Prev 2005, 14:306-318.
31. Bertenshaw GP, Yip P, Seshaiah P, Zhao J, Chen TH, Wiggins WS,
Mapes JP, Mansfield BC: Multianalyte profiling of serum anti-
gens and autoimmune and infectious disease molecules to
identify biomarkers dysregulated in epithelial ovarian can-
cer. Cancer Epidemiol Biomarkers Prev 2008, 17:2872-2881.