Báo cáo sinh học: " Genetic variation in the pleiotropic association between physical activity and body weight in mice" ppt
Bạn đang xem bản rút gọn của tài liệu. Xem và tải ngay bản đầy đủ của tài liệu tại đây (443.34 KB, 12 trang )
BioMed Central
Page 1 of 12
(page number not for citation purposes)
Genetics Selection Evolution
Open Access
Research
Genetic variation in the pleiotropic association between physical
activity and body weight in mice
Larry J Leamy*
1
, Daniel Pomp
2,3,4,5
and J Timothy Lightfoot
6
Address:
1
Department of Biology, University of North Carolina at Charlotte, Charlotte, North Carolina 28223, USA,
2
Department of Genetics,
University of North Carolina, Chapel Hill, NC 27599, USA,
3
Department of Nutrition, University of North Carolina, Chapel Hill, NC 27599, USA,
4
Department of Cell and Molecular Physiology, University of North Carolina, Chapel Hill, NC 27599, USA,
5
Carolina Center for Genome Science,
University of North Carolina, Chapel Hill, NC 27599, USA and
6
Department of Kinesiology, University of North Carolina at Charlotte, Charlotte,
North Carolina 28223, USA
Email: Larry J Leamy* - ; Daniel Pomp - ; J Timothy Lightfoot -
* Corresponding author
Abstract
Background: A sedentary lifestyle is often assumed to lead to increases in body weight and
potentially obesity and related diseases but in fact little is known about the genetic association
between physical activity and body weight. We tested for such an association between body weight
and the distance, duration, and speed voluntarily run by 310 mice from the F
2
generation produced
from an intercross of two inbred lines that differed dramatically in their physical activity levels.
Methods: We used a conventional interval mapping approach with SNP markers to search for
QTLs that affected both body weight and activity traits. We also conducted a genome scan to
search for relationship QTLs (relQTLs), or chromosomal regions that affected an activity trait
variably depending on the phenotypic value of body weight.
Results: We uncovered seven quantitative trait loci (QTLs) affecting body weight, but only one
co-localized with another QTL previously found for activity traits. We discovered 19 relQTLs that
provided evidence for a genetic (pleiotropic) association of physical activity and body weight. The
three genotypes at each of these loci typically exhibited a combination of negative, zero, and
positive regressions of the activity traits on body weight, the net effect of which was to produce
overall independence of body weight from physical activity. We also demonstrated that the relQTLs
produced these varying associations through differential epistatic interactions with a number of
other epistatic QTLs throughout the genome.
Conclusion: It was concluded that individuals with specific combinations of genotypes at the
relQTLs and epiQTLs might account for some of the variation typically seen in plots of the
association of physical activity with body weight.
Background
Mounting evidence suggests that physical activity is cru-
cial for the health and well being of people of all ages,
from very young children [1] to elderly adults [2]. Physical
inactivity is well known to be associated with a diverse
number of health problems such as coronary heart disease
and colon cancer [3-6] and has been ranked as the second
leading actual cause of death in the United States [7]. Sed-
Published: 23 September 2009
Genetics Selection Evolution 2009, 41:41 doi:10.1186/1297-9686-41-41
Received: 23 March 2009
Accepted: 23 September 2009
This article is available from: />© 2009 Leamy et al; licensee BioMed Central Ltd.
This is an Open Access article distributed under the terms of the Creative Commons Attribution License ( />),
which permits unrestricted use, distribution, and reproduction in any medium, provided the original work is properly cited.
Genetics Selection Evolution 2009, 41:41 />Page 2 of 12
(page number not for citation purposes)
entary lifestyles also are thought to promote obesity and
associated diseases such as diabetes that have become a
special concern in recent years because of their dramatic
increase in frequency even in children [8]. Moreover,
some studies have demonstrated beneficial effects of
physical activity independent of body weight or weight
gain [9]. Given the medical ramifications of obesity, there-
fore, it is clearly important that we have a better under-
standing of the association between physical activity and
weight.
The genetic contribution to the physical activity/body
weight relationship is of particular interest, especially
because it may account for some of the variability in
weight typically observed among individuals with
increased levels of physical activity. The question is, do
genes or gene interactions with pleiotropic effects on both
physical activity and weight traits exist or do these two
traits have completely separate genetic bases? At present,
we have little information to answer this question and in
fact only in recent years has the genetic basis of physical
activity itself been seriously explored. To date, various
genetic association studies have led to the identification of
more than 30 potential candidate genes in humans influ-
encing physical activity traits such as endurance and speed
[8]. However, some of these data are equivocal and it
remains to be seen whether the effects of many of these
genes on physical activity traits will be verified in subse-
quent studies and/or whether they also influence body
weight.
Lightfoot et al. [10] have taken an alternative approach to
explore the genetic basis of physical activity by conducting
a quantitative trait locus (QTL) study in mice. Using an F
2
population generated from an original cross of two inbred
strains differing dramatically in their physical activity lev-
els, these investigators uncovered several different QTLs
controlling the distance, duration, and speed voluntarily
run by the mice. Most recently, Leamy et al. [11] followed
up a QTL analysis with a full-genome scan for epistasis in
this same population of mice and discovered a number of
epistatic interactions of unknown QTLs that significantly
affected the physical activity traits. Contribution of epista-
sis to the total variation of the traits (average of 26%) was
about the same as that for single-locus effects of QTLs,
suggesting that epistatic interactions of genes may be an
important component of the genetic basis of physical
activity [11]. Although not genetically analyzed, body
weights were also recorded for all the F
2
mice, and thus
this population presented a unique opportunity to inves-
tigate the genetic association between the physical activity
traits and weight.
We conducted such an investigation in several steps, the
first of which was to map direct-effect QTLs for body
weight in these mice to determine whether any were at the
same location as those affecting the physical activity traits
(suggesting common QTLs with pleiotropic effects). A sec-
ond step was to conduct a genome search for relationship
QTLs or relQTLs [12,13], regions in the genome that affect
the physical activity traits variably depending on the phe-
notypic value for body weight. The effects of a relQTL may
be visualized by regressions of the dependent variable
(physical activity trait) on an independent variable (body
weight) that differ for each of several genotypes. For illus-
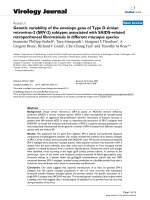
trative purposes, Figure 1 depicts a hypothetical situation
where the relationship between a physical activity trait
and body weight is positive for one homozygote (desig-
nated CC) but negative for the other homozygote (HH) at
a relQTL locus. Basically relQTLs produce their effects by
interacting with other genes (differential epistasis) or with
the environment [14,12]. Since epistatic interactions of
QTLs were previously found to affect the physical activity
traits in these mice [11], it seemed reasonable to test for
differential epistatic effects as a potential explanation for
any relQTLs discovered [13]. Thus, as a third and final
step, we screened the genome to see if relQTLs interacted
with other epistatic QTLs (epiQTLs) to significantly affect
the physical activity traits or body weight.
Methods
The population and traits
The F
2
population of mice used in this study was gener-
ated from crossing two inbred strains, C57BL/J and C3H/
HeJ, previously identified as exhibiting considerable
divergence in measures of physical activity. Reciprocal
crossing of mice from these strains resulted in 63 F
1
mice
A hypothetical example of the variation in the effects of the genotypes at a relationship QTL on the association between physical activity and body weightFigure 1
A hypothetical example of the variation in the effects
of the genotypes at a relationship QTL on the associ-
ation between physical activity and body weight. HH
and CC = homozygotes, CH = heterozygotes; note that the
effects of different values of body weight are opposing and
cancel each other.
Genetics Selection Evolution 2009, 41:41 />Page 3 of 12
(page number not for citation purposes)
that in turn were crossed to produce a total of 310 F
2
off-
spring (all first litters except for four matings that pro-
duced two successive litters). All mice were maintained in
the University of North Carolina at Charlotte Vivarium at
18-21°C and 20-40% humidity with 12 h light/dark
cycles and with food (Harland Teklad 8604 Rodent Diet,
Madison, WI) and water provided ad libitum.
We measured three physical activity traits in all F
2
mice
during a 21-day interval starting at an average age of 63
days (9 weeks). These traits included total daily distance
(kilometers) and total daily exercise time (minutes) that
were recorded every 24 h, and average daily running speed
(meters/minute) obtained by dividing distance by dura-
tion. This was accomplished for all mice with a solid sur-
face running wheel mounted in their cages that interfaced
with a computer that counted the total wheel revolutions
and recorded the time each mouse spent exercising (see
[15] for further details).
Within a week after completion of the phenotyping, the
mice were sacrificed, weighed to the nearest 0.1 g, and
their kidneys were collected for subsequent DNA extrac-
tion. Genotyping of all F
2
mice was accomplished for 129
single-nucleotide polymorphisms (SNPs) that differed
between the C57BL/J and C3H/HeJ progenitor strains.
These SNPs were chosen to provide a reasonable coverage
of the entire genome (including the X chromosome),
which they did with an average marker-marker interval of
about 14 cM. For all mouse procedures, we followed
guidelines approved by the UNC Charlotte Institutional
Animal Care and Use Committee and those recom-
mended for ethical use of animals from the American
Physiological Society and the American College of Sports
Medicine.
Body weight analyses
As was done previously [10] for the three physical activity
traits, we first tested body weight (WT) for potential effects
due to sex, litter size, and rearing block. All three factors
were entered as classification factors in a linear model and
found to be statistically significant. WT was therefore
adjusted for the effects of these factors by calculating
residuals from the model and adding them to the mean
weight in the overall population. This procedure was use-
ful in decreasing non-genetic sources of body size varia-
tion and therefore presumably increasing the statistical
power to detect QTLs and measure their effects. Merging
of the adjusted WT values with the previously adjusted
values for the physical activity traits constituted the phe-
notypic data set used in the analyses described below.
Direct-effect QTL scans for body weight were carried out
using the regression approach to interval mapping [16] as
previously described for the physical activity traits [10].
Briefly, additive (X
a
) and dominance (X
d
) index values
first were assigned for C3H/HeJ homozygotes (HH),
C57L/J homozygotes (CC), and heterozygotes (CH) at
each SNP marker and also imputed for all locations 2 cM
apart between flanking markers [10]. Then, we conducted
multiple regression of body weight on these index values
at each location to test for QTLs, and if present, estimated
their effects by calculation of the additive (a) and domi-
nance (d) genotypic values. The a values estimate one-half
of the difference between the mean body weights of the
two homozygotes and the d values estimate the difference
between the mean weight of the heterozygotes and that of
the mean of the two homozygotes [17]. The model was as
follows:
where μ is a constant, e = the residual, and the other terms
are as defined above.
To test for overall significance at each location, the proba-
bilities generated from the regression analyses were loga-
rithmically transformed to calculate LPR values [(log
10
(1/
Prob.)] similar to LOD scores [18]. The highest LPR score
on each chromosome was considered to indicate a puta-
tive QTL if this score exceeded a specific threshold value
(see below). Confidence intervals for each QTL were
determined by the one-LOD rule [19]. Each chromosome
was also tested for two-QTL and sex-specific QTL effects
affecting weight in the manner already described [10].
We used the traditional permutation method of Churchill
and Doerge [20] with 1000 shuffles to generate specific
5% threshold values for each chromosome that were sug-
gestive of linkage as well as a 5% genome-wise threshold
value that offered significant evidence of linkage. The
chromosome-wise values were particularly useful in
adjusting for the different sampling of each of the chro-
mosomes that varied in length and density of SNP mark-
ers. Further, there is only a 5% chance of a false positive
QTL for any LPR score exceeding its chromosome-wise
threshold. In addition, given that the chromosomes in our
F
2
population were in linkage equilibrium, only one false
positive might be expected over the entire genome of 20
chromosomes. Thus the use of the chromosome-wise
threshold values avoids the vast majority of false positive
results while suggesting QTL sites that would not be dis-
covered with the use of the much more stringent genome-
wide threshold values that basically are designed to elim-
inate the possibility of false positive results [21,22]. How-
ever, as in all QTL studies such as this one, additional
studies are invaluable for confirming any putative QTLs
identified.
WT =+ + +
μ
aX dX e
ad
,
(1)
Genetics Selection Evolution 2009, 41:41 />Page 4 of 12
(page number not for citation purposes)
Relationship QTL scans
To search for relationship QTLs (relQTLs) affecting the
association of the physical activity traits with body weight,
we used a modification of the regression approach
described above. Specifically in these analyses, we
regressed the additive and dominance index values, WT,
and the interactions of body weight with the index values
on distance, duration, and speed. Essentially this is an
analysis of covariance model where the interest is in the
interactions [13]. The model for this approach is repre-
sented by the following:
where y = the dependent variable and the terms to the
right of the operator '|' are partialed out and do not enter
into the significance tests and the other terms have been
previously defined. Separate analyses were done for the
three physical activity traits, and LPR scores were gener-
ated as described above and compared to threshold values
calculated from permutation procedures run for each trait.
Tests for two relQTLs per chromosome as well as sex-spe-
cific relQTL effects also were conducted as before.
For those relQTLs affecting two or all three physical activ-
ity traits but co-localizing in the same or similar positions,
it was useful to conduct pleiotropy tests. We used the pro-
cedure outlined by Knott and Haley [23] to test whether
separate relQTLs were potentially a common relQTL with
pleiotropic effects on several traits. To implement this
procedure, we first calculated residual sums of squares
from the canonical correlation runs at the most probable
location for the individual activity traits to be tested and
pooled them into one matrix. We then ran another canon-
ical correlation procedure for the combined traits to
obtain a residual sum of squares matrix at the most prob-
able joint location for a relQTL. The pleiotropy test
involved a comparison of the determinants of the two
matrices with a likelihood-ratio statistic [23]. A significant
chi-square value in this test suggested that the QTLs were
separate whereas a non-significant value suggested that
there could be just one QTL with pleiotropic effects on
multiple traits.
For all relQTLs, we were able to quantify genotype-specific
associations of the physical activity traits with body
weight. This was done by calculating regressions of the
physical activity traits on body weight for the HH, CH,
and CC genotypes at the SNP loci closest to the locations
of all relQTLs. Testing of these regressions was done via
individual t-tests evaluated at the conventional 5% signif-
icance level. The regressions and their associated coeffi-
cient of determination (r
2
) values were helpful in showing
the differences in the associations of the physical activity
traits with body weight produced by the three genotypes
at each relQTL locus.
Epistasis scan
One way in which relQTLs can affect the relationship
between two traits is by epistatically interacting with other
QTLs that differentially affect the traits. This phenomenon
is called differential epistasis and has been explained in
some detail, including with examples, by Cheverud
[24,14]. Therefore, to examine whether differential epista-
sis might account for the effects of the relQTLs, we
scanned the genome for their epistatic interactions with
other QTLs (epiQTLs) for the trait or traits (including body
weight) specifically affected by each of the relQTLs.
The scan was conducted at every location 2 cM apart on all
chromosomes (except that of the relQTL) via regression of
the trait values on the (fixed) additive and dominance
index values for the relQTL (X
ar
, X
dr
), the additive and
dominance index values at other locations (X
a
, X
d
), and
the interactions of the two sets of index values. These
interactions generated additive by additive (aa), additive
by dominance (ad), dominance by additive (da), and
dominance by dominance (dd) genotypic epistatic com-
ponents. This model we used was:
where the terms and symbols have already been defined.
Multivariate regression of the combined effects of the four
interaction terms generated a Wilk's lambda statistic with
its associated probability that was converted to an LPR
value used to test for the significance of overall epistasis.
Epistasis was considered present when the highest LPR
value on a given chromosome exceeded the appropriate
(trait- and chromosome-specific) threshold value previ-
ously used in testing for relQTLs. If overall epistasis was
indicated, we estimated the four individual epistatic com-
ponents from the regression model and tested them for
significance with conventional t-tests.
All significant epistatic interactions involving the relQTLs
were examined to discover whether they appeared to be
acting differentially on the traits. Differential epistasis was
assumed to occur for all epistatic interactions affecting
only one (activity or weight) trait, but not both traits. In
cases where the epistatic interactions were significant for
an activity trait and body weight, the direction and mag-
nitude of the four epistatic components for both traits
were inspected for potential differences that might indi-
cate differential epistasis. Ideally such comparisons of the
epistatic components should be done in a formal statisti-
cal test, although past studies have shown that epistatic
yaX dX eXX
ad ad
=+ + +
μ
**|,,,WT WT WT
(2)
y aaX X adX X daX X ddX X X X X X
ara ard dra drd ar dr a d
=+ + + +
μ
|,,,,
(3)
Genetics Selection Evolution 2009, 41:41 />Page 5 of 12
(page number not for citation purposes)
pleiotropic effects tend to be restricted to single traits
[25,13].
Results
Additional file 1 provides basic statistics for all four traits
used in the analyses. On average, the F
2
mice weighed
about 26 grams and ran over 6 km each day during a 330-
minute span that generated a speed of 19 meters per
minute. As judged by their coefficients of variation (stand-
ard deviation/mean, not shown), distance and duration
are considerably more variable than speed or body
weight. The three correlations between each pair of phys-
ical activity traits are positive in sign and moderate to high
(especially the 0.92 for distance and duration) in magni-
tude, and all are statistically significant. However body
weight shows no significant association with any of these
three activity traits.
Body weight QTLs
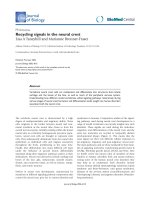
The results of the scan for direct-effect QTLs affecting body
weight are shown in Additional file 2 and are illustrated in
Figure 2 (circles). We have designated each QTL as WT fol-
lowed by its chromosome number and an extension to
indicate whether the QTL is the first or second on the
chromosome. Seven QTLs were discovered in this scan,
including two each on chromosomes 11 and 17. Only the
QTL on chromosome 13 (WT13.1) appears to co-localize
with any of the QTLs previously discovered for distance,
duration, or speed (Figure 2). Thus the direct-effect QTLs
for body weight appear to be generally distinct from those
influencing the physical activity traits in this population
of mice. Five QTLs are significant at the experiment-wise
level whereas two (WT1.1 and WT17.1) have LPR values
that reached chromosome-wise significance. The QTLs
contribute individually from 3.3 to 6.3% and collectively
Locations on each of the chromosomes of direct-effect QTLs for the physical activity/weight traits, relationship QTLs that affect the association of the activity traits and weight, and epistatic QTLs involved in interactions with the relationship QTLsFigure 2
Locations on each of the chromosomes of direct-effect QTLs for the physical activity/weight traits, relation-
ship QTLs that affect the association of the activity traits and weight, and epistatic QTLs involved in interac-
tions with the relationship QTLs. Direct-effect QTLs = circles, relationship QTLs = triangles, epistatic QTL = squares, DS
= distance, DU = duration, S = speed, and W = body weight.
1 2 3 4 5 6 7 8 9 10
11 12 13 14 15 16 17 18 19 X
DU
DS
DS, DU
DS,DU,S,W
DS, DU
DS, S
DS, S
S
S
S
S
S
W
W
W
W
W
W
DU
S
S
DS, DU
DU
DS, DU
S
S
DS, DU
DU
S
S
S
S
DU
DS, DU, S
DU
DS
DU
DU
W
S
S, W
S
DU
S,W
W
DS, DU
W
S
S
DS, S, W
DS
S
DU, S
DS, DU, W
S
W
DU, W
DU
DU
W
DU
DU
S
DU
S
S
S
DS, DU
Genetics Selection Evolution 2009, 41:41 />Page 6 of 12
(page number not for citation purposes)
27% (adjusted coefficient of multiple determination from
multiple regression) of the total variance of body weight.
Additive genotypic effects are significant for five body
weight QTLs, their absolute values averaging 0.33, or
about 1/3 of a standard deviation (Additional file 2). The
signs of these significant a values are mixed, suggesting
that for different QTLs, either the C57L/J (positive values)
or C3H/HeJ (negative values) alleles increased body
weight. Four QTLs also show significant dominance gen-
otypic values, the average of their absolute values of 0.30
being nearly the same as that for the additive effects. The
four significant d values are also positive in sign, indicat-
ing that body weight in the CH heterozygotes is greater
than that for the average of the two homozygotes. Two
QTLs (WT11.2 and WT17.1) exhibit overdominance in
which the heterozygote is greater than either homozygote.
Relationship QTLs
A total of 19 relQTLs were discovered affecting one or
more of the three activity traits (Additional file 3; Figure 2,
triangles). These relQTLs are located on 15 of the 20 chro-
mosomes, including two each on chromosomes 4, 7, 8,
and X. Three relQTLs (on chromosomes 8, 13, and 15)
map within the confidence interval for the activity traits or
for body weight (Figure 2). All LPR scores were significant
at the chromosome-wise level, none reaching genome-
wise significance. Fifteen of the 19 relQTLs affect the rela-
tionship between body weight and one of the three phys-
ical activity traits, three (Act4WT.1, Act4WT.2, Act7WT.1)
affect two traits (distance and duration), and one relQTL
(Act19WT.1) significantly affects all three traits. Both
relQTLs on chromosome X (ActXWT.1 and ActXWT.2) are
sex-specific, affecting males only; all other relQTLs affect
both sexes.
Additional file 4 shows the results of regressions of the
physical activity traits on body weight for the three geno-
types (HH, CH, and CC) at the SNP marker nearest each
of the positions of the 19 relQTLs. As may be seen, there is
considerable diversity in the patterns of these regressions
among the relQTLs. For the HH, CH, and CC genotypes,
respectively, there are 11, 5, and 11 significant regression
coefficients, suggesting that homozygotes tend to show a
greater association of the physical activity traits with body
weight than do heterozygotes. Judging by the signs of the
significant regressions, this association often tends to be
positive for the CC (6+, 5-) and CH (4+, 1-) genotypes but
negative for the HH genotype (4+, 7-). Regression patterns
for the four QTLs affecting more than one trait are similar
in all cases. Coefficients of determination (r
2
values) range
from 0 to as high as 0.15, and for those associated with
significant regressions, average 8%, 5%, and 9%, respec-
tively, for the HH, CH, and CC genotypes.
The genotype-dependent nature of the regressions of the
activity traits on body weight is illustrated in Figure 3 for
three different QTLs. Figures 3A and 3B show that the
effect of Act19WT.1 on the relationship of both distance
and duration with body weight is nearly identical (regres-
sion of HH positive, CC negative). However, Act15WT.1
(Figure 3C), which also affects the duration/body weight
relationship, shows quite a different pattern (regression of
CC, CH positive, HH negative). Figure 3D illustrates yet
another pattern in which heterozygotes at the Act17WT.1
locus show a negative, and homozygotes a positive, asso-
ciation of body weight with speed.
Epistasis
Additional file 5 gives the results of the genome scan for
QTLs showing epistasis with each of the relQTLs. Because
of the lack of heterozygosity for loci on the X chromo-
some in males as well as the reduced sample available for
male mice, we tested only the 17 autosomal relQTLs for
epistasis, eliminating the two male-specific relQTLs on the
X chromosome. This scan uncovered a total of 40 signifi-
cant interactions involving 31 epiQTLs with all autosomal
relQTLs except the two on chromosome 7 (Act7WT.1 and
Act7WT.2). The LPR value for one epistatic combination,
Act15WT.1 with Act12epi.1, reached genome-wide signifi-
cance whereas all others are significant at the chromo-
some-wise level only. Seven of the relQTLs interact with
more than one epiQTL, this being noticeable for
Act10WT.1 (7 epiQTLs) and especially for Act19WT.1 (9
epiQTLs).
The epiQTLs are widely dispersed throughout the genome;
all chromosomes except 9 and 13 contain at least one
epiQTL and two chromosomes, 12 and 16, contain three
each (Figure 2, squares). Locations of seven of the 31
epiQTLs are at or near those for the direct-effect QTLs for
weight or the physical activity traits. Also, another nine
epiQTLs co-localize with relQTLs at identical or very simi-
lar positions on these chromosomes (see Figure 2), sug-
gesting that these epiQTLs in fact are the same as the
relQTLs. Of these nine epiQTLs, six exhibit reciprocity in
the significant epistatic interactions between QTLs seen
on chromosomes 3 and 19, 4 and 11, and 10 and 15 (for
example, note the interactions of Act3WT.1 with
Act19epi.1, and Act19WT.1 with Act3epi.1 in Additional
file 5). This provides additional evidence of the common-
ality of these particular epiQTLs with the relQTLs.
With regard to the traits involved in epistasis, seven of the
17 autosomal relQTLs exhibited epistatic interactions
with 11 different epiQTLs that significantly affected body
weight. Although distance and duration are highly corre-
lated, significant epistatic interactions were much more
prevalent for duration (five relQTLs with 13 epiQTLs) than
for distance (three relQTLs with five epiQTLs). Act10WT.1
Genetics Selection Evolution 2009, 41:41 />Page 7 of 12
(page number not for citation purposes)
had a particularly strong effect on duration through its
interactions with six other epiQTLs. The number of epi-
static interactions affecting speed is similar to that for
duration, involving six relQTLs and 10 epiQTLs. Clearly,
epistatic effects are acting differentially because all 17
relQTLs affecting a specific activity trait (Additional file 4)
exert epistatic effects only on that trait or on body weight,
not both. This suggests that differential epistasis can
account for the variation among the genotype-specific
associations of the activity traits and body weight exhib-
ited by the relQTLs (Additional file 4).
Two examples of the epistatic interactions of relQTLs and
epiQTLs are illustrated in Figure 4. Each example includes
a bar diagram that shows the epistatic effects of the two
QTLs on the physical activity trait significantly affected,
and two additional line plots that illustrate the effect on
the variance (arrows) of both the affected physical activity
Examples of the variation in the effects of each of the genotypes at relationship QTLs on the association between physical activity and body weightFigure 3
Examples of the variation in the effects of each of the genotypes at relationship QTLs on the association
between physical activity and body weight. HH = C3H/HeJ homozygotes, CCF = C57/J homozygotes, CH = heterozy-
gotes; plots A and B represent pleiotropic effects of the same relationship QTL on distance and duration; plot C illustrates the
effect of a different relationship QTL on duration and plot D illustrates the effect of yet another relationship QTL on speed.
Genetics Selection Evolution 2009, 41:41 />Page 8 of 12
(page number not for citation purposes)
trait and on body weight from the perspective of the
relQTL. In the first panel in Figure 4A, note the increase in
duration from the HH to the CC genotype at the
Act19WT.1 locus, but only when another epistatic locus
on chromosome 1 (Act1epi.1) is homozygous, not hetero-
zygous. This epistasis is also seen in the second plot where
the lines connecting each of the genotypes are not parallel.
The second plot also shows that the variance of duration
is greatest for the HH compared to the CH or CC geno-
types at the relQTL locus. Body weight was not signifi-
cantly affected by the interactions of this QTL pair, and
this is reflected in the roughly parallel lines in the third
plot (Figure 4A) and also the more uniform variances
throughout the genotypes. Figure 4B shows that
Act13WT.1 affects speed and exhibits underdominance
when associated with HH or CH genotypes, but overdom-
inance when associated with the CC genotype, at another
QTL on chromosome 6. Note again the lack of parallel
lines for speed in the second plot but the roughly parallel
lines for body weight. In both examples, therefore, epista-
sis affects the physical activity trait differently from body
weight, illustrating differential epistasis.
Discussion
The purpose of this study was to test for a genetic (pleio-
tropic) association between the three physical activity
traits and body weight in an F
2
population of mice. To this
end, first we mapped body weight QTLs to see whether
they might be located near some of the QTLs for the phys-
ical activity traits previously mapped [10]. As will be
recalled, only one of the seven body weight QTLs
(WT13.1) co-localized with a QTL affecting the activity
traits. Thus at least in this population of mice, it seems
clear that the direct-effect QTLs for the physical activity
traits are largely independent from those for body weight.
However, this conclusion holds only for body weight at
the age (average of 12 weeks) the mice were measured and
may not be true for weight at other ages. The number of
body weight QTLs we discovered was necessarily limited,
however, because the inbred progenitors for this particu-
lar population were selected on the basis of their diver-
gence in physical activity traits, not body weight. Many
more QTLs for body weight measured at various ages have
been identified in other populations of mice [26-29]. So
we may eventually find that some of these body weight
QTLs also exert pleiotropic effects on physical activity
traits.
Two examples of epistatic effects on the association between physical activity and body weightFigure 4
Two examples of epistatic effects on the association between physical activity and body weight. Each example
includes a bar diagram that shows the epistatic effects of two QTLs on the physical activity trait significantly affected, and two
additional line plots that illustrate the effect on the variance (arrows) of both the affected physical activity trait and on body
weight from the perspective of the relQTL; note that the physical activity trait is more affected than weight, illustrating differen-
tial epistasis.
Genetics Selection Evolution 2009, 41:41 />Page 9 of 12
(page number not for citation purposes)
Indirect QTL effects on physical activity
The search for QTLs that indirectly affected the physical
activity traits via their relationship with body weight was
quite successful, uncovering 19 different relQTLs spread
throughout the genome. At least 15 (79%) of these
relQTLs appeared to be distinct from the direct-effect QTLs
for the activity traits [10] or for body weight (presented
above). This proportion of independent relQTLs is similar
to that of 70% (16 of 23) discovered by Cheverud et al.
[12] for a number of mouse mandibular traits with overall
mandible length, but is considerably higher than that of
27% (3 of 11) found by Pavlicev et al. [13] affecting the
association between limb bone lengths and body weight
in an intercross population of mice. Pavlicev et al. [13]
suggested that since their progenitor strains had been cre-
ated by selection for large (LG/J) and for small (SM/J)
body weights, this may have increased the chance of
detecting body weight QTLs that also pleiotropically
influenced limb bone lengths. The progenitor strains used
to generate our intercross population did not have this
history of selection, so perhaps our choice of strains and
the traits we measured accounted for the high proportion
of independent relQTLs we found. Whatever the case, the
15 relQTLs were concealed in the original scans for direct-
effect QTLs because of their opposing effects in mice with
large versus small body weights. Their discovery substan-
tially increases the total number of QTLs known to affect
the physical activity traits in this population of mice.
Given the initial calculation of the near zero, non-signifi-
cant phenotypic correlations of body weight with each of
the physical activity traits in the total population, it was
interesting to see what patterns of genotypic-specific
regressions the relQTLs might exhibit. In principle the
overall phenotypic independence of body weight from the
activity traits could be achieved with some relQTLs show-
ing all positive, and some all negative, regressions
(although of different magnitudes for the three geno-
types). However, instead, each of the relQTLs had at least
one genotype that showed a positive, and one a negative,
regression of the activity trait or traits on weight, so body
weight showed overall independence at each of these loci.
Many (42 of 72) of these regressions actually were not sig-
nificant, and although this may be partly a consequence
of limited statistical power especially for the homozygotes
that had lower sample sizes, it is another indication of the
general independence of body weight from the activity
traits. In contrast, all 75 regressions of limb lengths on
body weight calculated by Pavlicev et al.[13] for each of
three genotypes at the relQTLs they discovered were signif-
icant. In addition, the coefficients of determination they
calculated averaged 0.23, much higher than that of 0.07
for the significant regressions for the physical activity
traits (Additional file 4). Not surprisingly, body weight
clearly has a greater association with limb lengths [30,13]
than with the physical activity traits we measured in this
specific population of mice.
Among the relQTLs, there was no consistent pattern as to
which genotype produced a positive, zero, or negative
association of the physical activity traits with body weight.
There were a few trends previously detailed such as the
heterozygotes showing the fewest number of significant
regressions, but the effect of a particular genotype at a
relQTL on the activity/weight association could not be
predicted. However, within those relQTLs that affected the
association of body weight with more than one of the
physical activity traits, the pattern of genotype-specific
regressions was consistent across the traits. As an example,
for Act19WT.1 the HH and CH genotypes produced posi-
tive, and the CC genotype negative, regressions for dura-
tion, distance, and speed (Additional file 4). These types
of consistent pleiotropic effects produce positive genetic
covariances that are compatible with the moderate to high
phenotypic correlations among the activity traits. Similar
patterns of variability in regressions among relQTLs but
consistency within relQTLs were found by Pavlicev et al.
[13], so may be generally expected in future studies
designed to search for relQTLs.
The discovery of the relQTLs in this population of mice is
of evolutionary interest because it shows that there is
genetic variation in their pleiotropic effects on body
weight and the physical activity traits upon which natural
selection can act. From the various regression patterns
exhibited by the relQTLs, it can be predicted that selection
for a particular activity trait such as speed would favor dif-
ferent genotypes with different body weights (Additional
file 4, Figure 3). Furthermore, since body weight itself
changes, this can result in an increase in the difference
among genotypic values of traits affected by these loci,
and thus in increases in their variability [13]. Selection
favoring genotypes with non-significant (zero) slopes
(Additional file 4) could lead to a complete loss of associ-
ation of body weight with physical activity.
Differential epistasis
We discovered 40 significant interactions of the relQTLs
with 31 separate epistatic QTLs that influenced the physi-
cal activity traits and body weight. These numbers are
quite comparable to the 40 epistatic interactions involv-
ing 33 epiQTLs found by Pavlicev et al. [13] in their anal-
ysis of the association of limb bone lengths with body
weight in an entirely different population of mice. In our
epistasis scan, Act19WT.1 alone accounted for 11 of the
40 significant interactions so it appears to be a particularly
important relQTL. It will be recalled that this relQTL was
the only one discovered that significantly affected the rela-
tionship of body weight with all three physical activity
traits (Additional file 3). Another relQTL, Act10WT.1,
Genetics Selection Evolution 2009, 41:41 />Page 10 of 12
(page number not for citation purposes)
interacted with seven different epiQTLs, affecting duration
in six of these cases. Therefore, of the 13 epistatic interac-
tions affecting duration, about half involved just this one
relQTL. However, with regard to multiple interactions,
these two relQTLs were exceptions because all other
relQTLs typically interacted with only one or two (or at the
most, three) epiQTLs.
Each of the interactions significantly affected either a
physical activity trait or body weight, but not both, sug-
gesting differential epistasis. In most (28) of the interac-
tions a physical activity trait rather than body weight was
affected even though weight was involved in the effects
produced by all relQTLs. Wolf et al. [25] have also found
that the majority of epistatic effects on early- and late-
developing skull traits in a population of mice were
restricted to single traits, so epistasis may often act in a dif-
ferential fashion. In any event, differential epistasis
appears to satisfactorily account for variation in the geno-
type-specific associations of the physical activity traits
with body weight for each of the relQTLs we discovered.
As explained earlier, epistatic interactions involving the
relQTLs that produce significant changes for each geno-
type in the variances of one trait but not the other produce
differences in the relationships of these traits as we have
documented with regressions.
Although 31 epiQTLs were found in the epistasis scans, it
is clear that many of them are not unique. As previously
detailed, as many as 10 of the epiQTLs map near relQTLs
and another seven map near direct-effect QTLs for the
physical activity traits or for body weight (Figure 2). This
suggests that at most 14 of the epiQTLs, or less than half of
those discovered, appear to be independent from the
relQTLs or direct-effect QTLs. It is also possible that some
of the epistatic pairs of QTLs we found may be the same
as those previously discovered by Leamy et al. [11] in their
genome scan for epistatic interactions affecting the three
physical activity traits in this same population of mice.
Therefore, we reviewed those interactions listed as signifi-
cant at the 0.001 level for each of these traits given in
Leamy et al. ([11]; Additional files 2, 3, 3) to see whether
any matched our results (Additional file 5). None of the
10 interactions for distance or the 12 interactions for
duration given by Leamy et al.[11] was the same as those
we discovered in this study. For speed, however, five of the
eight previously found to be significant appear to be the
same as five of our interactions, including epiQTLs on
chromosomes 10, 11 (perhaps the same as Act11WT.1),
12, 18 and 19. It is not at all clear why some of the previ-
ous interactions found for speed but not distance or dura-
tion match those we found, but it emphasizes the
difference between our scan that searched for interactions
with each of the relQTLs compared to the scan done pre-
viously for every two locus combination on each pair of
chromosomes.
Clearly, it seems that the QTLs we have uncovered act
directly, indirectly, or in both ways on the activity and
weight traits. We have classified them into three categories
(direct-effect QTLs, relQTLs, and epiQTLs) based on the
approach we used for their discovery. However, beyond
this approach, this distinction may be arbitrary since a
direct-effect QTL in one population could well turn out to
be a relQTL or an epiQTL in another population. All such
QTLs collectively contribute to the phenotypic values and
variability of the activity and weight traits, suggesting a
complex genetic basis for these traits.
Candidate genes
Although the relQTLs (and epiQTLs) we have found pro-
vide approximate locations throughout the genome for
genes that affect the physical activity traits via their associ-
ation with body weight, the identity of these genes is pres-
ently entirely unknown. Hundreds of potential candidate
genes lie within the confidence intervals of many of these
QTLs, so it would seem presumptuous to attempt to list
possible candidates for them. Some consideration of
potential candidate genes seems warranted, however, for
one specific relQTL: Act19WT.1. Act19WT.1 exhibited the
highest LPR value that in fact nearly reached genome-wise
significance, and in addition, this relQTL showed the
greatest number of significant epistatic interactions (recall
Additional file 5 results). Therefore, we searched the
Mouse Genome Informatics database [31] for potential
candidate genes in the area of this relQTL. However, the
possibilities listed below are only meant to be illustrative
and in no way are exhaustive.
For Act19WT.1, one potential candidate gene is IGHMBP,
immunoglobulin mu binding protein-2 (chromosome
19, 0 cM). This gene affects the cardiovascular and muscle
systems as well as growth, and is apparently essential for
cardiomyocyte maintenance necessary to meet respiratory
demands [32]. Another possibility is SCYL1, Scy1-like
1(chromosome 19, 6 cM), that affects muscle tone, behav-
ior, growth/size, and the nervous system [33]. A third and
perhaps most interesting potential candidate gene is
ACTN3, actinin alpha 3 (chromosome 19, 3 cM). In
humans, a nonsense polymorphism at this locus is quite
common and is associated with reduced muscle strength
and sprint performance [34,35]. In mice, knockouts
exhibit reduced force generation, apparently because of a
shift from the properties of fast muscle fibers to those of
slow muscle fibers [36]. Interestingly, an isoform of
ACTN3, actinin alpha 2 (Actn2 on chromosome 13, 7 cM)
that has similar physiological functioning as ACTN3, is
located near the significant single-effect QTLs for the
Genetics Selection Evolution 2009, 41:41 />Page 11 of 12
(page number not for citation purposes)
physical activity traits (DIST13.1, 11 cM; DUR13.1, 11 cM;
SPD13.1, 9 cM) we discovered earlier [10].
These few examples provide some insight into the range of
genes that might affect the relationship between physical
activity and body weight. They also illustrate the complex-
ity of this relationship and how difficult it is to even know
which systems (nervous, muscular, cardiovascular, endo-
crine, etc.) may be involved. However, some recent stud-
ies by Good and colleagues [37-39] provide clear evidence
of one example in which the nervous and endocrine sys-
tems are involved in the linkage between body weight
with physical activity. Good et al. [37] have shown that
NHLH2, nescient helix loop helix 2, is expressed in neu-
roendocrine tissues such as the pituitary and hypothala-
mus and acts to reduce physical activity in mice that
eventually leads to adult-onset obesity. NHLH2 may exert
its effects by regulating the motivation for voluntary phys-
ical activity, but whatever the actual pathway, this gene
clearly produces a negative association between activity
and body weight. NHLH2 is located on chromosome 3,
although not in the area of the relQTL (Act3WT.1) that we
discovered on this chromosome.
Conclusion
We discovered a number of relQTLs in our population of
mice that provided evidence for a genetic association of
physical activity and body weight. Genotypes at these loci
exhibited variously positive, zero, and negative activity/
weight associations, and their individual and collective
net effect produced overall independence of body weight
from physical activity. However, even where plots of phys-
ical activity versus body weight show no association, some
of the variability we typically see in such plots may be due
to unique combinations of genotypes carried by individu-
als at their relQTLs. Since we have seen that the relQTLs
appear to be generated from differential epistatic effects, it
may prove very difficult to predict the level of physical
activity an individual with a specific body weight might
voluntarily achieve. Our discovery of relQTLs in this pop-
ulation of mice also suggests that the genetic architecture
of physical activity and its relationship to body weight
may turn out to be even more complex than we had imag-
ined.
Competing interests
The authors declare that they have no competing interests.
Authors' contributions
LJL performed the data analysis, wrote and prepared the
manuscript for submission. JTL was the principal supervi-
sor of the study and assisted with preparation of the man-
uscript. DP reviewed the manuscript and all authors read
and approved the final manuscript.
Additional material
Additional file 1
Basic statistics for body weight and physical activity traits. Shown are
the means and standard deviations for distance, duration, and speed in
the 310 F
2
mice, and pairwise correlations among these four traits. * = P
< 0.05; ** = P < 0.01
Click here for file
[ />9686-41-41-S1.pdf]
Additional file 2
QTLs for body weight. Shown are the locations, confidence intervals
(CI), LPR scores (log
10
Prob
-1
), percentage of the variation explained
(%), and standardized additive (a) and dominance genotypic values (d)
for QTLs on all chromosomes (Ch) significantly affecting body weight.
Locations are given as map distances from the nearest proximal marker
(Marker Dist) and from the centromere (Cent. Dist), and confidence
intervals are expressed from the centromere; all LPR values are significant
at the 5% chromosome-wise level and those exceeding 3.80 are significant
at the 5% experiment-wise level. * = P < 0.05; ** = P < 0.01.
Click here for file
[ />9686-41-41-S2.pdf]
Additional file 3
Relationship QTL (relQTL) significantly affecting the association of
the physical activity traits (distance, duration, or speed) with body
weight. Locations of these relQTL on each chromosome (Chr) are shown
in terms of the distance in cM proximal (-) or distal (+) to the nearest
SNP marker and from the centromere; support intervals around the loca-
tions are expressed as cM from the centromere; LPR (log of the probabil-
ity) values are derived from single trait analyses, or where more than one
trait is pleiotropically affected, from multiple trait analyses; relQTLs on
chromosome X affect males (denoted by M subscripts) only.
Click here for file
[ />9686-41-41-S3.pdf]
Additional file 4
Regressions (b) of the physical activity traits on body weight for C3H/
HeJ homozygotes (HH), C57L/J homozygotes (CC) and heterozygotes
(CH) at each of the relQTLs. r
2
= coefficients of determination; * = P <
0.05; ** = P < 0.01
Click here for file
[ />9686-41-41-S4.pdf]
Additional file 5
Epistatic QTLs (epiQTLs) that significantly interact with the relQTLs
to affect the physical activity traits (distance, duration, or speed) or
body weight. Locations of these epiQTL on each chromosome (Chr) are
shown in terms of the distance in cM proximal (-) or distal (+) to the
nearest SNP marker and from the centromere; support intervals around
the locations are expressed as cM from the centromere; LPR = log of the
probability
Click here for file
[ />9686-41-41-S5.pdf]
Genetics Selection Evolution 2009, 41:41 />Page 12 of 12
(page number not for citation purposes)
Acknowledgements
We would like to express our appreciation to Jessica Moser, Sarah Carter,
Matt Yost, Anna Vordermark, Amy Kleinfehn-Knab, Robert Bowen, Felicia
Dangerfield-Persky, Sean Courtney, and Alicia Trynor for their technical
expertise, the Vivarium staff for their animal husbandry skills, and two anon-
ymous reviewers for useful suggestions for revision of the paper. This work
was supported in part by grants from the National Institutes of Health
(NIDDK DK61635 to JTL, NIAMS AR050085 to JTL and LJL, and NIDDK
DK076050 to DP).
References
1. Metallinos-Katsaras ES, Freedson PS, Fulton JE, Sherry B: The asso-
ciation between an objective measure of physical activity
and weight status in preschoolers. Obesity 2007, 15:686-694.
2. Butler RN, Davis R, Lewis CB, Nelson ME, Strauss E: Physical fit-
ness: benefits of exercising for the older patient. Geriatrics
1988, 53:46-62.
3. Chakravarthy M, Booth F: Eating, exercise, and "thrift" geno-
types: connecting the dots toward an evolutionary under-
standing of modern chronic diseases. J Appl Physiol 2004,
96:3-10.
4. Manson JE, Skerrett PJ, Greenland P, VanItalie B: The escalating
pandemics of obesity and sedentary lifestyle. A call to action
for clinicians. Arch Intern Med 2004, 164:249-258.
5. American Heart Association: Heart and stroke statistical
update. Dallas, TX 2002.
6. Vainio H, Bianchini F: IARC handbooks of cancer prevention: Weight con-
trol and physical activity Volume 6. Lyon, France: IARC; 2002.
7. Mokdad AH, Ali H, Marks JS, Sroup DF, Gerberding JL: Actual
causes of death in the United States, 2000. J Amer Med Assoc
2004, 291(10):1238-1245.
8. Teran-Garcia M, Rankinen T, Bouchard C: Genes, exercise,
growth, and the sedentary, obese child. J Appl Physiol 2008,
105:988-1001.
9. Crespo CJ, Garcia-Palmieri M, Sorlie P, Perez-Perdomo Rosa, McGee
DL, Smit E, Sempos C, Lee IM: The relationship between physical
inactivity, body weight, and all cause mortality in Puerto
Rican men: Results from the Puerto Rico Heart Health Pro-
gram. Ann Epidemiol 2002, 12:543-552.
10. Lightfoot JT, Turner MJ, Pomp D, Kleeberger SR, Leamy LJ: Quanti-
tative trait loci (QTL) for physical activity traits in mice. Phys-
iol Genom 2008, 32:401-408.
11. Leamy LJ, Pomp D, Lightfoot JT: An epistatic genetic basis for
physical activity traits in mice. J Hered 2008, 99:639-646.
12. Cheverud JM, Ehrich TH, Vaughn TT, Koreishi SF, Linsey RB, Plet-
scher LS: Pleiotropic effects on mandibular morphology II: dif-
ferential epistasis and genetic variation in morphological
integration. J Exper Zool (Mol Dev Evol) 2004, 302B:424-435.
13. Pavlicev M, Kenney-Hunt JP, Norgard EA, Roseman CC, Wolf JB:
Genetic variation in pleiotropy: differential epistasis as a
source of variation in the allometric relationship between
long bone lengths and body weight. Evolution 2008, 62:199-213.
14. Cheverud JM: The genetic architecture of pleiotropic relations
and differential epistasis. In The Character Concept in Evolutionary
Biology Edited by: Wagner GP. New York: Academic Press;
2001:411-434.
15. Lightfoot JT, Turner MJ, Daves M, Vordermark A, Kleeberger SR:
Genetic influence on daily wheel running activity level. Physiol
Genom 2004, 19:270-276.
16. Haley CS, Knott SA: A simple regression technique for map-
ping quantitative trait loci in line crosses using flanking
markers. Heredity 1992, 69:315-324.
17. Falconer DS, Mackay TFC: Introduction to Quantitative Genetics Long-
man: Essex England; 1996.
18. Lander ES, Botstein D: Mapping mendelian factors underlying
quantitative traits using RFLP linkage maps. Genetics 1989,
121:185-199.
19. Lynch M, Walsh B: Genetics and Analysis of Quantitative Traits Sinauer
Associates: Sunderland, MA; 1998.
20. Churchill GA, Doerge RW: Empirical threshold values for quan-
titative trait mapping. Genetics 1994, 138:963-971.
21. Weller JI, Song JZ, Heyen DW, Lewin HA, Ron M: A new approach
to the problem of multiple comparison in the genetic dissec-
tion of complex traits. Genetics 1998, 150:1699-1706.
22. Rao DC: CAT scans, PET scans, and genomic scans. Genet Epi-
demiol 1998, 15:1-18.
23. Knott SA, Haley CS: Multitrait least squares for quantitative
trait loci detection. Genetics 2000, 156:899-911.
24. Cheverud JM: Modular pleiotropic effects of quantitative trait
loci on morphological traits. In Modularity
Edited by: Schlosser G,
Wagner GP. Chicago: The University of Chicago Press; 2004:132-153.
25. Wolf JB, Leamy LJ, Routman EJ, Cheverud JM: Epistatic pleiotropy
and the genetic architecture of covariation within early and
late-developing skull trait complexes in mice. Genetics 2005,
171:683-694.
26. Cheverud JM, Routman EJ, Duarte FAM, Swinderen BV, Cothran K,
Perel C: Quantitative trait loci for murine growth. Genetics
1996, 142:1305-1319.
27. Brockmann GA, Karatayli E, Haley CS, Renne U, Rottmann OJ, Karle
S: QTLs for pre- and postweaning body weight and body
composition in selected mice. Mamm Genome 2004, 15:593-609.
28. Rocha J, Eisen EJ, Van Vleck DL, Pomp D: A large sample QTL
study in mice. I: Growth. Mamm Genome 2004, 15:83-99.
29. Kenney-Hunt JP, Vaughn TT, Plestcher LS, Peripato A, Routman E,
Cothran K, Durand D, Norgard E, Perel C, Cheverud JM: Quantita-
tive trait loci for body size components in mice. Mamm
Genome 2006, 17:526-537.
30. Leamy LJ, Pomp D, Eisen EJ, Cheverud JM: Pleiotropy of quantita-
tive trait loci for organ weights and limb bone lengths in
mice. Physiol Genom 2002, 10:21-29.
31. Bult CJ, Eppig JT, Kadin JA, Richardson JE, Blake JA, the members of
the Mouse Genome Database Group: The Mouse Genome Data-
base (MGD): mouse biology and model systems. Nucleic Acids
Res 2008:D724-D728.
32. Maddatu TP, Garvey SM, Schroeder DG, Zhang W, Kim SY, Nichol-
son AI, Davis CJ, Cox GA: Dilated cardiomyopathy in the nmd
mouse: transgenic rescue and QTLs that improve cardiac
function and survival. Hum Mol Genet 2005, 14:3179-89.
33. Cabanes C, Bonilla S, Tabares L, Martinez S: Neuroprotective
effect of adult hematopoietic stem cells in a mouse model of
motoneuron degeneration. Neurobiol Dis 2007, 26:408-418.
34. Yang N, MacArthur DG, Gulbin JP, Hahn AG, Beggs AH, Easteal S,
North K: ACTN3 genotype is associated with human elite
athletic performance. Amer J Hum Genet 2003, 73:
627-631.
35. Roth SM, Walsh S, Liu D, Metter EJ, Ferrucci L, Hurley BF: The
ACTN3 R577X nonsense allele is under-represented in elite-
level strength athletes. Eur J Hum Genet 2008, 16:391-394.
36. MacArthur DG, Seto JT, Chan S, Quinlan KG, Raftery JM, Turner N,
Nicholson MD, Kee AJ, Hardeman EC, Gunning PW, Cooney GJ,
Head SI, Yang N, North KN: An Actn3 knockout mouse pro-
vides mechanistic insights into the association between
alpha-actinin-3 deficiency and human athletic performance.
Hum Mol Genet 2008, 17:1076-1086.
37. Good DJ, Coyle CA, Fox DL: Nhlh2: a basic helix-loop-helix
transcription factor controlling physical activity. Exerc Sport
Sci Rev 2008, 36:187-192.
38. Coyle CA, Jing E, Hosmer T, Powers JB, Wade G, Good DJ: Reduced
voluntary activity precedes adult-onset obesity in Nhlh2
knockout mice. Physiol Behav 2002, 77:387-402.
39. Johnson SA, Marín-Bivens CL, Miele M, Coyle CA, Fissore R, Good
DJ: The Nhlh2 transcription factor is required for female sex-
ual behavior and reproductive longevity. Horm Behav 2006,
46:420-427.