Báo cáo sinh học: " Accuracy of genomic breeding values in multi-breed dairy cattle populations" pps
Bạn đang xem bản rút gọn của tài liệu. Xem và tải ngay bản đầy đủ của tài liệu tại đây (502.63 KB, 9 trang )
BioMed Central
Page 1 of 9
(page number not for citation purposes)
Genetics Selection Evolution
Open Access
Research
Accuracy of genomic breeding values in multi-breed dairy cattle
populations
Ben J Hayes*
1
, Phillip J Bowman
1
, Amanda C Chamberlain
1
, Klara Verbyla
2
and Mike E Goddard
1,2
Address:
1
Biosciences Research Division, Department of Primary Industries Victoria, 1 Park Drive, Bundoora 3083, Australia and
2
Faculty of Land
and Food Resources, University of Melbourne, Parkville 3010, Australia
Email: Ben J Hayes* - ; Phillip J Bowman - ;
Amanda C Chamberlain - ; Klara Verbyla - ;
Mike E Goddard -
* Corresponding author
Abstract
Background: Two key findings from genomic selection experiments are 1) the reference
population used must be very large to subsequently predict accurate genomic estimated breeding
values (GEBV), and 2) prediction equations derived in one breed do not predict accurate GEBV
when applied to other breeds. Both findings are a problem for breeds where the number of
individuals in the reference population is limited. A multi-breed reference population is a potential
solution, and here we investigate the accuracies of GEBV in Holstein dairy cattle and Jersey dairy
cattle when the reference population is single breed or multi-breed. The accuracies were obtained
both as a function of elements of the inverse coefficient matrix and from the realised accuracies of
GEBV.
Methods: Best linear unbiased prediction with a multi-breed genomic relationship matrix
(GBLUP) and two Bayesian methods (BAYESA and BAYES_SSVS) which estimate individual SNP
effects were used to predict GEBV for 400 and 77 young Holstein and Jersey bulls respectively,
from a reference population of 781 and 287 Holstein and Jersey bulls, respectively. Genotypes of
39,048 SNP markers were used. Phenotypes in the reference population were de-regressed
breeding values for production traits. For the GBLUP method, expected accuracies calculated from
the diagonal of the inverse of coefficient matrix were compared to realised accuracies.
Results: When GBLUP was used, expected accuracies from a function of elements of the inverse
coefficient matrix agreed reasonably well with realised accuracies calculated from the correlation
between GEBV and EBV in single breed populations, but not in multi-breed populations. When the
Bayesian methods were used, realised accuracies of GEBV were up to 13% higher when the multi-
breed reference population was used than when a pure breed reference was used. However no
consistent increase in accuracy across traits was obtained.
Conclusion: Predicting genomic breeding values using a genomic relationship matrix is an
attractive approach to implement genomic selection as expected accuracies of GEBV can be readily
derived. However in multi-breed populations, Bayesian approaches give higher accuracies for some
traits. Finally, multi-breed reference populations will be a valuable resource to fine map QTL.
Published: 24 November 2009
Genetics Selection Evolution 2009, 41:51 doi:10.1186/1297-9686-41-51
Received: 8 July 2009
Accepted: 24 November 2009
This article is available from: />© 2009 Hayes et al; licensee BioMed Central Ltd.
This is an Open Access article distributed under the terms of the Creative Commons Attribution License ( />),
which permits unrestricted use, distribution, and reproduction in any medium, provided the original work is properly cited.
Genetics Selection Evolution 2009, 41:51 />Page 2 of 9
(page number not for citation purposes)
Background
Genomic selection refers to selection decisions based on
genomic estimated breeding values (GEBV) [1]. To calcu-
late GEBV, first a prediction equation based on a large
number of DNA markers, such as SNP (Single Nucleotide
Polymorphisms) markers, is derived. The effects of these
markers are estimated in a reference population in which
animals are both phenotyped and genotyped. In subse-
quent generations, animals can be genotyped for the
markers and the effects of the genotypes summed across
the whole genome to predict the GEBV. Recently, the
accuracy of GEBV predicted in this way has been evaluated
in experiments involving dairy cattle populations in the
United States, New Zealand, Australia, and the Nether-
lands [2-4]. These experiments used reference populations
of between 650 and 4,500 progeny-tested Holstein-Frie-
sian bulls, genotyped for approximately 50,000 genome-
wide markers. Accuracies of GEBV for young bulls whose
phenotypes were not used in the reference population
were between 0.4 and 0.82 across a range of traits.
A key finding from experiments conducted to date is that
the reference population must be very large to subse-
quently predict accurate GEBV. For example in one exper-
iment the gain in coefficient of determination of GEBV for
bulls in a validation data set on their daughter deviations
for net merit (R
2
) was investigated as the number of bulls
in the reference set increased from 1151 bulls to 3576
bulls [2]. There was a linear increase in R
2
with the
number of bulls in the reference set over this range, with
every 100 bulls adding 0.008 to R
2
[2]. Given this result,
assembling reference populations large enough to achieve
high accuracies of GEBV will present a major challenge for
breeds which have limited numbers of genotyped and
phenotyped animals.
One potential solution would be to use the prediction
equation from a breed with a large reference population
to predict GEBV in other breeds. However this strategy
does not hold much promise: it has been reported that
SNP estimates calculated from a Holstein-Friesian refer-
ence population did not produce accurate GEBV in Jersey
bulls, and vice versa [4]. Correlations ranged from -0.1 to
0.3 when the SNP effects from one breed were used to cal-
culate GEBV in another breed [4]. Genomic selection
relies on the assumption that phases of linkage disequilib-
rium (LD) between markers and quantitative trait loci
(QTL) are the same in selection candidates and the refer-
ence population. Thus one explanation for the across-
breed results is that the SNP are in LD with the QTL within
a breed, but not across breeds. Another experiment ana-
lysed the extent of LD within and between several beef
and dairy breeds, and concluded that for breeds as diver-
gent as Holstein and Jersey, markers would have to be 10
kb apart or less (much denser than the approximately 65
kb density used in the above experiments) for marker-QTL
phase to persist across breeds [5]. Another complication is
that the effect of QTL alleles may not be the same in dif-
ferent breeds and populations, or that the QTL may not be
segregating across breeds.
A different solution would be to use a multi-breed refer-
ence population, perhaps with limited numbers of sec-
ondary breeds, so that potentially all the genetic variants
segregating within and across breeds are captured. This
strategy has been evaluated using simulated data [6]. It
was demonstrated that using a multi-breed reference pop-
ulation with relatively few individuals of the second breed
could improve the accuracy of GEBV for that second
breed, provided markers were sufficiently dense and the
breeds were not too diverged.
In this work, we have investigated the accuracy of GEBV
for dairy production traits in Holstein dairy cattle and Jer-
sey dairy cattle when the reference population consists of
Holstein bulls only, Jersey bulls only, or bulls of both
breeds, with all bulls genotyped for approximately 50,000
markers. Accuracies were evaluated for two types of meth-
ods. The first set of methods estimated individual SNP
effects in the reference population, and then predicted
GEBV for selection candidates by summing the SNP
effects across the marker genotype they carried. The sec-
ond set of methods predicted breeding values by replacing
the average relationship matrix with the genomic relation-
ship matrix in best linear unbiased prediction (BLUP)
equations
Another significant challenge in the implementation of
genomic selection is to derive an expected accuracy of
GEBV, as is current practise for EBV in national genetic
evaluations [7]. In this study we have also investigated the
agreement of expected accuracies obtained as a function
of elements of the inverse coefficient matrix when a
genomic relationship matrix is used, with accuracies of
GEBV obtained by correlating GEBV and breeding values
for bulls with a large number of daughters in both single
breed and multi-breed populations.
Methods
Samples and SNP
One thousand and two hundred Holstein bulls and 400
Jersey bulls were genotyped with the Illumina Bovine50K
array, which includes 54,001 single nucleotide polymor-
phism (SNP) markers. The phenotypes used were de-
regressed Australian breeding values (ABV) for protein
yield, protein percentage, fat yield, fat percentage and
milk yield. The breeding values were de-regressed to
remove the contribution from relatives other than daugh-
ters [2]. All bulls had at least 80 daughters.
Genetics Selection Evolution 2009, 41:51 />Page 3 of 9
(page number not for citation purposes)
The following criteria and checks were applied to the
bull's genotypes. Mendelian consistency checks revealed a
small number of either sons discordant with their sires at
many (>1000) SNP or sires with many discordant sons.
These animals (17) were removed from the data set. In
addition, we omitted bulls for which more than 20% of
the genotypes were missing. One thousand, one hundred
and eighty one Holstein and 364 Jersey bulls passed these
criteria.
Criteria for selecting SNP were: less than 5% pedigree dis-
cordants (e.g. cases where a sire was homozygous for one
allele and progeny were homozygous for the other allele),
90% call rate, MAF>2%, Hardy Weinberg P < 0.00001.
Forty thousand and seventy seven SNP met all these crite-
ria. All SNP which could not be mapped or were on the X
chromosome were excluded from the final data set, leav-
ing 39,048. Parentage checking was then performed again,
and any genotype incompatible with the pedigree was set
as missing.
To impute missing genotypes, the SNP were ordered by
chromosome position, and the genotype calls and miss-
ing genotype information were submitted to fastPHASE
chromosome by chromosome [8]. The genotypes were
taken as those filled in by fastPHASE.
The Holstein reference (n = 781) and Jersey reference bulls
(n = 287) were those progeny tested before 2004. The
Holstein validation bulls were progeny tested during or
after 2004 (n = 400), and the Jersey validation bulls were
progeny tested after 2004 as well (n = 77).
Methods to predict GEBV
GBLUP
In a single breed population, if the number of QTL with
effects normally distributed with a constant variance is
high, then genomic selection is equivalent to replacing the
expected relationship matrix with the genomic relation-
ship matrix (G) estimated from DNA markers in the BLUP
equations [9-14]. We assume a model
where y is a vector of phenotypes,
μ
is the mean, 1
n
is a
vector of 1s, Z is a design matrix allocating records to
breeding values, g is a vector of breeding values and e is a
vector of random normal deviates ~ . Then g = Wu
where u
j
is the effect of the j
th
SNP, and V(g) = WW' .
Elements of matrix W are w
ij
for the i
th
animal and j
th
SNP,
where w
ij
= 0 - 2p
j
if the animal is homozygous 11 at the j
th
SNP, 1-2p
j
if the animal is heterozygous and 2 - 2p
j
if the
animal is homozygous 22 at the j
th
SNP. The diagonal ele-
ments of WW' will be where m is the
number of SNPs. If WW' is scaled such that
then .
This is very similar to a previous definition of G except
that it is rescaled so that the average of the diagonal ele-
ments is 1 [13]. Then breeding values for both pheno-
typed and non-phenotyped individuals can be predicted
by solving the equations for model 1 above:
where G is the realised relationship matrix calculated as
above, and is a genetic variance.
Variance components were estimated with ASREML [15].
The realised accuracy of GEBV was calculated as r(GEBV,
ABV) where r(GEBV, ABV) was calculated in each valida-
tion population (Holstein and Jersey) separately, and ABV
is the current Australian breeding value for bulls in the
validation population. The expected accuracy of GEBV for
the i
th
individual was calculated from the standard error of
the breeding value as .
BayesA and BAYES_SSVS
We also compared r(GEBV, ABV) from GBLUP to
approaches that estimate individual SNP effects and then
calculate GEBV as the sum of these effects. The alternatives
considered were BayesA and a Bayesian approach using
stochastic search variable selection, BAYES_SSVS [1,16].
BayesA makes a prior assumption that SNP effects are t-
distributed, while BAYES_SSVS makes a prior assumption
that a proportion
π
of the SNP effects are t-distributed and
1-
π
of the SNP effects have very close to zero [16]. Briefly,
the model fitted in both BayesA and BAYES_SSVS was:
where y is a vector of n daughter yield deviations corrected
for herd year season effects for each trait, X is (n × m) a
design matrix allocating records to the marker effects with
element X
ij
= 0, 1 or 2 if the genotype of animal i at SNP j
is 11, 12 or 22 respectively. Vector u is a (m × 1) vector of
y1 Zge
n
=++
μ
σ
e
2
σ
u
2
21
1
pp
jj
j
m
()−
=
∑
G
WW
=
=
∑
n
w
ii
i
n
’
1
V
g
()gG=
σ
2
ˆ
g Z’Z G Z’y
1
⎡
⎣
⎤
⎦
=+
⎡
⎣
⎢
⎢
⎤
⎦
⎥
⎥
[]
−
−
σ
σ
e
g
2
2
1
σ
g
2
accuracy stderror g
iig
=−(()/1
22
σ
y1’ XuZve
n
=+++…
Genetics Selection Evolution 2009, 41:51 />Page 4 of 9
(page number not for citation purposes)
SNP effects assumed normally distributed u
i
~ N(0, ),
e is a vector of random deviates where is the error var-
iance, v
i
is the polygenic breeding value of the i
th
animal,
with variance A , where A is the average relationship
matrix. In BayesA and BAYES_SSVS the prior for was
an inverse chi square distribution with 4.012 and 4.34
degrees of freedom, respectively. In BAYES_SSVS
π
was
0.05. Using the predicted SNP effects from each method,
we predicted GEBV in the validation sets as
.
Results and discussion
Genomic relationship between animals in reference and
validation sets
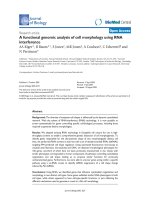
The genomic relationship matrix revealed a high level of
relationship within the Holstein breed and within the Jer-
sey breed, but very limited relationship between the
breeds (Figure 1). Jersey individuals had a greater level of
relationship within the breed than Holstein individuals,
which is consistent with the higher inbreeding level for
this breed [17]. The higher level of relationship could also
reflect the fact that there were the number of animals in
the Jersey reference population was smaller than that in
the Holstein reference population, so the average allele
frequency estimates used to modify W are closer to the
Holstein allele frequencies.
Realised and expected accuracies from GBLUP
When GBLUP was applied only within a breed (Holstein
reference only used to predict Holstein validation GEBV
and likewise for Jersey), realised and expected accuracies
were in reasonable agreement (Table 1) although the
expected accuracies did over-predict the realised accura-
cies in Holsteins, by 8% overage across the traits. Results
agreed better with the Jersey breed. GEBV accuracies can
be compared to the accuracy of information available
when the animals were born if the markers were not used.
This is a breeding value computed from the individuals
sire, maternal grandsire, and maternal grand sire breeding
values from 2003, before the bulls in the validation data
sets had any daughter information (this "sire pathway"
breeding value is often used for selection because dam
information may be missing or biased). GEBV accuracies
were considerably higher than the accuracies of "sire path-
way" breeding values for most traits.
It is important to note that the realised accuracy was cal-
culated as r(GEBV, ABV) in the validation data set, which
does not take into account the fact that the ABV have less
than perfect correlation with true breeding values. The
r(ABV, TBV) for the traits here was estimated as 0.92 by
ADHIS. If the realised accuracies reported here are
adjusted by this amount, the realised and expected accu-
racies for Holsteins are in better agreement. However, this
adjustment may also bias the realised accuracies upwards,
for example if the GEBV predicts the average relationship
component of ABV more accurately than the component
derived from individual SNP effects (eg Mendelian sam-
pling). It has been demonstrated that breeding values pre-
dicted with GBLUP contain a considerable genetic
relationship component [12].
When GBLUP was used to estimate GEBV using the com-
bined (Holstein and Jersey) reference population, the
σ
ui
2
σ
e
2
σ
a
2
σ
ui
2
GEBV v Xu=+
ˆ
ˆ
Genomic relationship between animals in reference and validation setsFigure 1
Genomic relationship between animals in reference and validation sets. Note that the genomic relationships have
been re-scaled such that all elements are positive.
Genetics Selection Evolution 2009, 41:51 />Page 5 of 9
(page number not for citation purposes)
realised accuracies of Jersey and Holstein GEBV were
slightly higher for some traits than those obtained from
the purebred reference populations (Table 2). However,
agreement between realised and expected accuracies was
weak with the expected accuracy over predicting consider-
ably the realised accuracy.
Realised accuracies from BayesA and BAYES_SSVS
Our GBLUP results agreed with previous results in that
when the Holstein SNP effects equations were used to pre-
dict Jersey GEBV, GEBV accuracies were close to zero, and
likewise when SNP effects derived only from the Jersey ref-
erence population were used to predict Holstein GEBV
(Table 3) [4]. The exception to this was fat percentage,
where low to moderately accurate GEBV could be pre-
dicted for Jersey individuals from a Holstein reference and
vice versa. This is likely because a QTL having a strong
effect on fat percentage segregates in both breeds and the
effect of the alleles on fat percentage follows the same
direction in both breeds, and by coincidence the effects of
the SNP associated with this polymorphism follow the
same direction in both breeds [18]. With a Holstein only
reference, Jersey GEBV from BayesA or Bayes_SSVS were
more accurate than GBLUP GEBV. However, with a Jersey
reference both the Bayesian methods and GBLUP gave
similar (zero) accuracy of Holstein GEBV. The difference
between these two results may reflect the small size of the
Jersey reference population.
Using a combined Holstein Jersey reference population
increased the accuracy of GEBV for both Holstein and Jer-
sey individuals by up to 13% (for fat percentage) over that
achieved with respective purebred reference populations
when BayesA or BAYES_SSVS were used to predict SNP
effects. When the combined reference population was
used, GEBV accuracies for the Jersey validation set were
higher from BayesA and BAYES_SSVS than from GBLUP
for all traits except protein kg. GEBV accuracies of Hol-
stein individuals were either the same or slightly lower
compared with a pure Holstein reference population.
There was very little difference in accuracy of GEBV from
BayesA and BAYES_SSVS.
Predicting breeding values by replacing the expected addi-
tive relationship matrix with the genomic relationship in
the usual BLUP equations is an attractive approach to
implement genomic selection for two reasons. GEBV
accuracies predicted in this way are the same as those from
BLUP methods, which predict individual SNP effects since
Table 1: Realised and expected accuracies of GEBV for GBLUP when a Holstein reference was used to predict SNP effects for Holstein
validation GEBV and when a Jersey reference was used to predict SNP effects for Jersey validation GEBV
Trait
Breed Method Accuracy Protein Fat Milk Prot% Fat%
Holstein Sire pathway* Realised 0.40 0.42 0.46 0.49 0.44
Jersey Sire pathway* Realised 0.47 0.48 0.52 0.55 0.63
Holstein GBLUP Realised 0.49 0.44 0.59 0.61 0.62
Expected 0.61 0.60 0.63 0.68 0.66
Jersey GBLUP Realised 0.53 0.41 0.56 0.63 0.71
Expected 0.54 0.54 0.52 0.57 0.56
*Calculated from the full Australian dairy herd improvement scheme (ADHIS) data set
Table 2: Realised and expected accuracies (in italics) of GEBV from GBLUP with a combined (Holstein and Jersey) reference
population
Trait
Validation set Method Accuracy Protein Fat Milk Prot% Fat%
Holstein GBLUP Realised 0.49 0.45 0.59 0.62 0.63
Expected 0.67 0.66 0.69 0.72 0.73
Jersey GBLUP Realised 0.53 0.42 0.56 0.61 0.70
Expected 0.67 0.66 0.68 0.70 0.71
Genetics Selection Evolution 2009, 41:51 />Page 6 of 9
(page number not for citation purposes)
the models are equivalent [2,3,12,13]. Furthermore, in
the GBLUP approach, expected accuracies of breeding val-
ues are readily calculated from the diagonal elements of
the inverse of the coefficient matrix. In populations of
Holstein and Jersey bulls genotyped for approximately
50,000 markers, we have demonstrated that expected
accuracies calculated in this way agree well with realised
accuracies calculated from the correlation between GEBV
and EBV in purebred populations. However when a multi-
breed reference population was used the expected accu-
racy considerably over predicted the realised accuracy.
Estimating using a G derived from a multi-breed pop-
ulation is likely to result in an artificially high genetic var-
iance. This is because the resulting estimate of will be
for a "base population" from which the breeds subse-
quently diverged. We did observe that estimates of
were higher when the multi-breed reference population
was used than when either purebred reference popula-
tions were used. The estimate of used to calculate the
expected accuracies could be corrected for the inbreeding
within in each breed subsequent to the base population.
For Holstein individuals this value (calculated as twice the
average off diagonal element in the genomic relationship
matrix, for Holstein-Holstein elements) was 0.012 while
for Jersey individuals it was 0.18. We recalculated the
expected accuracies within each breed using
, where F
j
was 0.012 and 0.18 for Jerseys
and Holsteins, respectively. This did reduce the expected
accuracies, particularly for Jerseys but not to values com-
parable to the realised accuracies (Table 4). Another pos-
sibility is that the between-breed relationships are over-
estimated due to inadequate marker density, resulting in
inflation of the accuracy. This will be a topic for future
research.
Our results demonstrate that using a reference population
of one breed to predict GEBV of another breed gave low
σ
e
2
σ
e
2
σ
e
2
σ
e
2
σσ
gj j g
F
,
()
22
1=−
Table 3: Accuracies of GEBV using either GBLUP or SNP effects from BAYESA or BAYES_SSVS to predict GEBV
Trait
Reference Set Validation set Method Protein Fat Milk Prot% Fat%
Holstein only Holstein GBLUP 0.49 0.44 0.59 0.61 0.62
BAYESA 0.47 0.44 0.59 0.59 0.71
BAYES_SSVS 0.47 0.44 0.59 0.58 0.70
Jersey GBLUP -0.06 -0.02 -0.02 -0.06 0.23
BAYESA 0.24 0.35 0.37 0.33 0.63
BAYES_SSVS 0.27 0.31 0.23 0.29 0.42
Jersey only Holstein GBLUP 0.03 -0.01 -0.01 0.03 0.11
BAYESA 0.01 0.02 -0.02 0.05 0.17
BAYES_SSVS 0.03 0.04 0.01 0.02 0.11
Jersey GBLUP 0.53 0.41 0.63 0.62 0.72
BAYESA 0.43 0.37 0.59 0.51 0.67
BAYES_SSVS 0.43 0.37 0.59 0.51 0.65
Holstein and Jersey Holstein GBLUP 0.49 0.45 0.59 0.61 0.62
BAYESA 0.47 0.44 0.55 0.54 0.69
BAYES_SSVS 0.46 0.45 0.55 0.54 0.70
Jersey GBLUP 0.53 0.42 0.56 0.60 0.73
BAYESA 0.47 0.51 0.58 0.67 0.82
BAYES_SSVS 0.47 0.51 0.58 0.67 0.82
Table 4: Expected accuracies of GEBV from GBLUP with a
combined (Holstein and Jersey) reference population, with re-
scaling of the additive genetic variance to account for inbreeding
since divergence of the two breeds
Trait
Validation set Protein Fat Milk Prot% Fat%
Holstein 0.67 0.65 0.68 0.71 0.72
Jersey 0.57 0.56 0.59 0.62 0.63
Genetics Selection Evolution 2009, 41:51 />Page 7 of 9
(page number not for citation purposes)
GEBV accuracies or equal to zero. However, combining
reference individuals across a breed to form the reference
populations resulted in accuracies of GEBV in purebred
validation sets comparable or exceeding that achieved
with a purebred reference population of the same breed.
With BayesA and BAYES_SSVS, the accuracy of GEBV for
most traits in the Jersey validation populations was greater
when a multi-breed reference population was used than
when a purebred Jersey population was used, by up to
13%. This suggests that for breeds with a small reference
population, combining with other breeds to form a multi-
breed reference is a possibility. Crossbred animals may
also be useful candidates for the reference population.
Indeed, a recent experiment demonstrated using a simu-
lated population that a crossbreed reference population
gave GEBV accuracies in selection candidates from con-
tributing pure breed populations almost as high as from
purebred reference populations of the same size [19].
Another study observed that using a combined Jersey Hol-
stein reference population gave good GEBV accuracies in
Holstein-Jersey cross bulls [4].
One hypothesis to explain the reasonable accuracy of
GEBV in purebred candidates when a multi-breed refer-
ence population is used with BayesA or BAYES_SSVS to
calculate SNP effects could be as follows. In order for an
SNP to have an effect in a multi-breed reference popula-
tion, it must be in LD with a QTL in both breeds, and
given the extent of LD across breeds for this to occur the
SNP must be very close to the QTL [5,6]. Hence SNP that
are in partial LD with a QTL in one breed are filtered, and
only SNP in high LD with the QTL receive an effect in the
prediction equation. This means that the SNP effect is
more likely to persist across populations and generations,
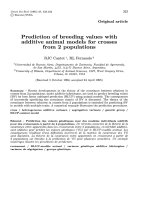
with as a result higher GEBV accuracies. Support for this
hypothesis is given in Figure 2. DGAT1 is a gene on bovine
chromosome 14 that harbours a mutation with a major
effect on fat percentage in milk in Holstein and Jersey
dairy cattle [18,20]. In the Holstein population analysed
in our work, the effect of this mutation is captured by two
SNP, one very close to the gene, and one ~200 kb away.
The SNP 200 kb from DGAT1 is in lower LD, but still has
an effect. However, the SNP very close to DGAT1 is a bet-
ter marker, with an effect likely to persist across popula-
tions and generations, because it is in such high LD with
the mutation. Using a multi-breed reference population
filters the SNP 200 kb from DGAT1, such that only the
marker very close to the gene still has an effect. The above
hypothesis is also supported in part by the results of
Zhong et al. [21]. These authors have used simulated data
to investigate factors affecting accuracy of genomic selec-
tion in populations derived from multiple inbred lines. In
their simulations of a "multi-line" population, a method
similar to BAYES_SSVS gave more accurate GEBV than
other methods when the markers were in high LD with
QTL of large effect, or when GEBV were predicted for
selection candidates several generations removed from
the reference population. Both these results suggest that in
their "multi-line" population, their Bayesian method was
SNP effects for fat% from BayesA in the region of the DGAT1 gene on chromosome 14, from either a Holstein reference pop-ulation, a Jersey reference population, or a combined reference populationFigure 2
SNP effects for fat% from BayesA in the region of the DGAT1 gene on chromosome 14, from either a Holstein
reference population, a Jersey reference population, or a combined reference population.
Genetics Selection Evolution 2009, 41:51 />Page 8 of 9
(page number not for citation purposes)
able to identify SNPs in high LD with the QTL and use
these in predicting GEBV.
Although BayesA and BAYES_SSVS resulted in GEBV with
slightly higher realised accuracies than GBLUP when a
multi-breed reference population was used, a drawback of
these methods is that there is no obvious way to calculate
expected accuracy of the breeding values obtained from
these methods for selection candidates with no pheno-
type. In practise, the accuracy of GEBV from GBLUP may
be close enough to those of BayesA and BAYES_SSVS, so
that the Bayesian methods could be used to calculate SNP
effects for predicting GEBV to maximise their accuracy,
while expected and slightly conservative accuracies are cal-
culated with GBLUP.
Our GEBV accuracies for the Jersey breed, even with a
purebred Jersey reference population, were surprisingly
high given the small size of the reference population. One
explanation could be the low N
e
of this breed and the high
relationships in Figure 1 in the Jersey population) [17].
The N
e
is one of the key parameters affecting the accuracy
of genomic selection [14]. The lower the N
e
, the smaller
the number of independent chromosome segments for
which effects must be estimated, which in turn leads to a
higher GEBV accuracy. In fact the deterministic formula
for GEBV accuracy predicts quite well the GEBV accuracies
we achieve in the Jersey population given the N
e
, number
of records used and heritability [14,22]. However the
reader is reminded again of the small size of our valida-
tion set in the Jersey population.
A number of authors have demonstrated that combining
pedigree EBV from large national data sets and marker
derived breeding values gave more accurate GEBV than
just using the marker derived information alone [2-4]. To
calculate GEBV accuracies combining both pedigree and
marker information, an index could be constructed
reflecting the accuracies of both sources of information.
Conclusion
Predicting genomic breeding values using a genomic rela-
tionship matrix is an attractive approach to implement
genomic selection, since accuracies of genomic breeding
values can be calculated from the diagonal elements of the
inverse of the coefficient matrix. Our results demonstrate
that expected accuracies calculated in this way agree rea-
sonably well with realised accuracies in purebred popula-
tions, but not in multi-breed populations. This indicates
that the G matrix for multi-breed populations should be
scaled in some way to achieve appropriate expected accu-
racies. Bayesian approaches that estimate individual SNP
effects gave higher accuracies for some traits, particularly
where there is a known mutation with a large effect on the
trait segregating in the population. Finally, multi-breed
reference populations could be a valuable resource for
mapping QTL.
Competing interests
The authors declare that they have no competing interests.
Authors' contributions
BJH wrote the paper and analysed the data, PJB analysed
the data, ACC performed the lab work required, KV ana-
lysed the data, and MEG designed the experiment. All
authors read and approved the final manuscript.
Acknowledgements
The authors are grateful to Curt van Tassell and Tad Sonstegard from the
USDA for providing genotypes of Australian bulls, under a collaborative
agreement between USDA and Department of Primary Industries Victoria.
References
1. Meuwissen THE, Hayes BJ, Goddard ME: Prediction of total
genetic value using genome-wide dense marker maps. Genet-
ics 2001, 157:1819-1829.
2. VanRaden PM, Van Tassell CP, Wiggans GR, Sonstegard TS, Schnabel
RD, Taylor JF, Schenkel F: Invited review: Reliability of genomic
predictions for North American Holstein bulls. J Dairy Sci
2009, 92:16-24.
3. Hayes BJ, Bowman PJ, Chamberlain AC, Goddard ME: Genomic
selection in dairy cattle: progress and challenges. J Dairy Sci
2009, 92:1313.
4. Harris BL, Johnson DL, Spelman RJ: Genomic selection in New
Zealand and the implications for national genetic evaluation.
Proceedings of the Interbull Meeting, Niagara Falls, Canada 2008.
5. De Roos APW, Hayes BJ, Spelman R, Goddard ME: Linkage dise-
quilibrium and persistence of phase in Holstein Friesian, Jer-
sey and Angus cattle. Genetics 2008, 179:1503-1512.
6. De Roos APW, Hayes BJ, Goddard ME: Reliability of genomic
breeding values across multiple populations. Genetics 2009 in
press.
7. Hickey JM, Veerkamp RF, Calus MP, Mulder HA, Thompson R: Esti-
mation of prediction error variances via Monte Carlo sam-
pling methods using different formulations of the prediction
error variance. Genet Sel Evol 2009, 41:23.
8. Scheet P, Stephens MA: A fast and flexible statistical model for
large-scale population genotype data: Applications to infer-
ring missing genotypes and haplotypic phase. Am J Hum Genet
2006, 78:629-644.
9. Nejati-Javaremi A, Smith C, Gibson J: Effect of total allelic rela-
tionship on accuracy of evaluation and response to selection.
J Anim Sci 1997, 75:1738-1745. inbreeding and maximising
genetic gain. Genet Sel Evol 2007, 39:369-389
10. Villanueva B, Pong-Wong R, Fernandez J, Toro MA: Benefits from
marker-assisted selection under an additive polygenic
genetic model. J Anim Sci 2005, 83:
1747-1752.
11. Fernando RL: Genetic evaluation and selection using geno-
typic, phenotypic and pedigree information. Proc. 6th Wld.
Cong. Genet. App. Liv. Prod 1998, 26:329-336.
12. Habier D, Fernando RL, Dekkers JC: The impact of genetic rela-
tionship information on genome-assisted breeding values.
Genetics 2007, 177:2389-2397.
13. VanRaden PM: Efficient methods to compute genomic predic-
tions. J Dairy Sci 2008, 91:4414-4423.
14. Goddard ME: Genomic selection: Prediction of accuracy and
maximisation of long term response. Genetica 2008,
136(2):245-257.
15. Gilmour AR, Gogel BJ, Cullis BR, Welham SJ, Thompson R: ASReml
User Guide Release 1.0. VSN International Ltd., Hemel Hemp-
stead, UK; 2002.
16. Verbyla KL, Hayes BJ, Bowman PJ, Goddard ME: Technical note:
Accuracy of genomic selection using stochastic search varia-
ble selection in Australian Holstein Friesian dairy cattle.
Genet Res 2009 in press.
Publish with BioMed Central and every
scientist can read your work free of charge
"BioMed Central will be the most significant development for
disseminating the results of biomedical research in our lifetime."
Sir Paul Nurse, Cancer Research UK
Your research papers will be:
available free of charge to the entire biomedical community
peer reviewed and published immediately upon acceptance
cited in PubMed and archived on PubMed Central
yours — you keep the copyright
Submit your manuscript here:
/>BioMedcentral
Genetics Selection Evolution 2009, 41:51 />Page 9 of 9
(page number not for citation purposes)
17. Haile-Mariam M, Bowman P, Goddard ME: A practical approach
for minimising inbreeding and maximising genetic gain in
dairy cattle. Genet Sel Evol 2007, 39(4):369-89.
18. Spelman RJ, Ford CA, McElhinney P, Gregory GC, Snell RG: Charac-
terization of the DGAT1 gene in the New Zealand dairy pop-
ulation. J Dairy Sci 2002, 85:3514-3517.
19. Ibánez-Escriche N, Fernando RL, Toosi A, Dekkers JC: Genomic
selection of purebreds for crossbred performance. Genet Sel
Evol 2009, 41:12.
20. Grisart BF, Farnir F, Karim L, Cambisano N, Kim JJ, Kvasz A, Mni M,
Simon P, Frère JM, Coppieters W, Georges M: Genetic and func-
tional confirmation of the causality of the DGAT1 K232A
quantitative trait nucleotide in affecting milk yield and com-
position. Proc Natl Acad Sci USA 2004, 24:2398-2403.
21. Zhong S, Dekkers JC, Fernando RL, Jannink JL: Factors affecting
accuracy from genomic selection in populations derived
from multiple inbred lines: a barley case study. Genetics 2009,
182:355-364.
22. Hayes BJ, Visscher PM, Goddard ME: Increased accuracy of artifi-
cial selection by using the realized relationship matrix. Genet
Res 2009, 91:47-60.