Báo cáo sinh học: " Estimation of relatedness among non-pedigreed Yakutian cryo-bank bulls using molecular data: implications for conservation and breed management" pps
Bạn đang xem bản rút gọn của tài liệu. Xem và tải ngay bản đầy đủ của tài liệu tại đây (1010.95 KB, 9 trang )
Genetics
Selection
Evolution
Tapio et al. Genetics Selection Evolution 2010, 42:28
/>Open Access
RESEARCH
© 2010 Tapio et al; licensee BioMed Central Ltd. This is an Open Access article distributed under the terms of the Creative Commons
Attribution License ( which permits unrestricted use, distribution, and reproduction in
any medium, provided the original work is properly cited.
Research
Estimation of relatedness among non-pedigreed
Yakutian cryo-bank bulls using molecular data:
implications for conservation and breed
management
Ilma Tapio
1
, Miika Tapio
1
, Meng-Hua Li
1
, Ruslan Popov
2
, Zoya Ivanova
2
and Juha Kantanen*
1
Abstract
Background: Yakutian cattle, the last remaining native cattle breed in Siberia, are well adapted to the extreme sub-
arctic conditions. Nowadays only ca. 1200 purebred animals are left in Yakutia. The semen of six Yakutian bulls was
stored in a cryo-bank without any pedigree documentation because of the traditional free herding style of the
population.
Methods: To clarify the genetic relatedness between these bulls and to provide recommendations to use their semen
in future conservation and breed management programs, we have analysed 30 autosomal microsatellites and
mitochondrial DNA sequences in 60 individuals including the six for which semen has been stored. Four relatedness
estimators were calculated. In addition, we assessed the value of the cryo-bank bulls for the preservation of genetic
variation of the contemporary Yakutian cattle by calculating allelic and gene diversity estimates and mean molecular
coancestries.
Results: On the basis of microsatellite variability, including the Yakutian cryo-bank bulls increases the allelic variation in
the contemporary population by 3% and in the male subpopulation by 13%. In terms of the mean molecular
coancestries, they are less related to the contemporary cow population than the breeding bulls and therefore could be
used to reduce inbreeding in the living population. Although 30 loci are insufficient to resolve definitely their
relatedness categories, the data suggest four pairs of cryo-bank bulls as possible half-sibs.
Conclusions: Our results show that even relatively limited cryo-bank storage of semen can carry allelic variation
through a bottleneck. We propose a breeding scheme based on the rotation of breeding females and the division of
cryo-bank bulls into three groups. Thus, if molecular data (e.g. autosomal microsatellite genotypes) for the
contemporary population are available and based on relatively small-scale laboratory analyses, it is possible to avoid
serious mistakes in their use for breeding applications. The approach suggested here based on the use of Yakutian
cryo-bank semen can be easily extended to cryo-bank materials of other animals in future breeding programs.
Background
Yakutian cattle are the last remaining native cattle breed
of the East Asian 'Turano-Mongolian' type of Bos taurus
in Siberia. They are distributed in the north-eastern
region of the Sakha Republic (Yakutia) of the Russian
Federation [1-3]. These cattle possess a number of traits,
such as solid trunk, short strong legs and long thick win-
ter coat, which make them adapted to the extreme sub-
arctic conditions. Moreover, efficient thermoregulation,
quick formation of subcutaneous fatty tissue and low
metabolic rates at low temperatures (even down to -60°C)
allow them to survive in harsh environments under poor
feed conditions (e.g. [3]). Ancestors of Yakutian cattle can
be traced back to indigenous cattle in Siberia, which
migrated with the Yakuts ca. 1,000 years ago from the
southern Baikal region to the northern regions of the
Lena and Yana rivers. Yakutian cattle were purebred until
* Correspondence:
1
Biotechnology and Food Research, MTT Agrifood Research Finland, Jokioinen,
FI-31600 Finland
Full list of author information is available at the end of the article
Tapio et al. Genetics Selection Evolution 2010, 42:28
/>Page 2 of 9
1929 and, from then on, were subjected to extensive
crossbreeding with productive breeds [2]. Consequently,
only ca. 1200 purebred Yakutian cattle individuals remain
in three villages in the district of Eveno-Bytantaisky, one
village of Uluu-Syhyy and four different farms close to
Yakutsk City [1]. Currently the population comprises only
525 breeding cows and 28 breeding bulls. Yakutian cattle
are classified as an endangered breed by the Food and
Agriculture Organization of the United Nations (FAO)
[4]. However, recent studies in a continental context have
suggested that this breed is highly interesting for the con-
servation of cattle genetic diversity [3,5]. There is a need
to conserve the breed for future cattle breeding actions as
well as for scientific and cultural purposes.
Maintaining genetic variability and avoiding inbreeding
are of great importance in the management of small ani-
mal populations. Inbreeding has a negative effect on fit-
ness, productivity and several other phenotypic traits [6].
Meanwhile, a reduction in gene and allele diversity might
reduce a population's response to environmental changes
or artificial selection in the future [7,8]. Thus, ex situ
banking of embryos, oocytes and semen plays a funda-
mental role in the conservation and management of small
farm animal breeds [9]. Storage of genetic material repre-
sents a reservoir of a breed's genetic diversity and could
be used to re-establish a breed, if needed. The only
genetic material stored ex situ for Yakutian cattle is the
semen from six bulls collected between 1980 and 1986.
However, because of the traditional free herding style of
these cattle in summer pastures, where several bulls mate
randomly within a herd, pedigree records of these six
bulls are not available and, thus, the traditional pedigree-
based control of inbreeding is impossible in a meaningful
way.
In the absence of pedigree records, molecular data from
autosomal, maternally inherited mitochondrial DNA
(mtDNA) or from paternally inherited Y-chromosomal
markers can be used to estimate relatedness between ani-
mals [10-12]. The widely applied statistical approaches to
infer relatedness among individuals can be classified into
two categories: one involves the explicit pedigree recon-
struction among all individuals in the sample; and the
other is based on the best pairwise relationship between
two individuals at a time based on either relatedness esti-
mation [13-15] or likelihood techniques [16,17]. The
weakness of the pairwise methods is that they do not take
into account information from the reference population
and the difficulty in distinguishing among relationships
with similar patterns of alleles (e.g. [18]). However, pedi-
gree reconstruction methods have been applied mainly to
the reconstruction of full-sib families [19].
Survival of the last native cattle breed in Siberia, Yaku-
tian cattle, is important for the local human community
as a source of food and income [1], but also because it
presents extreme adaptive potentials of the cattle species
in general. However, due to the small census size, Yaku-
tian cattle require a careful management strategy. Long-
term cryo-conservation of embryos and semen should be
considered seriously as they represent a resource for
ongoing breeding activities and a secure way of preserv-
ing genetic diversity within the breed, should the living
population encounter problems. Although molecular
measures of genetic relatedness do not necessarily agree
exactly with the true relatedness coefficients calculated
from the pedigree records (but see [20]), they are the best
relatedness indicators in the absence of recorded pedi-
gree information (e.g. [11]). Therefore, the specific goals
of the current study were to estimate genetic relatedness
among the six Yakutian cryo-bank bulls using pairwise
and pedigree reconstruction methods based on the analy-
sis of autosomal microsatellites and mtDNA sequences.
We have also assessed how much genetic variation such a
limited ex situ bank could add to the contemporary popu-
lation of Yakutian cattle. Our aim was to solve a practical
conservation problem in a highly valued cattle breed and
to see how helpful basic population genetics analyses are
in solving such a breed management question. Our
results also provide recommendations for future conser-
vation and use of the six cryo-bank semen.
Methods
Sampling and data extraction
Genomic DNA was extracted from the frozen semen
samples of six Yakutian cattle cryo-bank bulls (named
Keskil, Moxsogol, Radzu, Erel, Sarial and Alii), whose
semen had been stored for more than 20 years, according
to the method described by [21]. For the genetic diversity
comparison, a reference population consisting of 54 ran-
domly sampled Yakutian cattle individuals from the State
farm in the village of Kustur (17 individuals) and from
private farms in the villages of Batagai-Alyta (17), Kustur
(4) and Uluu-Syhyy (16) in the Sakha Republic were also
included in the analysis [3]. The reference population
included samples of 37 cows and 17 bulls, referred hereaf-
ter to as 'the cow subpopulation' and 'the bull subpopula-
tion', respectively. Genotypes of the reference population
using the same set of 30 autosomal microsatellites were
obtained from a previous study by Li et al. [3].
Molecular analysis
To determine the levels of mtDNA variability, DNA sam-
ples of the six Yakutian cryo-bank bulls were sequenced
for a 375-nucleotide fragment of the mtDNA control
region using the primers published in [22]. The
sequenced fragment covers bases 15,960 to 16,334 as
compared to the complete cattle mtDNA sequence
(NC006853). Standard double-stranded sequencing was
performed with DYEnamic ET Terminator Kit (Amer-
Tapio et al. Genetics Selection Evolution 2010, 42:28
/>Page 3 of 9
sham Biosciences) using the primers for polymerase
chain reaction (PCR) and 10 μL of purified PCR-product
on a MegaBACE™ 500 DNA Sequencer (Amersham Bio-
sciences). Complementary sequences were combined
using the SEQUENCHER v4.6 software (Gene Codes Co,
Ann Arbor, MI, USA). In addition, sequences of 24 ran-
dom individuals from the reference population (accession
numbers FJ014247-FJ014270) were obtained from a
recent study [23]. The six Yakutian cryo-bank bulls and
international reference animals were genotyped for the
same set of 30 microsatellites (Table 1) as described in [3].
Information on primers and PCR conditions can be
found in the Cattle Diversity Database j-
ects.roslin.ac.uk/cdiv/markers.html.
Statistical analysis
To characterise the maternal lineages, multiple align-
ments of mtDNA sequences were performed using Clust-
alX version 1.81 [24]. The size of the aligned mtDNA
control region fragment was 255 nucleotides between
bases 16,021 and 16,275 compared to the complete cattle
mtDNA sequence (NC006853). The number of haplo-
types was estimated and pairwise genetic distances
between haplotypes were calculated based on the number
of nucleotide differences using MEGA version 3.1 [25].
Genetic variability of the autosomal microsatellite loci
in the whole Yakutian cattle sample (60 individuals) was
quantified by the observed number of alleles (A
O
) and
polymorphism information content (PIC) per locus using
the program Microsatellite TOOLKIT [26]. Locus-wise
tests for Hardy-Weinberg equilibrium (HWE) due to
heterozygote deficiency were performed with 10,000
Monte Carlo randomisations [27] and the 'U' statistic test
[28] as implemented in the programs GENEPOP version
4.0 [29] and ML-Relate [17], respectively. The program
GENEPOP was also used in the Fisher's exact tests for
genotypic linkage disequilibrium (LD) between all pairs
of microsatellites with a Markov chain method of 50,000
iterations and 100 batches.
Relationships among the six Yakutian cryo-bank bulls
were estimated with the pairwise relatedness estimators,
r
W
[15] and r
QG
[13], using the program SPAGeDi version
1.2 [30]. The calculation was based on autosomal micro-
satellite genotypes in all 60 individuals. Furthermore,
pairwise relationships between the bulls were calculated
with the maximum-likelihood estimator r
K
using the pro-
gram ML-Relate [17]. Performances of r
W
, r
QG
, and r
K
were evaluated using a simulation approach as imple-
mented in PEDAGOG [31]. Allele frequencies of the 30
microsatellites obtained from all 60 individuals were used
as input data. Distribution of pairwise relatedness (R)
estimates for each of the four simulated relationship cate-
gories [unrelated (UR), half-sibs (HS), full-sibs (FS), and
parent-offspring (PO)] was based on the simulated geno-
types from 1000 individual-pairs each. The sampling
variance was calculated as the standard deviation of the
mean R estimate for each simulation category separately.
The bias among estimators was tested by comparing the
mean and the expected R values (UR 0.0; HS 0.25; FS and
PO 0.5). Two-tailed t-tests were used to evaluate the sig-
nificance of potential bias. Critical significance values
Table 1: Information on microsatellite markers
Locus BTA A
O
PIC P
BM1824 1 4 0.39 0.547
BM2113 2 6 0.58 0.834
ETH10 5 5 0.39 0.543
ETH225 9 5 0.63 0.355
ETH3 19 4 0.60 0.908
HEL5 21 5 0.62 0.097
ILSTS005 10 3 0.32 0.813
INRA023 3 5 0.52 0.879
INRA035 16 3 0.18 0.002
INRA005 12 4 0.61 0.652
INRA063 18 3 0.33 0.407
BM1818 23 2 0.33 0.089
CSSM66 14 8 0.65 1.000
ETH152 5 4 0.51 0.969
HEL1 15 5 0.57 0.200
HEL13 11 4 0.44 0.143
HEL9 8 6 0.62 0.056
ILSTS006 7 6 0.67 0.115
INRA032 11 3 0.45 0.103
INRA037 11 5 0.52 0.265
TGLA227 18 8 0.68 0.421
TGLA126 20 4 0.68 0.216
TGLA122 21 6 0.67 0.745
HAUT24 22 4 0.50 0.747
HAUT27 26 8 0.69 0.389
CSRM60 10 7 0.62 0.206
MM12 9 4 0.51 0.181
ETH185 17 5 0.61 0.328
TGLA53 16 10 0.67 0.134
SPS115 15 4 0.41 0.264
Mean - 5 0.53 -
For each locus are given the chromosomal location (BTA), and the
summary statistics per locus such as the number of observed alleles
(A
O
), polymorphism information content (PIC) and P-values for the
deviation from Hardy-Weinberg equilibrium across the total 60
Yakutian samples
Tapio et al. Genetics Selection Evolution 2010, 42:28
/>Page 4 of 9
were adjusted for multiple tests with sequential Bonfer-
roni correction.
Pedigree reconstruction among all individuals in the
sample was performed using PARENTAGE version 1.0
[32]. Two chains with burn-in of 200 iterations, thinning
of 400 and 2000 samples were applied. A Dirichlet prior
for the allele frequencies was used and the prior for the
distribution of offspring between males and females was
set to be gamma (1, 2). Influence of the six Yakutian cryo-
bank bulls on the genetic variability of the reference pop-
ulation and the bull subpopulation were investigated by
calculating basic statistics such as gene and allelic diversi-
ties.
Molecular coancestry is similar to the genealogical
coancestry coefficient [33] but is defined as the probabil-
ity that two alleles taken at random, one from each indi-
vidual, are identical by state. To test if the six Yakutian
cryo-bank bulls were less related to the cow subpopula-
tion (37 cows) than the bull subpopulation (17 bulls), we
used the program MOL_COANC version 1.0 [34] to cal-
culate the mean molecular coancestry for the whole
Yakutian cattle population (60 individuals), for the all the
bulls (23 bulls comprising the six cryo-bank bulls and the
17 reference bulls), for the 17 reference bulls, for six
Yakutian cryo-bank bulls and for each of the 23 bulls sep-
arately. Mean molecular coancestry [33] between each
bull and every cow was also calculated. The difference
between the bull subpopulation (17 reference bulls) and
the group of six Yakutian cryo-bank bulls was tested
using a two-sample permutation test by the Hothorn and
Hornik exactRankTests version 0.8-12 package for the R
language.
Results
Mitochondrial data
Screening of the 255 nt fragment of the mtDNA control
region identified 11 haplotypes defined by 17 variable
sites that belong to the taurine mtDNA sub-haplogroups
T2, T3 and T4 (Additional file 1) [35,36]. Six haplotypes
were individual-specific, three haplotypes were shared by
two samples, one haplotype was shared by four samples
and the most common haplotype was shared by 14 indi-
viduals. MtDNA sequences of the six Yakutian cryo-bank
bulls (accession numbers FJ014464-FJ014469) were char-
acterized by six different haplotypes, four of which were
not observed in the contemporary samples (Additional
file 1). The average number of pairwise nucleotide differ-
ences among all 11 haplotypes was 3.78, ranging from 1
to 8 among pairs of comparison. The number of pairwise
nucleotide differences among the six haplotypes observed
in the six Yakutian cryo-bank bulls varied from 2 to 7
with an average number of 4.53. We did not find any
mtDNA haplotype shared by all six Yakutian cryo-bank
bulls, which indicates that these bulls cannot be full-sibs
or maternal half-sibs.
Microsatellites and relatedness
One hundred and fifty alleles were detected in the 60
Yakutian cattle individuals across the 30 microsatellites.
The number of observed alleles varied from 2 to 10 per
locus (Table 1). The average PIC across the loci for the
complete sample was 0.532, with the lowest PIC observed
at INRA035 (0.176) and the highest at HAUT27 (0.685).
No significant (P < 0.05) deviations from LE were
observed in the pairwise microsatellite comparisons after
sequential Bonferroni correction was applied. Significant
(P < 0.05) heterozygote deficiency was detected only at
INRA035 (Table 1), which is probably due to the presence
of non-amplifying alleles (e.g. [37]). It is also possible that
the locus INRA035 is near a gene or within a genomic
region under directional selection and this would be
interesting to investigate further.
We calculated pairwise relatedness estimates between
the six Yakutian cryo-bank bulls with and without the
locus INRA035. These calculations of relatedness were
further adjusted to accommodate non-amplifying alleles
by the option as implemented in the ML-Relate program.
Neither the exclusion of the locus nor the inclusion of the
non-amplifying alleles had a significant effect on the
relatedness estimates (not shown). Therefore, the results
presented in the study are based on the full set of 30 mic-
rosatellites (Additional file 2).
Mean r
W
and r
QG
estimates and their standard devia-
tions calculated for four simulated relatedness distribu-
tions are presented in Additional file 3. Performances of
both pairwise relatedness estimators were similar to each
other with only minor differences in variance estimates.
r
QG
had a slightly smaller (by 0.004) sampling variance for
the distribution of UR individuals, while r
W
performed
better in the remaining categories (HS by 0.002, FS by
0.01 and PO by 0.015). In three out of eight cases, mean R
deviated significantly from the expected value (P < 0.013
after sequential Bonferroni correction). The bias for r
W
for UN pairs was downwards, while that for r
W
and r
QG
in
the category of PO was upwards (Additional file 3). The
performance of r
K
was very similar to that of r
W
(results
not shown) apart from negative values being converted to
zero relatedness.
Ten out of 15 pairwise R-estimates between the six
Yakutian cryo-bank bulls approached zero or fell below it.
The remaining five bull-pairs exhibited R-values ranging
from 0.124 to 0.276 for r
W
and from 0.180 to 0.295 for r
QG
(Additional file 2). All pairwise R values were plotted on
the distribution of four simulated relatedness categories
(Figure 1). When the r
W
estimator was used, one pair
Tapio et al. Genetics Selection Evolution 2010, 42:28
/>Page 5 of 9
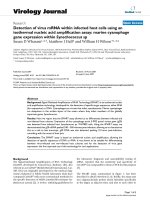
(Radzu:Sarial, R = 0.276) fell outside the 95% confidence
interval for simulated UR individuals (the 95
th
upper
quantile = 0.252) and was considered to be related (Figure
1a). Two other pairs were identified as related when the
r
QG
estimator was applied (Keskil:Moxsogol, R = 0.295;
Radzu:Erel, R = 0.255; the 95
th
upper quantile = 0.242)
(Figure 1b). The ML-Relate program uses simulation to
determine which relationships are consistent with geno-
type data and to compare putative relationships with
alternatives. In order to identify possible misclassified
individuals, a maximum-likelihood estimator r
K
esti-
mated by ML-Relate was applied. Besides the three bull-
pairs mentioned above, the Erel:Sarial pair (r
W
= 0.205;
r
QG
= 0.180) had the highest likelihood of being a half-sib
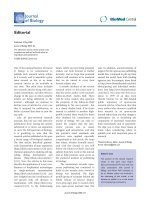
Figure 1 Pairwise relatedness of Yakutian cryo-bank bulls. Values are calculated using (A) r
W
and (B) r
QG
relatedness estimators plotted on a dis-
tribution of four simulated relationship categories: unrelated, half-sibs, full-sibs and parent-offspring; the vertical line represents the 95
th
percentile for
simulated unrelated individuals; the position of pairwise values in regards to the Y-axis was designed based on the estimates from the r
K
relatedness
estimator and was calculated as 3 divided by the cases when the log likelihood of R for the second closest relationship is smaller than the most likely
relationship; abbreviations for Yakutian cryo-bank bulls are: K-Keskil, M-Moxsogol, R-Radzu, E-Erel, S-Sarial, A-Alii. Y-axis denotes the distribution of pos-
terior probability density based on the simulations of the four relationship categories using the two relatedness estimators r
W
and r
QG
, respectively.
Tapio et al. Genetics Selection Evolution 2010, 42:28
/>Page 6 of 9
(Additional file 2). The same four pairs of Yakutian cryo-
bank bulls were also identified as potential half-sibs in the
parentage analysis performed using the pedigree recon-
struction method among all individuals in the sample
(Additional file 4).
Allelic diversity and gene diversity
Inclusion of the six Yakutian cryo-bank bulls in the calcu-
lation increases the within-population genetic variability
relative to that in the contemporary reference population
(Table 2). For example, the six cryo-bank samples made it
possible to add two new alleles at the locus INRA023 and
their frequency in the cryo-bank samples is 0.083. There-
fore, compared to the three alleles detected in the 54 con-
temporary samples from the reference population, a 67%
gain in allelic variation was observed when including the
six cryo-bank samples. With the six cryo-bank bulls, the
average allelic diversity of the total Yakutian population
increased by 3%, while the average allelic diversity of the
bulls increased by 13%. Frequencies of alleles specific for
the cryo-bank bulls ranged from 0.083 to 0.250. Three
Yakutian cryo-bank bulls, Keskil, Radzu and Alii, carried
alleles not detected in the contemporary Yakutian popu-
lation. Furthermore, all six Yakutian cryo-bank bulls pos-
sessed microsatellite alleles that were not found in the
contemporary bull subpopulation. The gene diversity
would increase by 3.5% if the six cryo-bank bulls repre-
sented the total bull subpopulation in the next generation
together with the contemporary cows. The increase in
gene diversity would be 1.2% by adding cryo-bank bulls to
the contemporary bull subpopulation in the calculation.
Molecular coancestry
The mean molecular coancestry was 0.416 for pairwise
comparisons among all 60 Yakutian cattle individuals
(Table 3). The average molecular coancestry calculated
between each Yakutian bull and the cows ranged from
0.344 to 0.465. Compared with the living contemporary
bull subpopulation, the group of six Yakutian cryo-bank
bulls showed a significantly lower (0.395 vs. 0.418; a per-
mutation test between the two mean values, P = 0.035)
mean coancestry with the living contemporary cow sub-
population (Table 3). This indicates that the cryo-bank
bulls are good candidates as sires in a breeding program
aimed at avoiding inbreeding.
Discussion
Knowledge on pairwise relatedness is crucial to draft rec-
ommendations for further use of cryo-bank bull semen in
conservation and breeding programs of domestic ani-
mals. In this study, we have estimated pairwise related-
ness among the six Yakutian cryo-bank bulls with
different estimators based on autosomal and mtDNA
genetic variation. Our study has shown that molecular
Table 2: Increase in allelic variation when the six Yakutian cryo-bank bulls are included in the analysis
Total (N = 60) Males (N = 23)
N
A
% Frequency Individual N
A
% Frequency Individual
ETH10 0 0 - 1 25 0.167 Keskil, Erel
HEL5 0 0 - 1 25 0.083 Sarial
INRA023 2 67 0.083 Radzu, Alii 2 67 0.083 Radzu, Alii
INRA063 0 0 - 1 50 0.250 Keskil, Moxsogol, Sarial
CSSM66 0 0 - 1 17 0.167 Erel
ILSTS006 0 0 - 2 67 0.250 Keskil, Moxsogol
TGLA227 1 14 0.083 Keskil 1 17 0.083 Keskil
TGLA122 0 0 - 2 50 0.083 Moxsogol, Erel
HAUT27 0 0 - 1 14 0.083 Keskil
ETH185 0 0 - 1 25 0.167 Keskil, Moxsogol
TGLA53 1 11 0.083 Keskil 1 17 0.083 Keskil
SPS115 0 0 - 1 50 0.083 Alii
Average 3 13
The number (N
A
) and frequency of added alleles in the six cryo-bank samples, the percentage gain in allelic variation (%), and the name of the
Yakutian cryo-bank bulls contributing new alleles to the population are indicated when all the samples (54 + 6 individuals) and the bull
samples (17 + 6 individuals) are considered; the percentage gain in allelic variation (%) was calculated by the number of added alleles in the
six cryo-bank samples divided by the number of alleles in the 54 contemporary animals from the reference population
Tapio et al. Genetics Selection Evolution 2010, 42:28
/>Page 7 of 9
data provide a useful tool to estimate relatedness among
individuals when pedigree data are unavailable. More-
over, the results clearly demonstrate the importance of ex
situ cryo-banking of genetic material in the conservation
of rare domestic animal breeds.
Relatedness
Our microsatellite analysis suggests that five of the 15
pairwise relatedness comparisons for the Yakutian cryo-
bank bulls exhibited coefficients of relatedness (R) close
to the theoretical expectations for half-sibs (R = 25%) and
cousins (R = 12.5%). However, the two pairwise related-
ness estimators identified different Yakutian bull-pairs as
clear outliers compared to the simulated distribution of
random individuals (Figure 1). Relatedness estimates for
simulated unrelated pairs have a very wide distribution:
the 95th percentiles (r
QG
= 0.242 and r
W
= 0.252) are very
near or above the theoretical expectation for half-sibs (R
= 0.25). This indicates that the 30 microsatellite markers
used here are insufficient for an unequivocal separation
of related and unrelated individuals.
The number and genetic variability of markers as well
as population structure might affect the robustness of dif-
ferent methods in the calculation of relatedness between
individuals. It has been also demonstrated that there is no
single best-performing estimation method to distinguish
between all possible types of relatedness [38-40]. In this
study, r
W
worked better for the simulated categories of
related individuals that are important in solving related-
ness questions among Yakutian cryo-bank bulls. The
approach by [15] is robust for a small sample size and in
the cases when the reference population includes uniden-
tified relatives. These assumptions match closely the situ-
ation of the Yakutian population studied and therefore
could explain the better performance of the estimator.
Thirty markers seems to be sufficient to identify PO's
or FS's, but fails to separate HS's or more distant related-
ness categories unequivocally. Additional simulations
have demonstrated that a set of as many as 500 microsat-
ellites would be needed for much more accurate esti-
mates of R with lower standard deviations (results not
presented). Our results agree with previous suggestions
that a large number of microsatellite loci are needed for
unequivocal clarification of pedigrees [33]. Alternatively,
using advanced SNP-microchips with thousands of SNP
could provide a solution (e.g. [41]).
Mitochondrial data
MtDNA sequence analysis has shown that the Yakutian
cryo-bank bulls do not share any mtDNA haplotype.
Nucleotide substitutions accumulate approximately 5 to
10 times faster in mtDNA than in nuclear DNA [42] and
cases of mtDNA mutation fixation within one generation
have been described in Holstein cattle [43]. However, the
smallest pairwise differences between haplotypes
observed in Yakutian cryo-bank bulls were two nucle-
otides. As a result of heteroplasmy, the sons of a dam can
have different mtDNA haplotypes. However, no hetero-
plasmy was detected in the present study. The mtDNA
sequence analysis suggests that there are no full-sibs or
maternal half-sibs among the Yakutian cryo-bank bulls.
Although four Y chromosome-specific microsatellites
(INRA124, INRA189, BM861 and BYM-1; see [44]) are
monomorphic in the population [23], the mean related-
Table 3: Average molecular coancestries
Individual Mean molecular coancestry
Total population 0.42
23 bulls 0.41
17 bulls 0.42
6 bulls 0.40
JA34 0.47
JA32 0.45
JA5 0.44
JA41 0.44
JA42 0.43
JA9 0.43
Alii 0.42
JA38 0.42
JA 17 0.42
JA44 0.42
JA33 0.42
Moxsogol 0.42
JA40 0.41
JA3 0.41
JA43 0.40
Sarial 0.40
Radzu 0.40
JA11 0.40
JA39 0.40
JA31 0.39
Erel 0.38
JA16 0.38
Keskil 0.34
Values are calculated across pairwise comparisons between the
individuals in the total population (60 individuals = 6 cryo-bank
bulls + 17 contemporary bulls + 37 contemporary cows) and the
contemporary 37 cows, between the individuals in the total bull
subpopulation (6 cryo-bank bulls + 17 contemporary bulls) and
the contemporary 37 cows, between the bulls (17 individuals)
and the cows (37 individuals) from the Yakutian reference
population, between the six Yakutian cryo-bank bulls and the
cows (37 individuals), and between each Yakutian bull and the
cows (37 individuals) separately
Tapio et al. Genetics Selection Evolution 2010, 42:28
/>Page 8 of 9
ness based on the autosomal microsatellites shows that
there are four potential half-sib pairs among the six Yaku-
tian cryo-bank bulls.
Allelic diversity and gene diversity
The six Yakutian cryo-bank bulls appear to represent an
important source of additional allelic variation and gene
diversity for the Yakutian bull subpopulation as well as for
the total Yakutian population. A high level of genetic
diversity would determine the fitness of individuals and
would affect the potential response of a population to
immediate natural or artificial selection [45].
Practical recommendations
In a small population, misclassifying related individuals
as unrelated (type II error) will result in underestimating
relatedness within the population and, thus, represents a
risk of increased inbreeding rate in subsequent genera-
tions. Therefore, we are more concerned about minimiz-
ing the occurrence of type II errors rather than the
presence of type I errors, where unrelated individuals are
identified as related. In the conservation program for the
Yakutian cattle, we recommend that four Yakutian cryo-
bank bull-pairs, Keskil:Moxsogol, Radzu:Sarial, Erel:Sar-
ial and also Radzu:Erel, are treated as half-sibs or individ-
uals otherwise having relatedness up to 25%.
In an endangered population, choosing optimal indi-
viduals for mating and designing an appropriate mating
scheme can help to monitor the genetic variation and the
average relatedness among individuals. It has been shown
that mating individuals with minimal average coances-
tries will maximize the population's genetic diversity in
terms of expected heterozygosity [46,47]. In our study, 23
Yakutian bulls are candidate sires for the subsequent gen-
eration. However, as compared with the contemporary 17
bulls, the six Yakutian cryo-bank bulls show significantly
lower average molecular coancestries with the cow popu-
lation. Using the six cryo-bank semen in artificial insemi-
nation would help to control the rate of inbreeding in
following generations.
The choice of the mating system is complicated
because of the time scale of interest. From a short-term
perspective, a simple breeding scheme could be sug-
gested, whereby a population is subdivided into several
groups and rotation mating among these groups is per-
formed [48]. In the rotation mating scheme, breeding
cows are from the same group as the sire, while breeding
bulls are from a different group. Although this scheme
will not reduce the degree of inbreeding in the long-run, a
more even distribution of inbreeding among individuals
would be achieved. Furthermore, it would guarantee that
each line produces progeny that will be used for breeding
in the next generation. On the basis of the pairwise relat-
edness among the six Yakutian cryo-bank bulls, we sug-
gest to split them into three separate groups in the
rotation mating, with Alii alone in another group, Keskil
and Moxogol in one group, and Radzu, Erel and Sarial in
a third group.
Conclusions
With the Yakutian cattle as an example, our results indi-
cate that even a limited number of semen samples
selected for the long-term cryo-banking can represent a
considerable potential to maintain within-population
genetic variability. Therefore, we recommend enrichment
of the cryo-bank by adding semen of unrelated bulls with
new genetic variability from the current living popula-
tion. We have shown that when pedigree documentation
is unavailable, even a limited number of molecular mark-
ers can help to make effective breeding mating schemes,
though a larger set of markers would be desirable. We
conclude that the present strategy with the help of molec-
ular data can be applied to other animal species or even
plants where the reduction of inbreeding and the preser-
vation of genetic variation are important concerns.
Additional material
Competing interests
The authors declare that they have no competing interests.
Authors' contributions
IT designed the study, did the laboratory work, performed the data analysis
and drafted the manuscript. MT contributed to the data analysis and the draft
writing. MHL contributed to the draft writing and revised the manuscript criti-
cally. RP and ZY contributed to the sample collection and the manuscript writ-
ing and provided important expertise on Yakutian cattle. JK planned and
coordinated the whole study, and contributed to the manuscript writing. All
the authors read and approved the final manuscript.
Acknowledgements
We are indebted to A. Virta for her technical assistance in microsatellite geno-
typing and mtDNA sequencing, to V. Ahola for her help in bioinformatics and
to M. Toro for his assistance in coancestry analyses. This work was performed as
a part of the Russian in Flux-research programme of the Academy of Finland
and was financially supported by the Academy of Finland. The office space
provided by ILRI in Nairobi, Kenya for I. Tapio at the final stage of the study is
acknowledged.
Author Details
1
Biotechnology and Food Research, MTT Agrifood Research Finland, Jokioinen,
FI-31600 Finland and
2
Yakutian Research Institute of Agriculture, 677002
Yakutsk, Sakha, Russia
Additional file 1 Alignment of the variable sites in the 255 nt frag-
ment of the cattle mtDNA control region.
Additional file 2 Average relatedness estimates for pairwise compari-
sons among the six Yakutian cryo-bank bulls obtained using related-
ness estimators r
W
, r
QG
and r
K
.
Additional file 3 Mean relatedness and their standard deviations of
the two relatedness estimators (r
QG
and r
W
) for the four simulated
relatedness categories.
Additional file 4 Results of the shared parentage analysis.
Received: 29 April 2010 Accepted: 13 July 2010
Published: 13 July 2010
This article is available from: 2010 Tapio et al; licensee BioMed Central Ltd. This is an Open Access article distributed under the terms of the Creative Commons Attribution License ( which permits unrestricted use, distribution, and reproduction in any medium, provided the original work is properly cited.Genetics Selection Evolution 2010, 42:28
Tapio et al. Genetics Selection Evolution 2010, 42:28
/>Page 9 of 9
References
1. Granberg L, Soini K, Kantanen J: Sakha Ynaga-cattle of the Yakuts Helsinki:
Finnish Academy of Science and Letters; 2009.
2. Li MH, Nogovitsina E, Ivanova Z, Erhardt G, Vilkki J, Popov R, Ammosov I,
Kiselyova T, Kantanen J: Genetic contribution of indigenous Yakutian
Cattle to two hybrid populations, revealed by microsatellite variation.
Asian-Aust J Anim Sci 2005, 18:613-619.
3. Li MH, Tapio I, Vilkki J, Ivanova Z, Kiselyova T, Marzanov N, Ćinkulov M,
Stojanovic S, Ammosov I, Popov R, Kantanen J: The genetic structure of
cattle populations (Bos taurus) in northern Eurasia and the
neighbouring Near Eastern regions: implications for breeding
strategies and conservation. Mol Ecol 2007, 16:3839-3853.
4. Scherf BD: World Watch List for Domestic Animal Diversity 3rd edition.
Rome: Food and Agriculture Organization of the United Nations; 2000.
5. Bennewitz J, Kantanen J, Tapio I, Li M-H, Kalm E, Vilkki J, Ammosov I,
Ivanova Z, Kiselyova T, Popov R, Meuwissen THE: Estimation of breed
contributions to present and future genetic diversity of 44 North
Eurasian cattle breeds using core set diversity measures. Genet Sel Evol
2006, 38:201-220.
6. Sigurdsson A, Jonmundsson JV: Inbreeding and its impact in the closed
population of Icelandic dairy cattle. Acta Agric Scand A 1995, 45:11-16.
7. Frankham R: Stress and adaptation in conservation genetics. J Evol Biol
2005, 18:750-755.
8. Garner A, Rachlow JL, Hicks J: Patterns of genetic diversity and its loss in
mammalian populations. Conserv Biol 2005, 19:1215-1221.
9. Meuwissen T: Operation of conservation schemes. In Utilisation and
conservation of farm animal genetic resources Edited by: Oldenbroek K.
Wageningen: Academic Publishers; 2007:167-193.
10. Slate J, Marshall T, Pemberton J: A retrospective assessment of the
accuracy of the paternity inference program CERVUS. Mol Ecol 2000,
9:801-808.
11. Li MH, Välimäki K, Piha M, Pakkala T, Merilä J: Extrapair paternity and
maternity in the three-toed woodpecker, Picoides tridactylus: insights
from microsatellite-based parentage analysis. PLoS ONE 2009, 4:e7895.
12. Li MH, Merilä J: Sex-specific population structure, natural selection, and
linkage disequilibrium in a wild bird population as revealed by
genome-wide microsatellite analyses. BMC Evol Biol 2010, 10:66.
13. Queller DC, Goodnight KF: Estimating relatedness using genetic
markers. Evolution 1989, 43:258-275.
14. Lynch M, Ritland K: Estimation of pairwise relatedness with molecular
markers. Genetics 1999, 152:1753-1766.
15. Wang J: An estimator for pairwise relatedness using molecular markers.
Genetics 2002, 160:1203-1215.
16. Jones AG, Arden WR: Methods of parentage analysis in natural
populations. Mol Ecol 2003, 12:2511-2523.
17. Kalinowski ST, Wagner AP, Taper ML: ML-Relate: a computer program for
maximum likelihood estimation of relatedness and relationship. Mol
Ecol Notes 2006, 6:576-579.
18. Epstein MP, Duren WL, Boehnke M: Improved inference of relationships
for pairs of individuals. Am J Hum Genet 2000, 67:1219-1231.
19. Butler K, Field C, Herbinger CM, Smith BR: Accuracy, efficiency and
robustness of four algorithms allowing full sibship reconstruction from
DNA marker data. Mol Ecol 2004, 13:1589-1600.
20. Toro M, Barragan C, Ovilo C, Rodriganez J, Rodriguez C, Silio L: Estimation
of coancestry in Iberian pigs using molecular markers. Conserv Genet
2002, 3:309-320.
21. Zadworny D, Kuhnlein U: The identification of the kappa-casein
genotype in Holstein dairy cattle using the polymerase chain reaction.
Theor Appl Genet 1990, 80:631-634.
22. Cymbron T, Loftus RT, Malheiro MI, Bradley DG: Mitochondrial sequence
variation suggests an African influence in Portuguese cattle. Proc R Soc
London B 1999, 266:597-603.
23. Kantanen J, Edwards CJ, Bradley DG, Viinalass H, Thessler S, Ivanova Z,
Kiselyova T, Cinkulov M, Popov R, Stojanović S, Ammosov I, Vilkki J:
Maternal and paternal genealogy of Eurasian taurine cattle (Bos
taurus). Heredity 2009, 103:404-415.
24. Thompson JD, Gibson TJ, Plewniak F, Jeanmougin F, Higgins DC: The
ClustalX windows interface: flexible strategies for multiple sequence
alignment aided by quality analysis tools. Nucleic Acids Res 1997,
25:4876-4882.
25. Kumar S, Tamura K, Nei M: MEGA 3: integrated software for molecular
evolutionary genetics analysis and sequence alignment. Brief Bioinform
2004, 5:150-163.
26. Park S: Microsatellite TOOLKIT: Excel Add-in Tool Package for
Microsatellite Data. Genetics Department, Trinity College, Dublin; 2001.
27. Guo SW, Thompson EA: Performing the exact test of Hardy-Weinberg
proportions for multiple alleles. Biometrics 1992, 48:361-372.
28. Rousset F, Raymond M: Testing heterozygote excess and deficiency.
Genetics 1995, 140:1413-1419.
29. Raymond M, Rousset F: GENEPOP (version 1.2): population genetics
software for exact tests and ecumenicism. J Hered 1995, 86:248-249.
30. Hardy OJ, Vekemans X: SPAGeDi: a versatile computer program to
analyse spatial genetic structure at the individual or population levels.
Mol Ecol Notes 2002, 2:618-620.
31. Coombs JA, Letcher BH, Nislow KH: PEDAGOG: Software for simulating
eco-evolutionary population dynamics. 2008 [https://
bcrc.bio.umass.edu/pedigreesoftware/].
32. Emery AM, Wilson IJ, Craig S, Boyle PR, Noble LR: Assignment of paternity
groups without access to parental genotypes: multiple mating and
developmental plasticity in squid. Mol Ecol 2001, 10:1265-1278.
33. Malécot G: Les Mathématiques de l'Hérédité. Masson et Cie, Paris, France
1948.
34. Fernandez J, Toro MA: A new method to estimate relatedness from
molecular markers. Mol Ecol 2006, 15:1657-1667.
35. Troy CS, MacHugh DE, Bailey JF, Magee DA, Loftus RT, Cunningham P,
Chamberlain AT, Sykes BC, Bradley DG: Genetic evidence for Near-
Eastern origins of European cattle. Nature 2001, 410:1088-1091.
36. Mannen H, Kohno M, Nagata Y, Tsuji S, Bradley DG, Yeo JS, Nyamsamba D,
Zagdsuren Y, Yokohama M, Nomura K, Amano T: Independent
mitochondrial origin and historical genetic differentiation in North
Eastern Asian cattle. Mol Phylogenet Evol 2004, 32:539-544.
37. Kantanen J, Olsaker I, Holm L-E, Lien S, Vilkki J, Brusgaard K, Eythorsdottir E,
Danell B, Adalsteinsson S: Genetic diversity and population structure of
20 North European cattle breeds. J Hered 2000, 91:446-457.
38. Van de Casteele T, Galbusera P, Matthysen E: A comparison of
microsatellite-based pairwise relatedness estimators. Mol Ecol 2001,
10:1539-1549.
39. Russello MA, Amato G: Ex situ population management in the absence
of pedigree information. Mol Ecol 2004, 13:2829-2840.
40. Oliehoek PA, Windig JJ, van Alendonk JAM, Bijma P: Estimating
relatedness between individuals in general populations with a focus
on their use in conservation programs. Genetics 2006, 173:483-496.
41. Langlois B: Optimising the choice of molecular markers for inbreeding
analyses. In Proceedings of the 8th World congress on genetics applied to
livestock production: 13-18 August 2006 Belo Horizonte; 2006:08-02.
42. Brown WM, Prager EM, Wang A, Wilson AC: Mitochondrial DNA sequence
of primates: tempo and mode of evolution. J Mol Biol
1982, 18:225-239.
43. Koehler CM, Lindberg GL, Brown DR, Beitz DC, Freeman AE, Mayfield JE,
Myers AM: Replacement of bovine mitochondrial DNA by sequence
variant within one generation. Genetics 1991, 129:247-255.
44. Li MH, Zerabruk M, Vangen O, Olsaker I, Kantanen J: Reduced genetic
structure of north Ethiopian cattle revealed by Y-chromosome
analysis. Heredity 2007, 98:214-221.
45. James J: The founder effect and response to artificial selection. Genet
Res 1971, 12:249-266.
46. Lacy R: Clarification of genetic terms and their use in the management
of captive populations. Zoo Biol 1995, 14:565-578.
47. Caballero A, Toro MA: Interrelations between effective population size
and other pedigree tools for the management of conserved
populations. Genet Res 2000, 75:331-343.
48. Verrier E, Rochambeau H: Problems of inbreeding in small populations
and management of rare breeds. Data collection, conservation and use of
farm animal genetic resources European workshop 1992:2-17.
doi: 10.1186/1297-9686-42-28
Cite this article as: Tapio et al., Estimation of relatedness among non-pedi-
greed Yakutian cryo-bank bulls using molecular data: implications for conser-
vation and breed management Genetics Selection Evolution 2010, 42:28