Báo cáo sinh học: "Genome-wide mapping of Quantitative Trait Loci for fatness, fat cell characteristics and fat metabolism in three porcine F2 crosses" pptx
Bạn đang xem bản rút gọn của tài liệu. Xem và tải ngay bản đầy đủ của tài liệu tại đây (774.29 KB, 15 trang )
RESEARC H Open Access
Genome-wide mapping of Quantitative Trait Loci
for fatness, fat cell characteristics and fat
metabolism in three porcine F
2
crosses
Hermann Geldermann
1*
, Stanislav Čepica
2
, Antonin Stratil
2
, Heinz Bartenschlager
3
, Siegfried Preuss
3
Abstract
Background: QTL affecting fat deposition related performance traits have been considered in several studies and
mapped on numerous porcine chromosomes. However, activity of specific enzymes, protein content and cell
structure in fat tissue probably depend on a smaller number of genes than traits related to fat content in carcass.
Thus, in this work traits related to metabolic and cytological features of back fat tissue and fat related performance
traits were investigated in a genome-wide QTL analysis. QTL similarities and differences were examined between
three F
2
crosses, and between male and female animals.
Methods: A total of 966 F
2
animals originating from crosses betwe en Meishan (M), Pietrain (P) and European wild
boar (W) were analysed for traits related to fat performance (11), enzymatic activity (9) and number and volume of
fat cells (20). Per cross, 216 (M × P), 169 (W × P) and 195 (W × M) genome-wide distributed marker loci were
genotyped. QTL mapping was performed separately for each cross in steps of 1 cM and steps were reduced when
the distance between loci was shorter. The additive and dominant components of QTL positi ons were detected
stepwise by using a multiple position model.
Results: A total of 147 genome-wide significant QTL (76 at P < 0.05 and 71 at P < 0.01) were detected for the
three crosses. Most of the QTL were identified on SSC1 (between 76-78 and 87-90 cM), SSC7 (predominantly in the
MHC region) and SSCX (in the vicinity of the gene CAPN6). Additional genome-wide significant QTL were found on
SSC8, 12, 13, 14, 16, and 18. In many cases, the QTL are mainly additive and differ between F
2
crosses. Many of the
QTL profiles possess multiple peaks especially in regions with a high marker density. Sex specific analyses,
performed for example on SSC6, SSC7 and SSCX, show that for some traits the positions differ between male and
female animals. For the selected traits, the additive and dominant components that were analysed for QTL
positions on different chromosomes, explain in combination up to 23% of the total trait variance.
Conclusions: Our results reveal specific and partly new QTL positions across genetically diverse pig crosses. For
some of the traits associated with specific enzymes, protein content and cell structure in fat tissue, it is the first
time that they are included in a QTL analysis. They provide large-scale information to analyse causative genes and
useful data for the pig industry.
Background
Reduced fatness improves carcass value, and therefore
numerous studies on QTL mapping in pig concern fat
deposition related traits (see reviews [1,2]). More
recently, the results have been compiled in the database
PigQTLdb ([3,4]; ht tp://www.animalgenome.org/QTLdb/
pig.html). As shown in several studies, QTL profiles
depend largely on genetic resour ces, trait definition and
statistical models. Taken together, these studies have
detected major QTL affecting fat traits on porcine chro-
mosomes SSC1, 2, 4, 6, 7 and X.
Traits like volume of adipose tissue and fat metabo-
lism are influenced by lipogenesis and lipolysis rates,
relationship between lipogenesis and lipolysis, energy
intake and adipocyte differentiation. In pig, fat accretion
is related to the activity of NADPH-generating enzymes
* Correspondence:
1
Animal Breeding and Biotechnology, University of Hohenheim, Stuttgart,
Germany
Full list of author information is available at the end of the article
Geldermann et al. Genetics Selection Evolution 2010, 42:31
/>Genetics
Selection
Evolution
© 2010 Geldermann et al; licensee BioMed Central Ltd. This is an Open Access article distributed under the terms of the Creative
Commons Attribution License ( which permits unrestricted use, distribution, and
reproduction in any medium, provided the original work is properly cited.
in adipose tissue [5]. Strutz [6] has reported genetic cor-
relations of about -0.4 to -0.6 between carcass fat con-
tent and activity of NADPH-generating enzymes. The
content of soluble proteins in porcine fat tissue is an
indicator of metabo lic activity and has been reported to
be genetically correlated (about -0.5) with fat content in
carcass [7] . Furthermore, data on the diameter a nd
number of porcine fat cells and on cell size differences
between lean and obese pigs have been reported [8,9].
Activity of specific enzymes, protein content and cell
structure in fat tissue probably depend on a smaller
number of genes than production traits rela ted to fat
content in carca ss. Thus, we have measured metabolic
and cytological features for back fat tissue together with
performance traits related to carcass fat deposition and
used these traits in a genome-wide QTL analysis.
The positions of the QTL were compared among
three F
2
porcine crosses as well as between male and
female animals. For some traits, we analysed the com-
bined influence of QTL positioned on different chromo-
somes on the trait variance. We detected a total of 76
QTL(P<0.05)and71QTL(P<0.01)withgenome-
wide significant effects for the three crosses, but numer-
ous QTL were observed only in one o r two of the
crosses.
Methods
Animals
Atotalof966F
2
pigs were generated with founder ani-
mals from the Meishan and Pietrain breeds and the Eur-
opean wild boar (Table 1). All pigs were maintained
under standardized housing in one experimental station.
Generation of animals for the three F
2
crosses and con-
ditions of feeding are described elsewhere [2,10].
Sampling
Blood samples were collected from founders, F
1
and F
2
animals. Blood was taken from the v. jugularis of living
animals or during stunning and separated into plasma,
erythrocytes and leucocytes. DNA was isolated from the
leukocyte fraction by chloroform-phenol extraction
according to standard protocols.
Adiposetissueofthebackfatareabetweentheskin
and m. longissim us dorsi at 13
th
/14
th
rib was collected
from the F
2
animals directly after stunning. For each
animal, a piece of back fat tissue was sampled and
stored immediat ely in liquid nitrogen. After thawi ng the
subcutaneous adipose tissueattheconnectivetissue
border was separated into an inner and outer layer sam-
ple. For both samples, connective tissue and blood ves-
sels were removed and the adipose tissue used
immediately.
Trait measurements
As shown in Table 2, 40 traits were recorded, including
11 performance traits assoc iated with fat deposition
(Table 2a). Six other traits related to enzyme activities
and three to protein content were measured in fat tissue
(Table 2b). The relative numbers or volumes of fat cells
were determined using different parameters defining 20
traits (Table 2c). Traits related to protein content,
enzyme activities and fat cells are described in the fol-
lowing sections.
Soluble proteins and enzymes
Each fat tissue s ample was cut into small pieces (about
1mmthick)andthenhomogenizedat0°Cina0.15M
KCl solution. The homogenate was centrifuged (20 min,
20000 g, +4°C) and the supernatant filtered (Filter No.
11303, pore diameter 1.2 μm, Sartorius, Göttingen, Ger-
many). The filtrate was kept at +4°C and immediately
used to measure protein conte nt and enzyme activities.
Protein contents were estimated according to [11]. For
each fat tissue sample, protein content was measured
three times and averaged. To measure each enzyme
activity, 0.1 mL of the filtrate was mixed:
- for isocitrate dehydrogenase (ICDH): with 1.0 mL of
0.075 M glycyl-glycine buffer (pH 7.4), 0.1 mL of 0.05
MMnCl
2
-4H
2
O, 0.2 mL of 0.002 M NADP, 1.5 mL
H
2
O, and 0.1 mL of 0.06 M 1.5 DL-isocitrate;
- for malate dehydrogenase ( MDH): with 2.0 mL of
0.3 M Tri s/HCl buffer (pH 8 .5), 0.6 mL of 0.01 M
MnSO
4
-H
2
O, 0.6 mL of 0.002 M NADP, 2.1 mL
H
2
O, and 0.6 mL of 1 M malate;
- for 6-phosphogluconate dehydrogenase (6PGDH)
and glucose-6-phosphate dehydrogenase (G6PDH):
with 0.5 mL of 0.25 M glycyl-glycine buffer (pH 8.0),
0.5 mL of 0.2 M MgCl
2
-6H
2
O, 0.2 mL of 0.0075 M
NADP, 0.8 mL H
2
O, 0.3 mL of 0.01 M 6-phosphoglu-
conate (6PG), and 0.01 M glucose-6-phosphate (G6P).
The mixtures were incubated for 3 min a t 30°C, and
the a bsorbance was measured at 340 nm with a photo-
meter (Perkin Elmer, Wellesley, MA, USA) for 5 min.
The activity was calculated in IU per g of tissue. For
each fat tissue sample, enzyme activities wer e measured
Table 1 Pedigrees of the three F
2
crosses with animal
numbers used in the calculations
Generation Number of animals
♂M×♀P ♂W×♀P ♂W×♀M
♂♀Σ ♂♀Σ ♂♀Σ
Founder 1891910145
F
1
3 19 22 2 26 28 2 21 23
F
2
170 146 316 150 165 315 169 166 335
M: Meishan; P: Pietrain; W: European wild boar
Geldermann et al. Genetics Selection Evolution 2010, 42:31
/>Page 2 of 15
Table 2 Definition of traits
a
a) Performance traits associated with fatness
Acronym Definition Unit
CW Carcass weight (weight of carcass with kidneys, 24 h after slaughter, cold) kg
AFW Abdominal fat weight kg
HEFW Ham external fat weight kg
SEFW Shoulder external fat weight kg
BFW Back fat weight (loin and neck external fat weight) kg
FCP Fat cuts (weight of external fat from ham, shoulder, loin, neck as well as abdominal fat, as proportion of carcass
weight)
%
BFML Back fat depth on M. long. dorsi at 13
th
/14
th
rib (average of three measurements at three points, lateral to the
cutting line of chops)
mm
FD10 Fat depth at 10
th
rib (depth of fat and skin on muscle, average of three measurements, at thinnest point) mm
ABFD Average back fat depth (mean value of shoulder fat depth, fat depth at about 10
th
rib and loin fat depth) mm
FAML Fat area on M. long. dorsi at 13
th
/14
th
rib (back fat area according to [40]) cm
2
FMR Fat to meat ratio (fat area in relation to meat area at 13
th
/14
th
rib)
b) Enzyme activity and protein content measured from fat tissue
Acronym Definition Unit
MDHO Activity of NADP-malate dehydrogenase, outer back fat layer units/g tissue
PCO Protein content, outer back fat layer mg/g tissue
LGSEO Logarithm of activity of NADPH generating enzymes, outer back fat layer(transformed for normal distribution of the
trait)
lg
10
(units/g tissue *
1000)
MDHI Activity of NADP-malate dehydrogenase, inner back fat layer units/g tissue
PCI Protein content, inner back fat layer mg/g tissue
LGSEI Logarithm of activity of NADPH generating enzymes, inner back fat layer(transformed for normal distribution of the
trait)
lg
10
(units/g tissue *
1000)
MDHOI Activity of NADP-malate dehydrogenase, averaged outer and inner back fat layer units/g tissue
PCOI Protein content, averaged outer and inner back fat layer mg/g tissue
LGSEOI Logarithm of activity of NADPH generating enzymes (ICDH + MDH + 6PGDH + G6PDH), averaged outer and inner
back fat layer (transformed for normal distribution of the trait)
lg
10
(units/g tissue *
1000)
c) Relative numbers and volumes of fat cells with different diameters
Acronym Definition Unit
FN73 Relative number of fat cells in the class of about 73 μm diameter %
FN92 Relative number of fat cells in the class of about 92 μm diameter %
FN114 Relative number of fat cells in the class of about 114 μm diameter %
FN146 Relative number of fat cells in the class of about 146 μm diameter %
FN183 Relative number of fat cells in the class of about 183 μm diameter %
FNCM Relative number of fat cells with medium cell sizes (FN73 + FN92 + FN114) %
FNCL Relative number of fat cells with large cell sizes (FN146 + FN183 + FN228).FN228 is not included as separate trait. %
RFNCSL Ratio of FNCS/FNCL (FN23 + FN29 + FN36 + FN41 + FN57)/(FN146 + FN183 + FN228). FNCS (small cell sizes) is not
included as separate trait.
RFNCML Ratio of FNCM/FNCL (FN73 + FN92 + FN114)/(FN146 + FN183 + FN228)
RFNCLO Ratio of FNCL/(FNCS + FNCM)(FN146 + FN183 + FN228)/(FN23 + FN29 + + FN114)
FV73 Relative volume of fat cells in the class of about 73 μm diameter %
FV92 Relative volume of fat cells in the class of about 92 μm diameter %
FV114 Relative volume of fat cells in the class of about 114 μm diameter %
FV146 Relative volume of fat cells in the class of about 146 μm diameter %
FV183 Relative volume of fat cells in the class of about 183 μm diameter %
FVCM Relative volume of fat cells with medium cell sizes (FV73 + FV92 + FV114) %
FVCL Relative volume of fat cells with large cell sizes (FV146 + FV183 + FV228).FV228 is not included as separate trait. %
RFVCSL Ratio of FVCS/FVCL (FV23 + FV29 + + FV57)/(FV146 + FV183 + FV228). FVCS (small cell sizes) is not included as
separate trait.
RFVCML Ratio of FVCM/FVCL(FV73 + FV92 + FV114)/(FV146 + FV183 + FV228)
RFVCLO Ratio of FVCL/(FVCS + FVCM)(FV146 + FV183 + FV228)/(FV23 + FV29 + + FV114)
a
Data of Mean, SD, N and r
2
are given in Additional file 2
Geldermann et al. Genetics Selection Evolution 2010, 42:31
/>Page 3 of 15
twice and averaged. For further details on protein and
enzyme traits see Table 2b.
Fat cell traits
According to the methods described in [12-14], each fat
tissue sample was cut up with minimal pressure into slices
about 1 mm thick. One g of tissue was suspended in 3 mL
KRB buffer (Krebs-Ringer bicarbonate buf fer with 5 mM
glucose and 25 mM HEPES, pH 7.4) containing 3 mg/mL
collagenase and slowly stirred at 37°C for 1 h.
The prepared cell suspension was filtered (PP filter,
1000 μm, Sartorius, Göttingen, Germany), collected in
3 mL KRB buffer, sedimented and again suspended in
3 mL KRB buffer. Then, 500 μLcellsuspensionwere
incubated with 5 mL collidine-HCl buffer (1 M 2,4,6-tri-
methylpyridine, 0.1 M HCl, 0.26 M NaCl, pH 7.4) and
3mLOsO
4
solution (3% w/v OsO
4
in collidine-HCl
buffer) for 24 h at room temperature. The number of
suspended cells was measured with a Coulter-Counter
(Model TA II, Beckman, Krefeld, Germany) in different
size fractions. In practise, the particle counter measured
the changes of resistance caused by individual particles
passing the opening of a capillary wall with electrodes
on both sides. Using an automatic coincidence correc-
tion guarantied that particles passing simultaneously
were counted separately. Assuming spherical particles,
the particle numbers and volumes were calculated for
size classes with cell diameters of 23, 29, 36, 41, 57, 73,
92, 114, 146, 183, and 228 μm.
Marker loci and genotyping
Marker loci were selected to be informative, evenly dis-
tributed over the chromosomes, and nearly the same for
the three crosses. Only when the information content of
a selected locus within a cross was low, was an alterna-
tive flanking locus chosen for that cross. For regions
with previo usly detected QTL for performance traits [2]
on SSC2, SSC4 and SSCX, high marker density maps
were built. Per cross, 216 (M × P), 169 (W × P) and 195
(W × M) polymorphic markers were genotyped
(Table 3). Marker loci parameters (map position, num-
ber of alleles, observed informative meioses etc.) and
polymorphism types are provided in Additional file 1.
Statistical analyses
Linkage mapping of marker loci and calculation of trait
values
Linkage mapping was performed using the CriMa p soft-
ware, version 2.4 [15,16]. The information content of
each locus for mapping was assessed by the number of
informative meioses (Additional file 1). The number of
informative meioses averaged across all loci was 558
(702) for the M × P cross, 520 (722) for the W × P
cross and 623 (732) for the W × M cross, the number
in brackets being the maximum number of informative
meioses for a locus. The frequencies of the observed
informative meioses per cross were 0.79 (M × P), 0.72
(W × P) and 0.85 (W × M).
Additional file 2 contains the numbers of observat ions,
phenotypic means, standard deviations and determination
coefficients of the traits for the F
2
animals of each cross.
QTL analysis
The l east square method was applied for QTL mapping
[17] and was performed separately for each of the t hree
crosses in steps of 1 cM; the steps were reduced when
the distance between marker loci was shorter. As
described for t he autosomes in [3] and for chromosome
X in [18], the conditional probabilities for the transfer
of an allele from the founder to the F
2
individual were
calculated for any position of the linkage array by c on-
sidering all marker loci of a linkage group s imulta-
neously and stored as additive and dominant
components. From these linear components, the additive
and dominant effects were calculated for each trait in a
generalized linear model procedure (GLM) including the
continuous (age at slaughter) and discontinuous (two-
month classes of seasonal influence, sex, litter number)
independent variables. Only 91 W × M F
2
animals were
measured for fat cell traits, which were not adjusted for
the effects of season and litter number in o ur models
because of insufficient connectedness of these indepen-
dent variables. The mean square estimates of the addi-
tive and dominant components in relation to the error
variance was ca lculated from the complete model, and
the position on a chromosome with the highest F ratio
value was considered as the most likely QTL position.
Genome-wide (P < 0.05 ) significant QTL maxima
(major peaks) were determined for all traits (Table 4).
Table 3 Overview of marker loci and chromosomes
a
Parameter M × P W × P W × M
Number of marker loci
Total 216 169 195
Microsatellites 138 131 138
SNPs 56 18 38
Other polymorphisms
b
22 20 19
Number of markers per chromosome
Average 11.4 8.9 10.3
Min. 4 3 3
Max. 29 17 20
Total map size
c
2762 2692 2728
Map size per chromosome
c
Average 145.4 141.7 143.6
Min. 56.4 48.7 58.8
Max. 232.1 229.2 235.9
Average marker interval
c
14.0 17.9 15.5
a
additional information on marker loci is provided in Additional file 1;
b
allotypes, blood groups, biochemical polymorphisms, indels, SSCPs, DGGEs;
c
sex averaged lengths/intervals for the loci in Kosambi cM for the F
2
crosses
Geldermann et al. Genetics Selection Evolution 2010, 42:31
/>Page 4 of 15
Table 4 Genome-wide significant QTL for fat related traits identified in the three Hohenheim crosses
SSC Trait
a
Cross
b
Position
c
Flanking markers
d
F ratio
e
VF
2
f
a±SE
g
d±SE
g
USDA Hoh. proximal/distal
1 CW W × M 54.1 69.0 SW2130/IGFR 10.0 * 5.3 -4.44 ± 1.00 1.35 ± 1.64
CW W × P 77.4 115.7 SW307/S0082 15.9 ** 8.9 -6.12 ± 1.09 0.65 ± 1.55
CW W × P 44.8 62.7 S0008/SW2130 14.5 ** 8.2 -5.73 ± 1.07 -0.36 ± 1.68
CW W × P 59.1 87.9 SW2130/SW307 13.1 ** 7.4 -6.15 ± 1.21 0.08 ± 2.05
AFW M × P 142.7 207.2 EAA 8.5 * 4.6 0.20 ± 0.05 -0.27 ± 0.11
AFW W × M 107.6 131.1 TGFBR1/SW705 10.3 * 5.4 -0.13 ± 0.03 0.13 ± 0.06
AFW W × P 76.3 112.7 SW307/S0082 9.2 * 5.1 -0.09 ± 0.02 0.06 ± 0.03
HEFW W × M 57.2 73.0 SW2130/IGFR 13.6 ** 7.2 -0.30 ± 0.06 0.03 ± 0.10
HEFW W × M 91.5 114.7 TPM2 10.7 ** 5.6 -0.17 ± 0.05 0.21 ± 0.07
HEFW W × P 77.8 116.7 SW307/S0082 20.7 ** 11.5 -0.26 ± 0.04 0.04 ± 0.06
HEFW W × P 45.4 64.7 S0008/SW2130 10.6 ** 5.9 -0.19 ± 0.04 -0.03 ± 0.07
HEFW W × P 64.4 93.9 SW2130/SW307 12.9 ** 7.2 -0.23 ± 0.05 -0.01 ± 0.07
SEFW W × M 113.4 137.1 TGFBR1/SW705 11.0 ** 5.8 -0.12 ± 0.03 0.01 ± 0.04
SEFW W × P 86.9 136.3 SW780/SW803 11.1 ** 6.2 -0.10 ± 0.02 0.00 ± 0.04
SEFW W × P 76.7 113.7 SW307/S0082 11.0 ** 6.2 -0.10 ± 0.02 0.00 ± 0.03
BFW W × M 107.6 131.1 TGFBR1/SW705 15.5 ** 8.2 -0.33 ± 0.07 0.29 ± 0.11
BFW W × P 77.1 114.7 SW307/S0082 19.6 ** 10.9 -0.33 ± 0.05 0.08 ± 0.08
BFW W × P 63.5 92.9 SW2130/SW307 14.0 ** 7.9 -0.31 ± 0.06 0.04 ± 0.10
BFW W × P 100.8 161.2 SW803/SW705 11.3 ** 6.4 -0.28 ± 0.06 -0.05 ± 0.12
FCP M × P 139.3 201.3 SW705/EAA 9.3 * 5.1 1.92 ± 0.44 -0.77 ± 0.93
FCP W × M 104.7 128.1 TGFBR1/SW705 14.9 ** 7.9 -1.41 ± 0.28 1.12 ± 0.46
FCP W × P 86.9 136.3 SW780/SW803 9.4 * 5.2 -1.14 ± 0.26 0.21 ± 0.45
BFML W × P 89.0 140.3 SW780/SW803 15.3 ** 8.6 -2.58 ± 0.47 -0.26 ± 0.82
BFML W × P 76.3 112.7 SW307/S0082 14.8 ** 8.3 -2.53 ± 0.47 0.29 ± 0.69
FD10 W × M 89.5 112.9 TPM2/SW803 12.7 ** 6.7 -2.20 ± 0.49 1.76 ± 0.73
FD10 W × P 77.8 116.7 SW307/S0082 14.1 ** 7.9 -2.11 ± 0.40 0.56 ± 0.56
ABFD W × M 91.4 114.6 SW780/TPM2 11.6 ** 6.2 -1.90 ± 0.47 1.89 ± 0.68
ABFD W × P 78.4 118.2 S0082/SW780 12.5 ** 7.0 -2.01 ± 0.40 0.44 ± 0.57
FAML W × P 76.7 113.7 SW307/S0082 15.6 ** 8.8 -2.53 ± 0.46 0.25 ± 0.67
FAML W × P 87.4 137.3 SW780/SW803 15.0 ** 8.5 -2.61 ± 0.48 0.27 ± 0.82
FMR M × P 113.8 166.3 TGFBR1/SW705 13.4 ** 7.5 0.09 ± 0.02 0.04 ± 0.03
FMR M × P 135.8 196.3 SW705/EAA 12.1 ** 6.8 0.11 ± 0.02 0.01 ± 0.05
FMR W × M 111.4 135.1 TGFBR1/SW705 8.8 * 4.6 -0.12 ± 0.03 0.01 ± 0.05
FMR W × P 90.6 143.3
SW780/SW803 12.8 ** 7.3 -0.06 ± 0.01 -0.01 ± 0.02
FMR W × P 76.0 111.7 SW307/S0082 10.6 ** 6.0 -0.06 ± 0.01 0.01 ± 0.02
MDHO W × P 94.3 150.2 SW803 9.1 * 5.1 -0.03 ± 0.01 -0.05 ± 0.02
FV114 W × P 103.8 166.2 SW803/SW705 8.8 * 5.2 -4.93 ± 1.21 4.26 ± 2.65
FVCM W × M 91.5 114.7 TPM2 9.9 * 16.8 8.97 ± 2.50 -9.29 ± 3.85
FVCM W × M 111.4 135.1 TGFBR1/SW705 8.5 * 14.5 12.33 ± 3.00 0.88 ± 5.35
FVCL W × M 114.3 138.1 TGFBR1/SW705 9.2 * 15.7 -13.53 ± 3.16 -0.07 ± 5.44
FVCL W × M 91.5 114.7 TPM2 8.9 * 15.3 -9.19 ± 2.70 9.56 ± 4.15
2 CW W × P 74.4 94.3 SW395/S0010 8.7 * 4.8 -3.80 ± 1.01 -3.41 ± 1.61
HEFW W × P 57.4 69.3 MYOD1 10.9 ** 6.1 -0.19 ± 0.04 -0.14 ± 0.08
SEFW W × P 71.4 90.3 SW395/S0010 8.6 * 4.8 -0.06 ± 0.02 -0.08 ± 0.03
BFW W × P 72.9 92.3 SW395/S0010 11.0 ** 6.2 -0.20 ± 0.05 -0.24 ± 0.08
FCP M × P 48.0 61.4 SW240/MLP 8.6 * 4.7 1.14 ± 0.28 0.29 ± 0.46
FMR M × P 49.7 63.4 SW240/MLP 9.8 * 5.4 0.07 ± 0.02 0.04 ± 0.03
4 CW M × P 71.2 65.0 SW1089/V-ATPase 10.0 * 5.5 -4.84 ± 1.10 1.27 ± 1.59
SEFW M × P 77.6 79.4 ATP1A2 9.5 * 5.2 -0.11 ± 0.03 0.04 ± 0.04
BFW M × P 37.0 37.9 SW835/SWR73 11.4 ** 6.3 -0.30 ± 0.07 -0.19 ± 0.10
Geldermann et al. Genetics Selection Evolution 2010, 42:31
/>Page 5 of 15
Table 4: Genome-wide significant QTL for fat related traits identified in the three Hohenheim crosses (Continued)
RFNCLO W × P 54.7 59.2 SW2128/SW1073 9.9 * 5.9 -15.18 ± 3.52 -4.26 ± 5.59
FV73 W × P 74.4 76.8 S0073 9.7 * 5.7 -2.67 ± 0.61 0.28 ± 0.95
FV146 W × P 74.4 76.8 S0073 10.6 ** 6.3 4.31 ± 0.99 -2.10 ± 1.53
FVCL W × P 73.9 75.9 V-ATPase/S0073 8.6 * 5.1 4.15 ± 1.11 -3.00 ± 1.74
RFVCSL W × P 53.0 58.2 SW2128/SW1073 9.7 * 5.8 -0.15 ± 0.04 -0.05 ± 0.05
5 CW W × M 94.4 81.5 S0005/SW152 8.7 * 4.6 3.76 ± 0.94 1.80 ± 1.42
SEFW W × M 85.7 73.0 SW2/S0005 10.1 * 5.3 0.10 ± 0.02 0.05 ± 0.04
6 AFW M × P 75.6 97.8 TGFB1 13.5 ** 7.5 0.15 ± 0.03 0.11 ± 0.04
HEFW M × P 75.6 97.8 TGFB1 12.2 ** 6.8 0.29 ± 0.06 0.15 ± 0.09
SEFW M × P 75.6 97.8 TGFB1 11.8 ** 6.6 0.12 ± 0.03 0.07 ± 0.04
BFW M × P 75.6 97.8 TGFB1 9.4 * 5.2 0.26 ± 0.07 0.17 ± 0.09
FCP M × P 75.6 96.9 LIPE 28.1 ** 15.0 1.87 ± 0.27 0.91 ± 0.36
FCP W × P 76.5 81.4 A1BG 11.4 ** 6.4 0.77 ± 0.21 1.00 ± 0.31
BFML M × P 75.6 97.8 TGFB1 14.5 ** 8.1 2.52 ± 0.50 1.20 ± 0.67
BFML W × P 76.5 81.4 A1BG 9.1 * 5.0 1.11 ± 0.40 1.94 ± 0.57
FD10 M × P 75.6 97.8 TGFB1 9.1 * 5.0 1.51 ± 0.48 1.75 ± 0.64
ABFD M × P 75.6 97.8 TGFB1 11.8 ** 6.6 1.80 ± 0.50 2.12 ± 0.67
FMR M × P 75.6 96.9 LIPE 17.8 ** 9.9 0.10 ± 0.02 -0.01 ± 0.02
FMR W × P 78.5 88.2 EAH/NPPB 10.8 ** 6.1 0.04 ± 0.01 0.05 ± 0.02
7 CW W × M 67.2 87.9 TNFB/S0102 9.5 * 5.0 -3.74 ± 0.91 1.59 ± 1.34
AFW M × P 72.6 88.1 S0102/PSMA4 17.4 ** 9.7 -0.19 ± 0.04 -0.08 ± 0.05
SEFW W × M 64.9 85.9 TNFB/S0102 9.9 * 5.2 -0.10 ± 0.02 0.05 ± 0.03
BFML M × P 63.9 78.8 TNFB/S0102 11.0 ** 6.1 -2.17 ± 0.54 -1.99 ± 0.79
FD10 M × P 63.9 78.8 TNFB/S0102 23.8 ** 12.9 -3.27 ± 0.49 -1.31 ± 0.71
FD10 W × M 57.7 78.8 TNFA 16.9 ** 8.9 2.73 ± 0.47 0.10 ± 0.67
ABFD M × P 60.4 75.8 TNFB/S0102 18.6 ** 10.3 -2.99 ± 0.51 -1.41 ± 0.73
ABFD W × M 57.7 78.8 TNFA 8.5 * 4.4 1.94 ± 0.48 0.48 ± 0.68
MDHO M × P 53.8 67.3 S0064/KE6 15.2 ** 8.5 -0.12 ± 0.02 -0.03 ± 0.03
MDHO W × M 50.1 71.8 SWR1078/TNFA 9.4 * 5.0 0.06 ± 0.01 0.02 ± 0.02
PCO M × P 51.1 63.1 S0064/KE6 10.5 * 5.8 0.57 ± 0.13 0.14 ± 0.19
LGSEO M × P 53.1 66.2 S0064/KE6 10.8 ** 6.0 -0.07 ± 0.02 -0.01 ± 0.02
LGSEO W × M 55.5 76.8 SWR1078/TNFA 10.8 ** 5.9 0.04 ± 0.01 0.02 ± 0.01
MDHI M × P 63.9 78.8 TNFB/S0102 12.0 ** 6.7 -0.13 ± 0.03 -0.03 ± 0.04
MDHI M × P 47.8 58.1 S0064/KE6
10.0 * 5.5 -0.13 ± 0.03 -0.01 ± 0.05
MDHOI M × P 62.8 77.8 TNFB/S0102 15.4 ** 8.6 -0.12 ± 0.02 -0.03 ± 0.03
MDHOI W × M 50.1 71.8 SWR1078/TNFA 10.1 * 5.5 0.07 ± 0.02 -0.00 ± 0.02
LGSEOI M × P 63.9 78.8 TNFB/S0102 11.3 ** 6.3 -0.07 ± 0.01 0.00 ± 0.02
LGSEOI W × M 56.6 77.8 SWR1078/TNFA 8.6 * 4.6 0.03 ± 0.01 0.01 ± 0.01
FN73 M × P 59.3 74.8 TNFB/S0102 9.7 * 5.5 2.43 ± 0.55 0.42 ± 0.77
FN92 M × P 54.5 68.3 S0064/KE6 13.4 ** 7.7 4.28 ± 0.83 1.00 ± 1.16
FN92 M × P 82.2 103.3 PSMA4/S0066 8.7 * 4.9 3.32 ± 0.80 -0.33 ± 1.08
FN92 W × M 32.9 55.9 SWR1078 8.6 * 14.8 -1.82 ± 1.03 -5.78 ± 1.49
FN146 M × P 58.1 73.8 TNFB 9.8 * 5.6 -3.55 ± 0.89 -2.53 ± 1.22
FN183 M × P 62.8 77.8 TNFB/S0102 10.2 * 5.8 -1.49 ± 0.38 -1.31 ± 0.55
FNCM M × P 60.4 75.8 TNFB/S0102 12.0 ** 6.9 8.22 ± 1.68 1.69 ± 2.38
FNCM M × P 80.9 101.3 PSMA4/S0066 9.7 * 5.5 7.19 ± 1.64 -1.32 ± 2.25
FNCM W × M 32.9 55.9 SWR1078 10.3 * 17.5 -3.07 ± 2.40 -15.39 ± 3.47
FNCL M × P 59.3 74.8 TNFB/S0102 12.0 ** 6.9 -5.11 ± 1.16 -3.88 ± 1.63
FV73 W × M 82.8 118.5 S0066 9.0 * 15.4 -2.31 ± 0.63 -1.68 ± 0.84
FV92 M × P 58.1 73.8 TFNB 15.0 ** 8.6 4.49 ± 0.85 1.84 ± 1.16
FV92 W × P 74.6 79.8 S0102/PSMA4 9.9 * 5.9 3.33 ± 0.86 -2.91 ± 1.34
FV92 W × P 90.7 106.4 S0066/S0115 9.3 * 5.5 3.59 ± 1.00 -5.31 ± 1.98
Geldermann et al. Genetics Selection Evolution 2010, 42:31
/>Page 6 of 15
Table 4: Genome-wide significant QTL for fat related traits identified in the three Hohenheim crosses (Continued)
FV114 M × P 60.4 75.8 TNFB/S0102 12.0 ** 6.8 4.41 ± 0.98 3.01 ± 1.39
FV114 M × P 80.9 101.3 PSMA4/S0066 8.8 * 5.0 4.01 ± 0.96 -0.93 ± 1.32
FV146 M × P 58.1 73.8 TNFB 9.9 * 5.6 -5.64 ± 1.30 -2.11 ± 1.79
FV146 W × P 90.1 105.4 S0066/S0115 9.0 * 5.3 -3.95 ± 1.17 6.35 ± 2.27
FV146 W × P 75.7 81.8 S0102/PSMA4 8.8 * 5.2 -3.37 ± 1.00 3.77 ± 1.54
FV183 M × P 62.8 77.8 TNFB/S0102 15.9 ** 9.1 -4.83 ± 0.94 -3.50 ± 1.36
FVCM M × P 59.3 74.8 TNFB/S0102 21.2 ** 12.0 10.48 ± 1.69 5.21 ± 2.35
FVCM M × P 88.4 112.2 S0066/S0115 9.6 * 5.4 8.26 ± 1.89 -1.96 ± 2.99
FVCM W × P 91.4 107.4 S0066/S0115 9.8 * 5.8 3.67 ± 1.24 -8.87 ± 2.49
FVCL M × P 59.3 74.8 TNFB/S0102 19.1 ** 10.8 -10.78 ± 1.83 -5.37 ± 2.56
FVCL W × P 90.7 106.4 S0066/S0115 10.1 * 6.0 -4.17 ± 1.30 8.75 ± 2.57
FVCL W × P 75.2 80.8 S0102/PSMA4 9.2 * 5.4 -3.75 ± 1.12 4.56 ± 1.74
RFVCML M × P 58.1 73.8 TNFB 11.3 ** 6.5 0.66 ± 0.14 0.14 ± 0.19
RFVCLO M × P 58.1 73.8 TNFB 9.5 * 5.4 0.70 ± 0.16 0.11 ± 0.22
RFVCLO W × M 82.8 118.5 S0066 8.9 * 15.2 -1.00 ± 0.28 -0.75 ± 0.37
8 FN73 W × M 108.2 116.4 SW16/SW61 9.6 * 16.4 -1.29 ± 0.85 -5.33 ± 1.31
FN92 W × M 107.5 114.4 SW16/SW61 17.1 ** 26.8 -0.33 ± 1.17 -9.87 ± 1.70
FNCM W × M 107.8 115.4 SW16/SW61 17.1 ** 26.8 0.13 ± 2.80 -24.41 ± 4.17
9 CW W × P 142.5 193.2 SW1349 8.9 * 4.9 -3.00 ± 0.96 3.66 ± 1.42
12 PCO M × P 113.1 109.3 SWR1021 8.7 * 4.8 -0.32 ± 0.12 -0.51 ± 0.17
FV146 W × M 106.6 135.4 S0106/SWR1021 9.3 * 15.9 2.14 ± 2.69 16.69 ± 4.06
13 FN185 M × P 98.2 129.8 SW520/SW38 9.3 * 5.3 0.99 ± 0.37 -2.08 ± 0.55
FV185 M × P 95.5 126.8 SW520/SW38 8.9 * 5.1 2.03 ± 1.00 -6.21 ± 1.56
14 RFNCSL W × P 48.0 52.8 SW210/SW2488 9.7 * 5.8 10.19 ± 2.46 -4.25 ± 3.97
RFNCML W × P 56.2 62.8 SW210/SW2488 9.9 * 5.9 6.63 ± 1.71 -6.02 ± 3.06
RFNCLO W × P 51.3 56.8 SW210/SW2488 11.5 ** 6.8 17.23 ± 3.83 -8.45 ± 6.57
16 FN73 M × P 34.1 43.0 S0077/S0026 8.5 * 4.8 -1.82 ± 0.54 -1.93 ± 0.76
18 PCO M × P 19.0 25.6 EAI/LEP 9.6 * 5.3 -0.35 ± 0.13 0.64 ± 0.19
X CW W × M 80.0 90.0 ACSL4/CAPN6 10.0 * 10.3 -11.72 ± 2.89 7.36 ± 3.22
HEFW W × M 80.0 90.0 ACSL4/CAPN6 9.6 * 10.0 -0.58 ± 0.16 0.30 ± 0.18
SEFW W × P 80.6 105.5 SW259/SW1943 9.7 * 10.2 0.27 ± 0.08 -0.15 ± 0.09
PCO M × P 28.4 29.1 SW980/SW2126 9.4 * 10.8 3.22 ± 0.74 -3.25 ± 0.81
PCO M × P 122.2 139.3 FMR1 8.9 * 10.3 3.11 ± 0.74 -3.13 ± 0.78
PCO W × M 81.0 95.5 CAPN6
11.2 ** 11.8 0.77 ± 0.26 -0.12 ± 0.28
LGSEO M × P 56.9 55.7 SW2456/AR 8.5 * 9.8 -0.38 ± 0.10 0.33 ± 0.10
LGSEI M × P 29.3 30.1 SW980/SW2126 11.4 ** 13.1 -0.36 ± 0.08 0.38 ± 0.08
LGSEI M × P 113.8 128.2 SW2453/FMR1 11.3 ** 13.1 -0.45 ± 0.09 0.43 ± 0.10
PCI W × M 80.4 92.0 ACSL4/CAPN6 11.0 * 11.7 0.83 ± 0.32 0.05 ± 0.36
PCOI W × M 80.7 94.0 ACSL4/CAPN6 12.5 ** 13.1 0.80 ± 0.27 -0.04 ± 0.30
LGSEOI M × P 111.5 125.2 SW2453/FMR1 11.2 ** 13.0 -0.46 ± 0.10 0.44 ± 0.11
LGSEOI M × P 29.3 30.1 SW980/SW2126 11.0 * 12.8 -0.34 ± 0.07 0.36 ± 0.08
LGSEOI M × P 56.9 55.7 SW2456/AR 11.2 ** 12.9 -0.40 ± 0.09 0.37 ± 0.09
FV73 M × P 55.4 53.7 SW2456 9.2 * 10.7 10.51 ± 2.75 -8.17 ± 2.84
RFVCSL M × P 55.4 53.7 SW2456 12.2 ** 14.1 0.68 ± 0.15 -0.55 ± 0.15
RFVCSL M × P 126.0 144.2 FMR1/SW2588 10.9 * 12.7 0.67 ± 0.15 -0.57 ± 0.16
a
trait: acronym, for definition see Table 2;
b
cross: Hohenheim F
2
crosses (M: Meishan, P: Pietrain, W: European wild boar);
c
position: USDA, position in USDA
MARC map; Hoh.: position in Hohenheim map;
d
flanking markers: nearest proximal/distal locus in the Hohenheim map; if the QTL position coincides with that of
the marker, only one locus is indicated;
e
F ratio: mean square estimates of the additive and dominant components in relation to the error variance of the model;
significance for the genome wide 5% (*) and 1% (**) level calculated by permutation test [19]; for SSCX, only the results for female animals are listed; for
threshold values see Table 5;
f
VF
2
: proportion of error variance reduction by inclusion of additive and dominant components in the initial model;
g
a: additive
effect (positive/negative signs indicate the superior/inferior trait values inherited from the paternal resource group); d:dominant effect (positive for higher values
of heterozygous individuals than the mean of homozygotes, negative for lower values); SE: standard error of estimates
Geldermann et al. Genetics Selection Evolution 2010, 42:31
/>Page 7 of 15
Additional genome-wide significant minor peaks were
registered per trait and chromosome with P < 0.01 for
performance traits (Table 2a) and P < 0.05 for the other
traits (Table 2b and 2c) when they were more than 20
cM away from the major peak and from the already
considered minor peaks.
For chromosomes SSC6, 7 and X, we performed sepa-
rate calculations for female and male animals in order
to test sex-specific differences in QTL positions and
genetic effects. The model for these data sets includes
all independent variables, with the exception of sex.
Threshold values of the test statistic were derived by
permutation tests [19], using 1000 repetitions. All per-
mutations were calculated for different traits in data sets
for crosses and chromosomes separately. Applying a
Bonferroni correction [20], the P < 0.01 and P < 0.05
genome-wide thresholds were calculated for chromo-
somes 7, 16 and × and then averaged across the chro-
mosomes and crosses, since the thresholds between the
crosses and traits showed only slight differences (Addi-
tional file 3).
Testing multifactorial influences on selected traits,
the additive and dominant components of significant
QTL positions detected across all the chromosomes
were included stepwise by using a multiple position
model which included the environmental variables.
Components with a significant proportion of the
explained variance remained in the final model (see
results in Table 5).
Results and Discussion
Genome-wide distribution of QTL
Within each cross, we identified QTL which explain
more than about 4.3% of the error variance (VF
2
) with a
P < 0.05 genome-wide significance level (threshold with
F ratio > 8.5). As shown in Table 4, a total of 147 gen-
ome-wide QTL were found (76 at P < 0.05, and 71 at
P < 0.01) for the three crosses. The numbers of signifi-
cant QTL were 30 at P < 0.05 and 33 at P < 0.01 for M
× P, 22 a t P < 0.05 and 25 at P < 0.01 for W × P, and
24 at P < 0.05 and 13 at P < 0.01 for W × M. However,
since we tested three populations and 40 traits in 120
genome scans, about six false positive QTL may occur
at a genome-wide 5% significance.
The numbers of QTL detected per trait w ere about
three times higher for the performance traits (Table 2a)
than for the other groups of traits (protein, enzyme, fat
cell traits, Table 2b and 2c). This finding can be
explained by the fact that performance traits are likely
to be influenced by a higher number of genes than pro-
tein, enzyme and fat cell traits.
In Table 4, the QTL positions and the flanking marker
loci for the Hohenheim maps are indicated together
with the corresponding USDA MARC map positions.
Figure 1 shows the genome-wide QTL distribution for
the three crosses. For performance traits, if only the
majorQTLandadjustedpositionsonUSDAMARC
map are considered, the followin g results can be
emphasized:
An accumulation of QTL for fat deposition traits (per-
formance traits) was observed on SSC1.FortheW×P
cross, QTL were mainly located at positions 76-78 and
87-90 cM. QTL at positions 89-91 and 105-108 cM
were detected in the W × M cross, besides t wo other
QTL at positions 57 cM and 113 cM. QTL at 114 and
136 cM were observed in the M × P cross. A QTL for
enzyme activity was found with a 5% significance level
in the W × P cross, and seve ral QTL were detected in
W × P and W × M crosses for fat cell parameters at
about 91, 104 and 111-113 cM, three of them near
SW705, where [21] has detected QTL for fat cell traits.
On SSC2, only QTL related to performance traits were
found in the W × P cross (at 57 cM and 73 cM) in spite of
the fact that in the Pietrain breed, the allele IGF2-intron3-
3072 A responsible for a paternally expressed QTL at the
proximal end (0.6 cM) of SSC2 affecting muscle growth
and fat deposition is nearly fixed, while in wild boar and
the Meishan b reed only the wild allele IGF2-intron3-
3072G is detected [22]. Therefore, F
1
males from W × P
and M × P crosses should be IGF2 heterozygous and
about half of the F
2
animals should possess the allele
IGF2-intron3-3072A.TheIGF2-intron3-3 072 locus was
not tested in the crosses as no suitable assay was available.
However, its location corresponds to the interval between
the markers SW2443/SWC9 and S0141, in which no QTL
for performance traits was observed in this study.
Two QTL (P < 0.01) were detected on SSC4,one
related to performance traits (37 cM, M × P cross) and
one to fat cell traits (74 cM, W × P cross). Another
QTL for fat cell traits was found at position 53-55 cM
(W × P cross).
Several QTL for performance traits were also found
on SSC6 in the M × P cross between the markers
TGFB1 and NPPB at around 76 cM. The QTL for both
traits on SSC6 in the W × P cross were l ocated in the
same interval. Whereas Bidanel et al. [23] have con-
firmed this QTL position, other authors [24,25] have
mapped a QTL for back fat thickness on SSC6 in the
vicinity of SW1881 corresponding to position 121 cM.
All 20 QTL (P < 0.01) on SSC7 were found in the major
histocompatibility complex (MHC), of which 19 were
located approximately 10 cM around the genes TNFA and
TNFB. These 19 QTL seem to be distributed in three clus-
ters, one slightly proximal to marker KE6, one slightly
distal to TNFA/TNFB and one about 6 cM distal to
TNFA/TNFB. The remaining QTL (performance trait
AFW, M × P cross) was detected about 9 cM distal to
TNFA/TNFB. A total of 18 QTL was observed in the
Geldermann et al. Genetics Selection Evolution 2010, 42:31
/>Page 8 of 15
M × P cross for performance (4), enzyme activity (5) and
fat cell traits (9), and only two QTL were detected in the
W × M cross (one for performance and one for enzyme
activity traits). These differences of QTL between crosses
might be affected by the information content of marker
loci. The QTL for back fat thickness located near TNFA/
TNFB have also been repo rted by [26-29] and Mille r [21]
has located QTL for fat cell traits at the same position.
On SSC8, 12, 13, 14, 16 and 18, several QTL for
traits related to protein content and fat cells were
observed, three of them with P < 0.01. Amongst these,
two concerning fat cell traits were found on SSC8 for
the W × M cross at 108 cM (calculated from 91 obser-
vations only), and one QTL detected on SSC14 for
another fat cell trait was located between the markers
SW210 and SW2488 in the W × P cross.
QTL for protein content were detected on SSCX for
the W × M cross at 80-81 cM in the immediate vicinity
of CAPN6. QTL related to enzyme activities were found
on SSCX in the M × P cross at positions 29, 57 and
112-114 cM. Another QTL fo r fat cell traits was found
at about 56 cM, at the same position where [30]
described a QTL for backfat thickness.
Effects of F
2
crosses on QTL profiles
As shown in Figure 1 and Table 4, most of the QTL were
observed within a few chromosome regions only, and the
QTL were often specific to one or two of the three F
2
Table 5 Combined analysis of significant QTL positions
a
Single locus
c
Combined loci
d
Trait
b
, Cross SSC Position (cM) F ratio P VF
2
(%) r
2
(%) Additive
effect
F ratio P Additive
effect
SEFW,
W×M
1 71.0 17.3 < 0.001 4.8 18.0 -0.11 4.3 0.039 -0.05
1 137.1 21.9 < 0.001 6.1 19.1 -0.12 16.4 < 0.001 -0.10
5 73.0 18.2 < 0.001 5.0 18.2 0.10 15.0 < 0.001 0.08
7 85.9 18.1 < 0.001 5.0 18.2 -0.10 18.8 < 0.001 -0.09
X 90.0 15.3 < 0.001 4.2 17.5 -0.11 15.4 < 0.001 -0.11
Initial model: r
2
(%) 13.6 Combined loci: VF
2
(%) 20.2; r
2
(%) 32.1
FD10,
W×M
1 112.9 19.3 < 0.001 5.3 14.9 -2.18 14.9 < 0.001 -1.76
2 46.5 13.7 < 0.001 3.8 13.5 -1.95 12.6 < 0.001 -1.70
7 78.8 33.9 < 0.001 9.2 18.4 2.73 35.3 < 0.001 2.60
X 90.0 20.5 < 0.001 5.7 15.2 -2.98 20.2 < 0.001 -2.71
Initial model: r
2
(%) 9.8 Combined loci: VF
2
(%) 19.4; r
2
(%) 30.2
FMR,
M×P
1 166.3 25.5 < 0.001 7.4 29.0 0.09 23.7 < 0.001 0.08
2 0.0 14.7 < 0.001 4.3 26.6 0.06 9.5 0.002 0.04
2 63.4 17.1 < 0.001 5.4 27.2 0.07 14.5 < 0.001 0.06
6 96.9 35.6 < 0.001 10.1 31.1 0.10 32.3 < 0.001 0.09
Initial model: r
2
(%) 23.1 Combined loci: VF
2
(%) 22.8; r
2
(%) 41.4
FV146,
W×P
2 96.3 9.8 0.002 3.0 17.9 -2.96 11.3 < 0.001 -3.00
4 76.9 19.3 < 0.001 6.0 20.4 4.35 17.7 < 0.001 4.00
7 105.4 9.9 0.002 3.0 17.9 -3.71 8.9 0.003 -3.32
X 0.0 9.5 0.002 2.9 17.8 3.06 11.9 < 0.001 3.23
Initial model: r
2
(%) 15.0 Combined loci: VF
2
(%) 14.4; r
2
(%) 28.3
FVCM,
M×P
1 207.3 8.7 0.003 2.7 16.0 -8.23 11.0 0.001 -8.48
2 59.4 10.1 0.002 3.0 16.4 -5.34 13.6 < 0.001 -5.71
7 74.8 37.1 < 0.001 10.8 23.2 10.31 42.3 < 0.001 10.56
X 3.0 7.4 0.014 2.1 15.7 5.26 5.3 0.022 4.08
Initial model: r
2
(%) 13.6 Combined loci: VF
2
(%) 18.6; r
2
(%) 30.6
Examples are given for some traits and show the results gained by including several genome-wide significant QTL across chromosomes
a
multiple position models were included together with the same environmental independent variables as in the initial model;
b
trait acronym, for definition see
Table 2;
c
each QTL position was analyzed separately for trait association; F ratio: mean square estimates of the additive and dominant components in relation to
the error variance of the model; VF
2
: proportion of error variance reduction by inclusion of additive and dominant components in the initial model; r
2
:
determination coefficient;
d
QTL positions analyzed in combination
Geldermann et al. Genetics Selection Evolution 2010, 42:31
/>Page 9 of 15
crosses. For exam ple, QTL on SSCX occur mainly in the
crosses M × P and W × M and with a cross-specific distri-
bution. The QTL detected in similar chromosomal inter-
vals in two of the three crosses indicate that alleles
transmitted from one of the resource groups are different
from the alleles in the two other resources.
High allelic effects caused by a distinct founder breed
were observed, for example, on SSC4 (near ATP1A2),
SSC6 (near RYR1) and SSC7 (between TNFA and
S0102). The r elevant SSC7 interval includes the MHC
region where Meishan cryptic alleles are responsible
for a decrease in fat deposition and enzyme activity
traits and an incre ase in the proportion of small fat
cells’ numbersandvolumes(observedintheF
2
M×P
and W × M crosses). The same effects of Meishan
alleles on SSC7 have been reported for fat deposition
as well as for numbers and volumes of adipocy tes in a
Large White × Meishan backcross [31]. On the con-
trary, Meishan alleles that increase fat deposition were
located in the M × P and W × M crosses on SSC1
between TGFBR1 and SW705. Moreover, Pietrain
alleles in the crosses with Meishan as well as with wild
boar on SSC6 at TGFB1/A1BG had negative effects on
obesity. None of the regions with significant effects on
fat deposition traits was common to all three crosses,
except the one for fat cell traits between TNFB and
PSMA4 on SSC7 at about 55 to 9 0 cM referring to the
USDA MARC map.
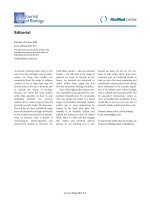
Figure 2 demonstrates the cross-specific QTL profiles
for SSC1, SSC7 and SSCX. The QTL for protein content
on SSCX at CAPN6 (mapped at 81 cM on USDA
MARC map, [18,32]) was observed only in the W × M
cross. Numerous QTL profiles on SSC1 and SSC7 were
similar between the M × P and W × M crosses indicat-
ing that allele effects in Meishan were highly different to
those in Pietrain and wild boar. However, SSC7 QTL
were similar among all three crosses for an interval
between about 50 and 100 cM (which contains the
MHC, see Figure 2), revealing that major QTL effects
are caused by alleles that segregate in all the crosses.
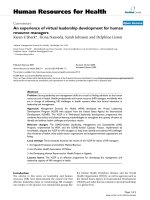
Figure 1 Genomic distribution of QTL. The distribution of the QTL detected in the Hohenheim crosses (M: Meishan; P: Pietrain; W: European
wild boar) and with F ratio values above the genome-wide thresholds P = 0.05 is shown on the pig chromosomes (SSC); for each cross, the
sex-averaged map in Kosambi morgan (M) is adjusted to the length calculated for the Hohenheim M × P cross; results for SSCX were obtained
from female animals; the different symbols for the three trait groups represent major QTL peaks (black) and minor QTL peaks (red) that show
distances > 20 cM to the major peak and to other minor peak observed for the same trait.
Geldermann et al. Genetics Selection Evolution 2010, 42:31
/>Page 10 of 15
Several of the F ratio profiles reveal multiple peaks per
chromosome (Figure 2, Table 4). This might be caused
by pleiotropic effects of the involved genes. However,
multiple peaks in the F ratio profile of a t rait per chro-
mosome may also result from linkage disequilibria
among alleles of linked loci in F
2
animals, whereby the
linkage disequilibrium increases while the distances
between the considered loci decrease. Significances of
QTL peaks can be influenced by different information
contents of the ma rker loci used in the flanking regions
of a QTL. Thus, more markers and multipo int regres-
sion analyses may help to determine the contribution of
F ratio
0 20 40 60 80 100 140 180
SW1514
SWR485
S0008
SW2130
IGF1R
S0082
TPM2
SW705
EAA
SW307
SW780
SW803
TGFBR1
120 160 200 [cM]
0
2
4
6
8
10
12
28
26
24
22
20
18
16
14
SSC1
FD10
BFW
SEFW
FMR
MxP
0
20
40 60
80
120 160
200
SW1514
SWR485
S0008
SW2130
SW307
S0082
SW803
SW705
EAA
100
140
180
220
SW780
[cM]
0
2
4
6
8
10
12
28
26
24
22
20
18
16
14
WxP
F ratio
FD10
BFW
SEFW
FMR
0
2
4
6
8
10
12
28
26
24
22
20
18
16
14
0 20 40 60 80 120 160 200
S0025
S0064
S0102
PSMA4
S0115
SW581
S0212
PI2
IGH2
100
140 180 220 [cM]
CYP21A2
KE6
TNFB
TNFA
S0066
FOS
PO1A
SSC7
FD10
MDHOI
LGSEOI
FV146
FVCM
F ratio
MxP
020406080100 140
180
S0025
S0064
CYP21A2
S0102
PSMA4
S0115
SW581
S0212
IGH2
120
160 200
[cM]
TNFB
S0066
PO1A
PI2
0
2
4
6
8
10
12
28
26
24
22
20
18
16
14
FD10
MDHOI
LGSEOI
FV146
FVCM
F ratio
WxP
F
ratio
MxP
020
40
100
120
140
SW949
SW980
SW2126
SW2456
SW2476
ACSL4
SLC25A5
SW2588
0
2
4
6
8
10
12
28
26
24
22
20
18
16
14
[cM]
FMR1
SW2453
SW1943
PA K 3
CAPN6
AR
SW259
RPS4X
POU3F4
SERPINA7
60
80
SSCX
FVCM
PCO
SEFW
020406080
100
120 140
SW949
SW980
SW2126
SW2456
SW259
SW1943
SW2453
[cM]
0
2
4
6
8
10
12
28
26
24
22
20
18
16
14
FVCM
PCO
SEFW
F ratio
WxP
0
20
40 60 80 100 120
140
SW1514
SWR485
SW2130
IGF1R
S0082
SW780
TPM2
TGFBR1
SW705
SW307
SW803
0
2
4
6
8
10
12
28
26
24
22
20
18
16
14
FD10
BFW
SEFW
FMR
[cM]
F ratio
WxM
0204060 120 160
200
240
S0025
S0064
SWR1078
CYP21A2
S0102
PSMA4
S0066
S0115
SW581
S0212
PI2
IGH2
100
180
140
TNFA
TNFB
80
PO1A
AACT2
220
0
2
4
6
8
10
12
28
26
24
22
20
18
16
14
[cM]
FD10
MDHOI
LGSEOI
FV146
FVCM
F ratio
WxM
02040
140
SW949
SW980
SW2126
SW2456
SW2476
CAPN6
SW1943
SW2453
FMR1
0
2
4
6
8
10
12
28
26
24
22
20
18
16
14
SW2588
PA K 3
SLC25A5
ACSL4
SERPINA7
POU3F4
RPS4X
AR
SW259
XIST2
60
80 100
120
[cM]
F ratio
WxM
FVCM
PCO
SEFW
only additive components included in the model
P=
0.01
0.05
0.05
P=
0.01
0.05
0.05
P=
0.01
0.05
0.05
P=
0.01
0.05
0.05
P=
0.01
0.05
0.05
P=
0.01
0.05
0.05
P=
0.01
0.05
0.05
P=
0.01
0.05
0.05
P=
0.01
0.05
0.05
Figure 2 Examples of F ratio profiles in the different Hohenheim crosses shown for chromosomes 1, 7 and X.Thesolidlineindicates
the P = 0.01, the dashed line the P = 0.05 genome-wide thresholds, and the dotted line the P = 0.05 chromosome-wide threshold for F ratio
values; traits are defined in Table 2; positions of markers are given in Kosambi centimorgan (cM) on the linkage maps of Hohenheim crosses;
results for SSCX were obtained from female animals; markers are described in Additional file 1; data sets for the two sexes are shown with the
averaged linkage map distances whereas for SSCX the female map distances are used; M: Meishan; P: Pietrain; W: European wild boar.
Geldermann et al. Genetics Selection Evolution 2010, 42:31
/>Page 11 of 15
single QTL peaks to the total genetic variance of the
trait considered.
Examples of multiple and cross-specific QTL peaks per
chromosome are also shown in Figure 2 for SSC7. In the
M × P and W × M crosses, the major QTL profiles on
SSC7 span from about 55 to 90 cM (including the genes
CYP21A2, KE6, TNFA, TNFB), and in the W × P cross
the major QTL were found at about 105 cM (between
S0066 and S0115). The 30 cM interval covering t he lar-
gest QTL on SSC7 contains the MHC known to include
numerous functional genes in man and mouse. In this
interval, genome-wide significant QTL were detected
especially in both Meishan crosses. Concerning fat
deposition traits, this could be due mainly to a smaller
difference between the purebred estimates for wild boar
and Pietrain compared to that between these two breeds
and the Meishan breed [10]. For instan ce, the differen ce
in average back fat depth (ABFD) between Pietrain and
wild boar was 2.13 mm, whereas it was 7.77 mm between
PietrainandMeishanand9.90mmbetweenwildboar
and Meishan. A further example of effects of crosses on
the patterns and positions of QTL was observed for SSC6
in the region of the loci LIPE,TGFB1,A1BG,EAHand
NPPB (USDA MARC map 75 to 80 cM, Table 4). Impor-
tant QTL were detected in this region for both M × P
and W × P crosses. The additive effects for the grand-
paternal inheritance indicate a negative influence of dis-
tinct Pietrain founder alleles on performance traits asso-
ciated with fatness.
Differences of QTL profiles calculated separately for
female and male F
2
offspring
QTL analyses for female and male F
2
offspring are
shown for example on SSC6, SSC7 and SSCX and use
averaged linkage map distances for the autosomes and
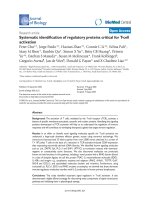
the female map distances for SSCX. Figure 3 shows
QTL effects for the traits FVCM, FMR and PCOI, which
differ between female and male F
2
animals. For example,
the trait FVCM in females of the M × P cross are highly
influenced by a QTL at 75 cM on SSC7 whereas the F
ratio value for males shows non-significan ce at that
position. Males of the W × P cross show a QTL for the
trait FMR on SSC6 at a position near 125 cM, which is
located about 40 cM distal to the position found for all
(female and male) animals. The trait PCOI represents
an example of sex specific QTL positions on SSCX
(QTL at 94 and 104 c M for females and males, respec-
tively, W × M cross).
Sex specific QTL positions have also been reported on
SSCX for muscle, fatness and growth related traits in
the W × M cross [18]. Sex specific and fat related QTL
have been described on chromosome 5 in chicken [33]
and on several chromosomes in mouse [34]. Gene
expression studies in male and female F
2
mice have
shown a large degree of sexually dimorphic gene expres-
sion in several tissues [35,36]. An expression QTL
(eQTL) study [37] has shown that most of the eQTL
were cis eQTL (mapping to the location of the gene)
and sex-shared. Genetic mechanisms possibly underlying
sex-specific expression, like sex linkage, sex-specific alle-
lic effects or genomic imprinting, are discussed in [38].
Combined analysis of significant QTL positions across
chromosomes
Across all the pig chromosomes and for selected traits,
we have carried out a combined analysis of the additive
and dominant components of signifi cant QTL positions.
Taking each trait separately, the components of those
positions were included step by step in a multiple posi-
tion model. In the final model, only components with
significant variance proportions were included. Examples
of the results are shown in Table 5 and elucidate why
the explained phenotypic variance in the F
2
generations
increased markedly up to about 23%, and the determina-
tion coefficients (r
2
) of the initial model (analyses with-
out genetic independent variables) were more or less
doubled. For each trait, several QTL positions, partially
located on the same chromosome, remained significant
in the combined analysis. This means that the combined
analysis indicates a predominant contribution of a few
QTL regions to the genetic varia nce of a trait. There-
fore, multiple testing elucidates chromosome intervals
which can be significant for breeding programmes.
Conclusions
As demonstrated in this report, in pig, fat related traits
correspond to numerous specific QTL positions across
the genome. For some of the traits associated with spe-
cific enzymes, protein content and cell structure in fat
tissue, it is the first time that they are included in a
QTL a nalysis. We have found that QTL positions differ
between F
2
crosses, and differ partly for their additive
and dominant effects. Some of these QTL show sex spe-
cific effects. Many of the QTL profile s possess mult iple
peaks especially in regions with a high marker density,
and confidence intervals mostly exceed 10 cM [39].
Therefore, QTL int ervals are rarely narrowed down to a
sufficiently small number of candidate loci to be able to
suggest one as the most probable causative gene.
Nevertheless, porcine chromosome regions, which
contain QTL, can be aligned with loci of expressed
genes, as well as with orthologous genes in man and
mouse using data from PigQTLdb ([4]; -
malgenome.org/QTLdb/pig.html). Today, QTL intervals
Geldermann et al. Genetics Selection Evolution 2010, 42:31
/>Page 12 of 15
canbecomparedwiththepiggenomesequencedata
(Sscrofa9, Wellcome Trust Sanger Inst itute 2009, http://
www.sanger.ac.uk/Projects/S_scrofa/) to investigate t he
action of single genes a nd their variants. The selection
of putative causative genes may consider groups of
genes that are regulated in parallel and are members of
the same metabolic pathway. Thus, the results of gen-
ome-wide QTL m apping are important for subsequent
analyses of specific genes as well as for selecting DNA
markers for breeding purposes.
Acknowledgements
The investigation was supported by the German
Research Foundation (DFG, grant nos. Mu616/6 and
Ge291/20), the EC programmes B RIDGE and INCO-
Copernicus (Contract no. ERBIC15CT960902), the
Czech Science Foundation (Grant No. 523/07/0353 and
523/06/1302), and the Institutional Research Plan of the
IAPG AS CR (AV0Z504505 15). The Meishan pigs used
in the experiments originated from a population pro-
vided by the Wageningen Agricultural University and
Euribrid, BV Boxmeer, The Netherlands.
Additional material
Additional file 1: Markers used for linkage and QTL analysis.The
used marker loci are shown together with literature references and
positions on the USDA MARC map. Moreover, the map positions,
numbers of alleles and numbers of informative meioses are listed for
each of the three crosses.
Additional file 2: Parameters of the traits. Numbers of observations,
phenotypic means, standard deviations and determination coefficients
are given for the considered traits of the F
2
animals and each cross.
0
2
4
6
8
10
12
24
22
20
18
16
14
0 20 40 60 80 120 160 200
S0025
S0064
S0102
PSMA4
S0115
SW581
S0212
PI2
IGH2
100
140 180 220 [cM]
CYP21A2
KE6
TNFB
TNFA
S0066
FOS
PO1A
F ratio
MxP
SSC7
fem.+mal.
female
male
FVCM
0 20 40 60 120 160 200
S0035
SW1329
SWR1057
S0087
RYR1
NPPB
HFABP
S0146
SW824
LEPR
P3
EAO
[cM]
100
140
140
220
S0003
EAH
A1BG
80
SSC6
fem.+mal.
female
male
FMR
0
2
4
6
8
10
12
24
22
20
18
16
14
F ratio
WxP
02040
140
SW949
SW980
SW2126
SW2456
SW2476
CAPN6
SW1943
SW2453
FMR1
0
2
4
6
8
10
12
28
26
24
22
20
18
16
14
SW2588
PA K 3
SLC25A5
ACSL4
SERPINA7
POU3F4
RPS4X
AR
SW259
XIST2
60
80
100 120
[cM]
F ratio
WxM
SSCX
fem.+mal.
female
male
PCOI
P = 0.01 threshold for
sex-specific models
P=
0.01
0.05
0.05
P = 0.01 threshold for
sex-specific models
P=
0.01
0.05
0.05
P = 0.01 threshold for
sex-specific models
P=
0.01
0.05
0.05
Figure 3 Examples of F ratio profiles calculated fo r all (females and males), female or male F
2
animals. For further explanations see
Figure 2.
Geldermann et al. Genetics Selection Evolution 2010, 42:31
/>Page 13 of 15
Additional file 3: Genome-wide threshold values. The threshold
values, which were calculated according to [19] and with 1000
permutations, are listed for the P < 0.05 and P < 0.01 significance levels.
Author details
1
Animal Breeding and Biotechnology, University of Hohenheim, Stuttgart,
Germany.
2
Institute of Animal Physiology and Genetics, Academy of Sciences
of the Czech Republic, Liběchov, Czech Republic.
3
Department of Animal
Breeding and Biotechnology, University of Hohenheim, Stuttgart, Germany.
Authors’ contributions
HG is responsible for most of the concept and design, for finding funding,
and for drafting the tables and manuscript. SC, AS and SP have carried out
the genotyping of marker loci and revised the manuscript. HB performed
the statistical analysis, created the figures and helped to draft the
manuscript.
All authors have read and approved the final manuscript.
Competing interests
The authors declare that they have no competing interests.
Received: 26 January 2010 Accepted: 28 July 2010
Published: 28 July 2010
References
1. Bidanel JP, Rothschild M: Current status of quantitative trait locus
mapping in pigs. PigNews Inform 2002, 23:39N-54N.
2. Geldermann H, Müller E, Moser G, Reiner G, Bartenschlager H, Cepica S,
Stratil A, Kuryl J, Moran C, Davoli R: Genome-wide linkage and QTL
mapping in porcine F
2
families generated from Pietrain, Meishan and
Wild Boar crosses. J Anim Breed Genet 2003, 120:363-393.
3. Hu ZL, Dracheva S, Jang W, Maglott D, Bastiaansen J, Rothschild MF,
Reecy JM: A QTL resource and comparison tool for pigs: PigQTLDB.
Mamm Genome 2005, 16:792-800.
4. Hu ZL, Fritz ER, Reecy JM: AnimalQTLdb: a livestock QTL database tool set
for positional QTL information mining and beyond. Nucleic Acids Res
2007, 35:D604-D609.
5. Müller E, Rogdakis E: Genetische Regulation des Fettstoffwechsels beim
Schwein. Hohenheimer Arbeiten, Reihe Tierische Produktion 1985, 131:7-28.
6. Strutz C: Phenotypic and genetic parameters of NADPH-generating
enzymes in porcine adipose tissue. Ph D thesis University of Hohenheim
1977.
7. Rogdakis E, Strutz C: Phänotypische und genetische Parameter für den
löslichen Proteingehalt im Schweinegewebe. Züchtungskunde 1978,
50:312-316.
8. Etherton TD: Subcutaneous adipose tissue cellularity of swine with
different propensities for adipose tissue growth. Growth 1980, 44:182-191.
9. Fiedler I, Wiesemuller W, Michelchen G, Kuhn G: Fat clogging, fat cell
count and fat cell size in swine in relation to age and feeding intensity.
Arch Tierernahr 1990, 40:681-687.
10. Müller E, Moser G, Bartenschlager H, Geldermann H: Trait values of growth,
carcass and meat quality in Wild Boar, Meishan and Pietrain pigs as well
as their crossbred generations. J Anim Breed Genet 2000, 117:189-202.
11. Lowry OH, Rosebrough NJ, Farr AL, Randall RJ: Protein measurement with
the Folin phenol reagent. J Biol Chem 1951, 193:265-275.
12. Hirsch J, Gallian E: Methods for the determination of adipose cell size in
man and animals. J Lipid Res 1968, 9:110-119.
13. Etherton TD, Thompson EH, Allen CE: Improved techniques for studies of
adipocyte cellularity and metabolism. Lipid Res 1977, 18:552-557.
14. Kalbitz S: Untersuchungen der Insulinrezeptoren und des
Glukosemetabolismus im Rückenspeck von Schweinen verschiedener
Zuchtlinien. Ph D thesis University of Hohenheim 1986.
15. Green P, Falls K, Crooks S: Documentation for CRI-MAP, Version 2.4
Washington University School of Medicine, St. Louis, MO 1990.
16. Keats BJ, Sherman SL, Morton NE, Robson EB, Buetow KH, Cartwright PE,
Chakravarti A, Francke U, Green PP, Ott J: Guidelines for human linkage
maps: an international system for human linkage maps (ISLM, 1990).
Genomics 1991, 9:557-560.
17. Haley CS, Knott SA, Elsen JM: Mapping quantitative trait loci in crosses
between outbred lines using least squares.
Genetics 1994, 136:1195-1207.
18. Cepica S, Bartenschlager H, Geldermann H: Mapping of QTL on
chromosome X for fat deposition, muscling and growth traits in a wild
boar × Meishan F
2
family using a high-density gene map. Anim Genet
2007, 38:634-638.
19. Churchill GA, Doerge RW: Empirical threshold values for quantitative trait
mapping. Genetics 1994, 138:963-971.
20. Miller RG: Simultaneous Statistical Interference Springer Verlag, Berlin, 2 1981,
6-8.
21. Liu LT, Ren J, Li L, Li WB, Yang B, Zhu WC, Guo BL, Ma JW, Huang LS: A
genome scan for loci affecting adipocyte size and number in abdominal
fat in a White Duroc × Erhualian F
2
resource population. Animal 2009,
3:632-636.
22. Van Laere A-S, Nguyen M, Braunschweig M, Nezer C, Collette C, Moreau L,
Archibald AL, Haley CS, Buys N, Tally M, Andersson G, Georges M,
Andersson L: A regulatory mutation in IGF2 causes a major QTL effect on
muscle growth in the pig. Nature 2003, 425:832-836.
23. Bidanel JP, Milan D, Iannuccelli N, Amigues Y, Boscher MY, Bourgeois F,
Caritez JC, Gruand J, Le Roy P, Lagant H, Quintanilla R, Renard C, Gellin J,
Ollivier L, Chevalet C: Detection of quantitative trait loci for growth and
fatness in pigs. Genet Sel Evol 2001, 33:289-309.
24. Ovilo C, Perez-Enciso M, Barragan C, Clop A, Rodriguez C, Oliver MA,
Toro MA, Noguera JL: A QTL for intramuscular fat and backfat thickness
is located on porcine chromosome 6. Mamm Genome 2000, 11:344-346.
25. Edwards DB, Ernst CW, Tempelman RJ, Rosa GJ, Raney NE, Hoge MD,
Bates RO: Quantitative trait loci mapping in an F
2
Duroc × Pietrain
resource population: I. Growth traits. J Anim Sci 2008, 86:241-253.
26. De Koning DJ, Janss LL, Rattink AP, Van Oers PA, De Vries BJ, Groenen MA,
Van der Poel JJ, De Groot PN, Brascamp EW, Van Arendonk JA: Detection
of quantitative trait loci for backfat thickness and intramuscular fat
content in pigs (Sus scrofa). Genetics 1999, 152:1679-1690.
27. Rohrer GA: Identification of quantitative trait loci affecting birth
characters and accumulation of backfat and weight in a Meishan-White
Composite resource population. J Anim Sci 2000, 78:2547-2553.
28. Malek M, Dekkers JC, Lee HK, Baas TJ, Rothschild MF: A molecular genome
scan analysis to identify chromosomal regions influencing economic
traits in the pig. I. Growth and body composition. Mamm Genome 2001,
12:630-636.
29. Kim KS, Thomsen H, Bastiaansen J, Nguyen NT, Dekkers JC, Plastow GS,
Rothschild MF: Investigation of obesity candidate genes on porcine fat
deposition quantitative trait loci regions. Obes Res 2004, 12:1981-1994.
30. Harlizius B, Rattink AP, De Koning DJ, Faivre M, Joosten RG, Van
Arendonk JA, Groenen MA: The X chromosome harbors quantitative trait
loci for backfat thickness and intramuscular fat content in pigs. Mamm
Genome 2000, 11:800-802.
31. Demars J, Riquet J, Sanchez MP, Billon Y, Hocquette JF, Lebret B,
Iannuccelli N, Bidanel JP, Milan D, Gondret F: Metabolic and histochemical
characteristics of fat and muscle tissues in homozygous or heterozygous
pigs for the body composition QTL located on chromosome 7. Physiol
Genomics 2007, 30:232-241.
32. Cepica S, Masopust M, Knoll A, Bartenschlager H, Yerle M, Rohrer GA,
Geldermann H: Linkage and RH mapping of 10 genes to a QTL region
for fatness and muscling traits on pig chromosome X. Anim Genet 2006,
37:603-604.
33. Abasht B, Pitel F, Lagarrigue S, Le Bihan-Duval E, Le Roy P, Demeure O,
Vignoles F, Simon J, Cogburn L, Aggrey S, Vignal A, Douaire M: Fatness
QTL on chicken chromosome 5 and interaction with sex. Genet Sel Evol
2006, 38:297-311.
34. Taylor BA, Tarantino LM, Phillips SJ: Gender-influenced obesity QTLs
identified in a cross involving the KK type II diabetes-prone mouse
strain. Mamm Genome 1999, 10:963-968.
35. Wang S, Yehya N, Schadt EE, Wang H, Drake TA, Lusis AJ: Genetic and
genomic analysis of a fat mass trait with complex inheritance reveals
marked sex specificity. PLoS Genet 2006, 2:e15.
36. Yang X, Schadt EE, Wang S, Wang H, Arnold AP, Ingram-Drake L, Drake TA,
Lusis AJ: Tissue-specific expression and regulation of sexually dimorphic
genes in mice. Genome Res 2006, 16:995-1004.
Geldermann et al. Genetics Selection Evolution 2010, 42:31
/>Page 14 of 15
37. Bhasin JM, Chakrabarti E, Peng DQ, Kulkarni A, Chen X, Smith JD: Sex
specific gene regulation and expression QTLs in mouse macrophages
from a strain intercross. PLoS One 2008, 3:e1435.
38. Bonduriansky R, Chenoweth SF: Intralocus sexual conflict. Trends Ecol Evol
2009, 24:280-288.
39. Darvasi A, Soller M: A simple method to calculate resolving power and
confidence interval of QTL map location. Behav Genet 1997, 27:125-132.
40. Herbst K: Entwicklung, Stand und Perspektiven der Schweineproduktion
in der Bundesrepublik Deutschland. Züchtungskunde 1980, 52:304-323.
doi:10.1186/1297-9686-42-31
Cite this article as: Geldermann et al.: Genome-wide mapping of
Quantitative Trait Loci for fatness, fat cell characteristics and fat
metabolism in three porcine F
2
crosses. Genetics Selection Evolution 2010
42:31.
Submit your next manuscript to BioMed Central
and take full advantage of:
• Convenient online submission
• Thorough peer review
• No space constraints or color figure charges
• Immediate publication on acceptance
• Inclusion in PubMed, CAS, Scopus and Google Scholar
• Research which is freely available for redistribution
Submit your manuscript at
www.biomedcentral.com/submit
Geldermann et al. Genetics Selection Evolution 2010, 42:31
/>Page 15 of 15