Báo cáo sinh học: "Genetic differentiation of European grayling (Thymallus thymallus) populations in Serbia, based on mitochondrial and nuclear DNA analyses" pot
Bạn đang xem bản rút gọn của tài liệu. Xem và tải ngay bản đầy đủ của tài liệu tại đây (2.44 MB, 11 trang )
RESEARCH Open Access
Genetic differentiation of European grayling
(Thymallus thymallus) populations in Serbia, based
on mitochondrial and nuclear DNA analyses
Saša Marić
1*
, Andrej Razpet
2
, Vera Nikolić
1
, Predrag Simonović
1
Abstract
Background: The structure and diversity of grayling (Thymallus thymallus) populations have been well studied in
most of its native habitat; however the southernmost populations of the Balkan Peninsula remain largely
unexplored. The purpose of this study was to assess the genetic diversity of Serbian grayling populations, detect
the impact of stocking and provide guidelines for conservation and management.
Methods: Eighty grayling individuals were collected from four rivers (Ibar, Lim, Drina and Rzav). The mitochondrial
DNA control region (CR; 595 bp of the 3’end and 74 bp of flanking tRNA) and the ATP6 gene (630 bp fragment)
were sequenced for 20 individuals (five from each locality). In addition, all individuals were genotyped with 12
microsatellite loci. The diversity and structure of the populations as well as the recent and ancient population
declines were studied using specialized software.
Results: We detected three new haplotypes in the mtDNA CR and four haplotypes in the ATP6 gene of which
three had not been described before. Previously, one CR haplotype and two ATP6 gene haplotypes had been
identified as allochthonous, originating from Slovenia. Reconstruction of phylogenetic relations placed the
remaining two CR haplotypes from the River Danube drainage of Serbia into a new clade, which is related to the
previously described sister Slovenian clade. These two clades form a new Balkan clade. Microsatellite marker
analysis showed that all four populations are genetically distinct from each other without any sign of intra-
population structure, although stocking of the most diverse population (Drina River) was confirmed by mtDNA
analysis. Recent and historical population declines of Serbian grayling do not differ from those of other European
populations.
Conclusions: Our study shows that (1) the Ibar, Lim and Drina Rivers grayling populations are genetically distinct
from populations outside of Serbia and thus should be managed as native populations in spite of some
introgression in the Drina River population and (2) the Rzav River population is not appropriate for further stocking
activities since it originates from stocked Slovenian grayling. However, the Rzav River population does not
represent an immediate danger to other populations because it is physically isolated from these.
Background
The recent natural dispersal area of t he European gray-
ling ( Thymallus thymallus) extends westward to France
and Great Britain, northward across Fenoscandinavia
and northern Russia, eastward to the Ural Mountains
near the Kara River [1] and southward to the head-
waters in the drainage areas of Ibar (Serbia) and Lim
(the Ljuča River, Montenegro) Rivers in the western
Balkans.
Fossil evidence suggests that European grayling inhab-
ited Europe long before the Pleistocene cold periods [2],
corroborating the pre-glacial introgression of grayling
and its expansion across Europe, as also suggested by
Weiss et al. [3]. Numerous DNA marker-based studies
on population genetic structure, phylogeography and
phylogeny of European grayling are now available for
various geographic regions (e.g. [3-8]), as well as on
local scales (e.g. [9-18]). Studies on the matrilineal
* Correspondence:
1
University of Belgrade, Faculty of Biology, Institute of Zoology, Studentski
trg 16, 11001 Belgrade, Serbia
Full list of author information is available at the end of the article
Marić et al . Genetics Selection Evolution 2011, 43:2
/>Genetics
Selection
Evolution
© 2011 Marićć et al ; licensee BioMed Central Ltd. This is an Open Access article distributed under the terms of the Creative Commons
Attribution License ( which permits unrestricted use, dis tribution, and reproduct ion in
any medium, provided the original work is properly cited.
phylogeography and post-glacial dispersal routes of
European grayling have revealed 27 haplotypes in the
ND-5/6 and cyt-b/D-loop (CR) regions of mitochondrial
DNA [5], 58 haplotypes in th e D-loop (CR) reg ion [3]
and 30 ND -1 haplotypes in the ND-5/6 gene r egion [7].
All the results suggest the existence of distinct Danubian
clades, as well as Central-Eastern, Central-Western,
Northern/Northeastern and mixed clades [19]. Rather
distinct grayling clades were detected in the Adriatic
region and in the Loire basin with a single haplotype
(At1) that is highly divergent compared to those of the
remaining clades [3]. The assumed refugial region for (i)
the Northern/Northeastern-European clade was the area
north of the Caspian and Black Seas, (ii) the Central-
Eastern European clade, the ice-free tributaries of Vis-
tula and Elbe Rivers, (iii) the Central-Western Europe,
the ice-free tributaries of Rhine, Main and upper
Danube, and (iv) the Danubian clades, the lower Danube
drainage area, i.e., in the Balkan Peninsula [19]. Based
on CR mtDNA sequence analyses and calibration of
molecular clock applied to the nucleotide divergence of
these sequences between the major grayling clades with
a CR mutation rate of 1% per million years (MY), Froufe
et al. [4] have dated the colonization of Europe to the
Pliocene-Pleistocene boundary around 4.6 to 1.6 million
years ago (MYA), far before the onset of Pleistocene ice
age. However, during the late Pleis tocene and Holocene
glaciations, it is assumed that se condary contacts
occurred in all drainages, e.g. in the upper reaches of
the rivers Main, Danube, Elbe and Rhine (Lake Con-
stance) [19]. Koskinen et al. [6] have revealed that a
substantial proportion of molecular variation (44%) in
European grayling exits between populations, whereas
Gum et al. [7,16] have revealed that about 25% of the
total genetic variation is explained by differ ences
between major drainage systems, about 11 to 20% by
differences between populations within drainages and
about 57 to 64% by differences within populations.
The Balkan Peninsula along with the Apennine and
Iberian Peninsulas, were a refuge area during the Pleis-
tocene glaciations and therefore might represent cross-
roads of different evolutionary patterns and processes
[20,21]. The Balkan Peninsula, in contrast to the
Apennine and Iberian Peninsulas, is poorly explored
(except Slovenia). This part of Europe, very important
for post-glaci al faunal evolution an d colonization, i s
noted as a biodiversity hotspot [22,23]. The last
(Würm) glaciation in Europe ended ~10 000 years ago
coinciding with both colonization of the present gray-
ling habitat and decline of grayling populations. Based
on the 34 European populations (none from the
Balkans), b etween 1000 to 10000 years ago, population
sizes were reduced to 0.03-1.2% of their historical
sizes [24].
An even more recent decline of European grayling
populations throughout central Europe, due to pollution,
habitat destruction, river engineering, predation from
pis civorous birds and overfishing [1,13,15,25-27], is also
characteristic to Serbian grayling populations. Janković
[28] has reported results for six Serbian rivers with gray-
ling populations (Drina, Lim, Uvac, Jadar, Studenica and
Ibar). The populations from Uvac, Jadar and Studenica
Rivers went extinct, while one new population was
established in the Rzav River through stocking with fish
originating from an unknown source population from
Slovenia. Population decline leads to an increase in
man agement activities that involve rearing and stocki ng
grayling, which may cause a change in genetic architec-
ture and extinction of natural populations [29].
The main goal of the present study was to investigate
the genetic diversity of grayling populations in Serbia,
using two mtDNA loci (CR and ATP6), in order to clar-
ify the phylogeography of grayling populations in this
previously unstudied part of its native range. Addition-
ally, 12 microsatellite loci were analyzed, in order to (i)
characterize the genetic variability and differentiation,
(ii) compare recent and historical declines in previously
studied European populations [24] with that of Serbian
populations and (iii) examine whether it is possible to
identify non-introgressed indigenous populations o f
grayling for future management and supportive
breeding.
Methods
Sampling and DNA isolation
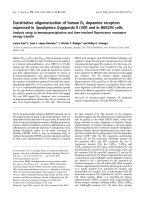
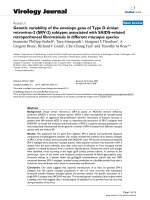
Eighty grayling individuals from four Serbian locations
across the Danubian draina ge were collected by electro-
fishing and angling between 2007 an d 2008 (Table 1
and Figure 1). Fin clips were sampled and stored in 96%
ethanol. Total DNA was isolated from this tissue using
the Wizard Genomic DNA Puri fication Kit (Promega),
following the supplier’s instructions.
Fifty-seven haplotypes from GenBank (accession num-
bers AF522395-AF522452) were used for the phyloge-
netic analysis and outgroup taxa included three
individuals of Thymallus arcticus (AF522453), Th ymal -
lus grubei (AF522454) and Thymallus brevir ostris
(AF522455).
The number of geographical rivers sampled for
Serbian grayling in this study was limited and could not
be increased because the four rivers included are the
only ones remaining in Serbia today, with native gray-
ling occurring only in three of these (see Introduction,
Janković [28]).
Mitochondrial DNA sequence analysis
Two mtDNA loci, control region (CR) and ATP6
were amplified in 20 individuals by polymerase chain
Marić et al . Genetics Selection Evolution 2011, 43:2
/>Page 2 of 11
reaction (PCR). The complete CR [1043 base pairs (bp)]
and 162 bp of the flanking tRNA were amplified u sing
the LRBT-25 and LRBT-1195 primers [15]. The com-
plete ATP6 gene (648 bp) was amplified using the
L8558 and H9208 primers [30].
The following PCR conditions were used: each reac-
tion mixture (30 μL) contained 21.6 μLH
2
O(21μL
H
2
OforATP6),3μL 10 × PCR buffer, 0.75 μL10mM
of each primer, 1 .2 μL25mMMgCl
2
(1.8 μL25mM
MgCl
2
for ATP6), 1.5 μL 0.2 mM dNTP, 0.2 μLFer-
mentas Taq polymerase and 1 μL of template DNA
(~100 ng of genomic DNA); the cycle parameters were
as follows: initial denatur ation (95°C, 3 min) followed by
32 cycles of strand denaturation (95°C, 45 s), primer
annealing (55°C, 45 s) and DNA extension (72°C, 60 s).
All PCR amplifications were performed in a program-
mable thermocycler GeneAmp
®
PCR System 9700
(Applied Biosystems). Amplified DNA fragments were
run on a 1.5% agarose gel and subsequently isolated
from the gel using the QIAEX II gel Extraction Kit
(QIAGEN).
All sequencing reactions were prepared using a Big-
Dye Terminator v3.1 Cycle Sequencing Kit (Applied
Biosystems) according to the manufacturer’s recommen-
dations. The 3’ end of the 595 bp fragment of the
mtDNA CR wit h the 74 bp of flanking tRNA were
sequenced using primer LRBT-1195 [15]. The 5 ’end of
the 630 bp ATP6 fragment was sequenced using primer
L8558 [30]. The amplified, fluorescently labeled and ter-
minated DNA was salt-precipitated a nd analyzed on an
ABI Prism 3130xl Genetic Analyzer.
Microsatellite marker analysis
Twelve microsatellite loci were isolated and charac-
terized as previously d escribed i.e. BFRO004 [31],
BFRO005 to BFRO008 [9], BFRO010 and BFRO011
[32], BFRO013 [11], BFRO015 to BFRO018 [33]. They
were amplified in 80 individuals using fluorescently
labeled f orward primers. The following PCR conditions
(10 μL reactions) w ere used: 6.325 μLH
2
O, 1 μL10×
PCR buffer, 0.25 μL 10 mM of each primer, 0.6 μL
25 mM MgCl
2
,0.5μL 0.2 mM dNTP, 0 .075 μLFermen-
tas Taq p olymerase and 1 μL of template DNA (~100 ng
of genomic DNA); the cycle parameters were as
follows: initial denaturation (94°C, 3 min) followed by
30 cycles of strand denaturation (94°C, 45 s), primer
annealing (55°C, 30 s for BFRO004 to BFRO010, and
60°C, 30 s for BFRO011 to BFRO018) and DNA exten-
sion (72°C, 5 s). Fragment analysis was performed on a
3130xl Genetic Analyzer and genotyped using Gene-
Mapper v4.0.
Mitochondrial DNA data analysis
DNA sequences were aligned using the computer pro-
gram ClustalW [34]. Sequence polymorphism was
assessed using DNAsp ver. 4.10 [35] and sequence
divergence was e stimated by the net nucleotide diver-
gence (D
a
) using MEGA version 2.1 [36].
Aligned haplotypes were imported into the program
PAUP Version 4.0b10 [37] for phylogenetic analysis.
Neighbour-Joining (NJ) and maximum p arsimony (MP)
analyses were carried out for phylogenetic reconstruc-
tion. For the NJ analysis, a HKY85 model of substitution
was chosen. Support for the nodes was obtained with
1000 bootstrap replicates. For the MP analysis, inser-
tions or deletions (indels) were included as a fifth char-
acter, and the inferred phylogeny was estimated with
50%majorityruleconsensustree.Aheuristicsearch
(1000 replicates) with Tree Bisection Reconnection
(TBR) branch-swapping was employed to find the most
parsimonious trees.
Relations among haplotypes were also determined
using the TCS 1.2 program [38] with a connection limit
fixed at 24 steps to include all the different haplotypes.
Gaps were analyzed as a fifth character.
Microsatellite marker data analysis
Microsatellite allele frequencies, expected (H
E
), non-
biased (H
n.b
)andobserved(H
O
) heterozygosities were
calculated with GENETIX 4.04 [39]. FSTAT 2.9.3.2 [40]
Table 1 Sample locations with a summary of mtDNA haplotype frequencies (all underlined haplotypes are described
for the first time)
Haplotype frequency
Nb samples ATP6 gene Control Region Combined haplotypes
Code populations msDNA mtDNA
Slo Soc18 Bal BoDr Da25 Da27 Da29 Da25Slo Da25Soc18 Da27Bal Da29BoDr
1. Rzav 20 5 1 4 - - 5 - - 1 4 - -
2. Lim 20 5 5 5- - - 5 -
3. Ibar 20 5 5 5- - - 5 -
4. Drina 20 52-21221 2 - 2 1
∑ 80 20 3 4 12 1 7 12 1 3 4 12 1
Sequences of the newly described haplotypes are available in GenBank under Accession numbers: Bal: HM641130, BoDr: HM636920, Slo: HM636921, Da25:
HM636922, Da27: HM636923 and Da29: HM636924.
Marić et al . Genetics Selection Evolution 2011, 43:2
/>Page 3 of 11
was used to calculate deviations from Hardy-Weinberg
expectations (HWE), allelic richness and pair-wise F
ST
values, all based on 1000 permutations. Genetic relation-
ships between individuals were estimated as the propor-
tion of shared alleles at each locus, i.e. allele sharing
distances (D
AS
) [41]. A matrix of D
AS
was used to
construct Neighbour-Joining trees of individuals and
populations with POPULATIONS software [42].
Recent population declines (2N
e
-4N
e
generations ago)
can be detected with BOTTLENECK 1.2.02 [43] using
the recommended stepwise mutation model (SMM) and
the two-phase model (TPM) with 95% of single-step
Figure 1 Sampling locations in Serbia. Names of sampling sites are listed in Table 1.
Marić et al . Genetics Selection Evolution 2011, 43:2
/>Page 4 of 11
mutations and variance mutation size set to 12. To
detect historical population declines, the coalescent ana-
lysis approach implemented in MSVAR 1.3 assuming
strict SMM was used [44]. For the exponential model,
we followed the s ettings used by Swatdipong et al. [24]
with a five-year generation time discarding the first 10%
of 2 × 10
8
iterations.
Population structure was inferred using the STRUC-
TURE program [45], which seeks solutions for a given
number of clusters K applied to genotypic data in such
a way that each cluster is in or close to Hardy-Weinberg
and linkage equilibrium [46]. For runs estimating ln Pr
(X|K) under a certain K, different run lengths were used
(from 20000 to 100000 burn-in and 100000-2000000
tot al length, repeated 7 times for each K) depending on
convergence. We applied the ΔKmethod[47]toesti-
mate the most probable K.
Results
Mitochondrial DNA sequence analysis
Three new haplotypes were detected by sequencing the
mtDNA CR: Da25, Da27 and Da29. Haplotype Da25
was present in the Rzav River population with a 100%
frequency and in the Drina River population with a 40%
frequency. Haplotypes Da25 and Da24 share synapo-
morphies at positions 622, 625, 626 and 635, and at
positio n 708 with haplotypes Da22 and Da23 (See addi-
tional file 1: Variable nucleotide positions for CR haplo-
types). Haplotypes Da22, Da23 and Da24 were observed
in the population of the Sava River drainage area in
Slovenia [3]. Haplotype Da27 was dominant in th e sam-
ples from all localities in Serbia, with a 100% frequency
for the Ibar and Lim Rivers and a 40% frequency for the
Drina River. Haplotype Da29 was present exclusively in
the Drina River population with a 20% frequency. Hap-
lotypes Da27 and Da 29 differed at five poly morphic
positions and their genetic distance is about 0.75%. Hap-
lotype Da27 and Da29 and haplotype Da25 differed at
nine and ten polymorphic positions, respectively, and
the genetic distance between these is about 1.5%.
Sequencing of the ATP6 gene revealed four haplotypes
(Soc18, Slo, BoDr and Bal). Haplotype Soc18 had already
been described in the population of Soča River in Slove-
nia [4] while in Serbia it was found only in samples
from the Rzav River with an 80% frequency. The other
three haplotypes had never been described before. Hap-
lotype Slo was present in the populations of the Rzav
River with a 20% frequency and the Drina River with a
40% frequency. Haplotype Bal was dominant in the sam-
ple analyzed here and was present in t he populations of
the Ibar and Lim Rivers wi th a 100% frequency and in
the Drina River with a 40% frequency. Haplotype BoDr
was found only in the Drina River sam ples with a 20%
frequency. Unlike the mtDNA CR for which up to 10
polymorphic positions were identified among the three
haplotypes, only three polymorphic positions were
detected in the four ATP6 haplotypes and all were silent
mutations. The synapomorphic position 34 discrimi-
nated between haplotypes Soc18 and Slo and haplotypes
Bal and BoDr, which differed by two polymorphic posi-
tions at most, i.e. by a genetic distance of up to 0.32%
(See additional file 2: Variable nucleotide positions for
ATP6 gene haplotypes). Combining three CR and four
ATP6 haplotypes produced four combined haplotypes
(Table 1), since the samples that possessed different
ATP6 haplotypes (Soc18 and Slo) shared the same CR
haplotype Da25.
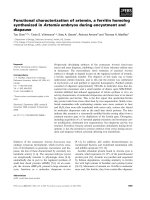
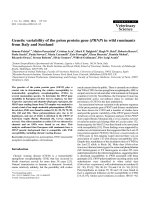
Reconstructing phylogenies by both Neighbour-Joining
and parsimony methods revea led that haplotype Da25
and the Slovenian haplotypes from the Sava River drai-
nage area form a sister clade of the new clade contain-
ing haplotypes Da27 and Da29 from the Danube River
drainage area of Serbia (Figure 2). Both sister clades
form the new Balkan clade.
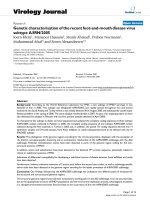
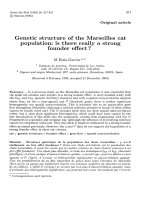
The minimum spanning haplotype network of genea-
logical relationship s among the haplotypes revealed that
haplotype Da25 is closest to haplotype Da24 in the
Slovenian group of haplotypes in the Sava River drainage
area (Figure 3) from which it differed by a single muta-
tion, while it differed by nine or more mutations from
other Slovenian haplotypes from the same drainage area
(Da22 and Da23). Haplotypes Da27 and Da29 constitute
a special group in the network and occupy a position
which is most closely related to the Slov enian group of
haplotypes from which they differ by six or more
mutations.
Microsatellite marker analysis
Allelic richness ranged from 1.58 to 4.08 and observed
heterozygosity ranged from 0.16 to 0.47. The highest
levels of allelic richness (4.08), observed (0.47) and
expected (0.49) heterozygosities were detected in the
Drina River samples, while those of the Rzav and Ibar
Rivers had very low levels of heterozygosity. No devia-
tions from Hardy-Weinberg equilibrium were detected
(Table 2).
Bottlenecks
Recent bottleneck was detected in the Rzav River (SMM
and TPM), P < 0.05. Mode-shift test also revealed dis-
tortion from L-shape allele frequency di stribut ion in the
same river. Coalescent analyses assuming an exponential
population growth/decline estimated that the population
decline started 1000 - 10 000 years ago with the present
population sizes representing 0.03-0.44% of the histori-
cal sizes (Figure 4).
Marić et al . Genetics Selection Evolution 2011, 43:2
/>Page 5 of 11
Population differentiation, clustering and introgression
Pairwise F
ST
comparison revealed significant differences
among all populations (Table 3). This was also visible i n
the D
AS
based tree (Figure 5) and in the individual clus-
tering results b y Structure, where four clusters corre-
sponded roughly to the four populations from Serbia
(Figure 6). Further intra-population partitioning using
Structure did not reveal any new cluster and no hy brid
population was detected. (See additional file 3: The ori-
ginal data used to perform this analysis).
Discussion
Mitochondrial DNA
Two combined haplotypes, Da27Bal and Da29BoDr are
autochthonous for populations from Serbian waters
while haplotypes Da25Soc18 and Da25Slo origina te
Figure 2 Phylogeny of mtD NA control region haplotypes . NJ phylogram based on the data set of Weiss et al. [3] including 58 haplotyp es
plus three new sequences of the 3’end of the 595 bp fragment of mtDNA CR and 74 bp of flanking tRNA (Phe) from the Serbian part of
Danubian drainage; the tree was rooted with T. grubei, T. brevirostris and T. arcticus sequences of mtDNA CR; node support is shown by per cent
bootstraps for NJ (1000 replicates) above, and maximum parsimony consensus (1000) below; italicized taxa represent newly sampled haplotypes.
Marić et al . Genetics Selection Evolution 2011, 43:2
/>Page 6 of 11
from Slovenia (Table 1). The practice o f stocking with
grayling was common in many European countries
[15,25,48]. Despite the absence of written records on
stocking in Rzav and Drina Rivers with grayling fry ori-
ginating from Slovenian hatcheries, testimonies from the
older members of the Anglers’ Association of A rilje do
agree that grayling was introduced into the Rzav River
from Slovenia in the 1980’ s. This is supported by the
fact that haplotype Da25 also occurs in Slovenian popu-
lations (unpublished data). The 0.75% genetic distance
between autochthonous Da27 and Da29 haplotypes f or
which the mutation r ate is estimated at about 1% per
million years [3,14,49], suggests that a time period of
about 750 thousand years separates the two haplotypes
involving probably two inde pendent colonization events.
This assumption is supported by the even greater
genetic distance (~1.35%) occurring b etween the two
groups of haplotypes (Da22, Da23) and (Da24, Da25) in
the Slovenian grayling sub-clade.
Within the Balkan clade, the division between north-
ern (Slovenian) and southern (Serbian) populations is
obvious. This northern/southern differentiation has also
been recorded in another Danubian salmonid species i.e.
huchen (Hucho hucho) on the basis of microsatellite
data [50].
The grayling Balkan and the Scandinavian clades are
sister clades (Figure 2), suggesting a common ancestry
in the drainage areas of Black and Caspian seas. This is
in agreement with the ancestral character of the grayling
populations from a Danubian refugium in relation to the
northern populations [3,5]. The intermediate position of
the Da29 haplotype on the network between northern
Balkan and Scandinavian clades supports this statement.
Da29couldbeconsideredasthebasalhaplotypeofthe
Balkan clade, with the genetic distance between Da29
and other haplotype s ranging betwe en 0.75 and 1.65%,
which is equivalent to the time scale of 750 000-1.65
million years when grayling of northern, Slovenian and
southern, Serbian clusters differentiated. This is similar
Figure 3 mtDNA control region haplotype network relating grayling with previously published data [3]. Lines, regardless of length,
represent single mutational events and link the haplotypes; small black circles represent missing or theoretical haplotypes; the three haplotypes
found in Serbia are in black.
Table 2 Genetic diversity indices of microsatellite marker
data
Population Nb H
E
H
n.b.
H
O
F
IS
Ar
1. Rzav 20 0.27 0.27 0.27 0.02 1.75
2. Lim 20 0.29 0.29 0.30 -0.02 2.83
3. Ibar 20 0.15 0.16 0.16 -0.05 1.58
4. Drina 20 0.49 0.50 0.47 0.07 4.08
Nb: number of individuals; H
E
: expected heterozygosity in the population; H
n.b:
non biased heterozygosity; H
O
: observed heterozygosity; F
IS:
values showed no
statistically significant deviations from HWE (P < 0.001); Ar: allelic richness.
Marić et al . Genetics Selection Evolution 2011, 43:2
/>Page 7 of 11
to the distance (~1.5%) found between the two northern
and southern Alpine clades [3].
Including the ATP6 gene to reconstruct phylogenetic
relationships in European grayling clades is not very
useful at present because most studies are based on CR
or other mtDNA sequences. Analyzing the ATP6 gene
in grayling populations of Serbia confirms the division,
previously observed from CR sequencing results, into
two subclades (the northern i.e. Slovenian and the
southern i.e.Serbian) in the Balkan clade defined by the
synapomorphy at position 34 of the ATP6 gene (see
additional file 2).
Results obtained so far suggest that the ATP6 gene
will be a useful marker for future investigations on
Europe an grayling populations, since it provides interest-
ing information on genetic variabilit y. This could be
important for decisions in conservation and manageme nt
of grayling populations.
Microsatellite markers
In terms of microsatellite diversity (allelic richness,
observed and expected heterozygosities), populations
from this study are comparable to other populations
[7,51]. F
ST
pairwise comparisons and Structure analyses
reveal a strong divergence betw een Serbian grayling
populations, which is not characteristic of Slovenian
grayling in the Danubian drainage [11,52]. Recent bot-
tleneck has been shown in population from the Rzav
River, which has suffered a recent decline. In addition,
the Rzav River habitat is relatively small and was initially
stocked with (presumably) a small number of fish from
Slovenia.
Serbian locations represent the furthest grayling
habitats from the maximal extent of ice sheets [21] and
possibly grayling glacial refugium (or closest to it).
Nevertheless the historical decline of Serbian popula-
tions is comparable with other European populations
analyzed by Swatdipong et al. [24] and is dated between
1000 and 10 000 years ago.
The Rzav population shares 19 out of 21 al leles (90%)
with Slovenia n populations (Sava, Obrh and Unec com-
bine d), while the Drina, Lim and Ibar populations share
47, 56 and 53% of alleles with Slovenian populations,
respectively. The two alleles in the Rzav population not
shared with Slovenian populations are found in other
Serbian populations, which means that there is no Rzav
specific allele. This is not surprising since the river was
not naturally inhabited by grayling. While stocking of
the Rzav River is confirmed both by the mtDNA haplo-
types (100% Da25) and the 90% alleles shared with Slo-
venian populations, the sit uation in the Drina River is
different. Although 40% of the Drina River samples had
the Da25 haplotype, hybridization with non-native gray-
ling was not detected by nuclear markers. The percen-
tage of shared alleles with the Slovenian populations
was lowest in Drina River (47%), most likely because the
population had already the highest genetic diversity
prior stocking. Influence of stocking in the Drina River
was not detected in its tributary i.e. t he Lim River,
which is in accordance to t he generally low migration
Figure 4 Estimated time since the start of population decline using MSVAR [44] (posterior distribution) based on microsatellite
marker data.
Table 3 Paired values of F
ST
above and D
AS
below the
diagonal of microsatellite marker data
Rzav Lim Ibar Drina
Rzav 0,513* 0,624 0,340*
Lim 0,437 0,358* 0,178*
Ibar 0,480 0,176 0,226*
Drina 0,343 0,146 0,172
* P < 0.001.
Marić et al . Genetics Selection Evolution 2011, 43:2
/>Page 8 of 11
Figure 6 Estimated population structure as inferred by STRUCTURE analysis of microsatellite marker DNA data. Black lines separate
sampling sites, the most probable K = 4 is based on ΔK method [47]; no further structures were detected in subsequent rounds and within
sampling locations (K = 1).
Figure 5 Neighbour-Joining individuals (left) and population (right) trees based on D
AS
estimated from 12 microsatellite DNA loci.
Individuals from the Drina, Lim and Ibar Rivers are labeled with circles, squares and triangles respectively, Rzav is unlabeled.
Marić et al . Genetics Selection Evolution 2011, 43:2
/>Page 9 of 11
rates for the species [6,16,53 ]. While Lim and Ibar Riv-
ers are inhabited by native non-introgressed grayling of
lower genetic diversity, the Drina River population is
admixed and the most diverse in the region.
Conclusions
Serbian grayli ng populations are gene tically distinct
from Slovenian and other European populations. In
order to preserve their overall genetic diversity and
integrity, further stocking of non-native fish from other
regions o r from allochthonous populations in the Rzav
Riv er should be stopped. Populations from the Ibar and
Lim Rivers (which show no signs of introgression of
non-native grayling), as well as the populatio n from the
Drina River should be regarded as native and subject to
proper management. The population from the Drina
Riv er is the most diverse in this study and the only one
with the mtDNA haplotype Da29. It probably represents
the most valuable genetic resource in the region. How-
ever, any future management such as supplementary
stocking of hatchery-reared Drina River grayling should
take into consideration genetic testing prior formation
of brood stock, because introgression has been detected.
Since the area studied here represents only a minor part
of the Balkan P eninsula, genetic polymo rphism of the
grayling within the region as a whole may be even
higher, because grayling from the countries adjacent to
Serbia (i.e., Montenegro and Bosnia-Herzegovina) have
not been studied so far.
Additional material
Additional file 1: Variable nucleotide positions for mtDNA CR
haplotypes defined in this study (underlined) and haplotypes from
other European clades. Positions are homologous to the T. thymallus
haplotype Da1 (Accession number. AF522395) and correspond to the
control region (430-1024), and the tRNA phenylalanine gene (1025-1098)
Asterisks refer to base pair deletions or insertions, dashes represent
concordance with the Da1 haplotype
Additional file 2: Variable nucleotide positions for mtDNA ATP6 gen
haplotypes defined in this study. Positions are homologous to the T.
thymallus haplotype Soc18 (Accession number. AY779004) and
correspond to the ATP6 gene (14-643); dashes represent concordance
with the Soc18 haplotype
Additional file 3: Individual microsatellite marker data. Individual
microsatellite marker data in each population for Tables 2 and 3 and
Figures 4 to 6
Acknowledgements
This work was supported by Ministry of Science and Technological
Development of the Republic of Serbia (Grant No. 173025).
Author details
1
University of Belgrade, Faculty of Biology, Institute of Zoology, Studentski
trg 16, 11001 Belgrade, Serbia.
2
University of Ljubljana, Biotechnical Faculty,
Department of Animal Science, Groblje 3, 1230 Domžale, Slovenia.
Authors’ contributions
SM performed the laboratory work and wrote the manuscript with
assistance from AR and PS. AR conducted the data analyses. VN organized
the logistic for the fieldwork, participated in the collection of data and
helped to draft the manuscript. PS coordinated and supervised the study. All
authors read and approved the final manuscript.
Competing interests
The authors declare that they have no competing interests.
Received: 12 July 2010 Accepted: 14 January 2011
Published: 14 January 2011
References
1. Northcote TG: Comparative biology and management of Arctic and
European grayling (Salmonidae, Thymallus). Rev Fish Biol Fish 1995,
5:141-194.
2. Banarescu P: Zoogeography of fresh waters. In Distribution and Dispersal of
Freshwater Animals in North America and Eurasia. Volume 2. Wiesbaden:
Aula-Verlag; 1992:520-1091.
3. Weiss S, Persat H, Eppe R, Schlötterer C, Uiblein F: Complex patterns of
colonization and refugia revealed for European grayling Thymallus
thymallus, based on complete sequencing of the mitochondrial DNA
control region. Mol Ecol 2002, 11:1393-1407.
4. Froufe E, Knizhin I, Weiss S: Phylogenetic analysis of the genus Thymallus
(grayling) based on mtDNA control region and ATPase 6 genes, with
inferences on control region constraints and broad-scale Eurasian
phylogeography. Mol Phylogenet Evol 2005, 34:106-117.
5. Koskinen MT, Ranta E, Piironen J, Veselov A, Titov S, Haugen TO, Nilsson J,
Carlstein M, Primmer CR: Genetic lineages and postglacial colonization of
grayling (Thymallus thymallus, Salmonidae) in Europe, as revealed by
mitochondrial DNA analyses. Mol Ecol 2000, 9:1609-1624.
6. Koskinen MT, Nilsson J, Veselov A, Potutkin AG, Ranta E, Primmer CR:
Microsatellite data resolve phylogeographic patterns in European
grayling, Thymallus thymallus, Salmonidae. Heredity 2002, 88:391-402.
7. Gum B, Gross R, Kühn R: Mitochondrial and nuclear DNA phylogeography
of European grayling (Thymallus thymallus): evidence for secondary
contact zones in central Europe. Mol Ecol 2005, 14:1707-1725.
8. Weiss S, Knizhin I, Kirilov A, Froufe E: Phenotypic and genetic
differentiation of two major phylogeographical lineages of arctic
grayling Thymallus arcticus in the Lena River, and surrounding Arctic
drainages. Biol J Linn Soc 2006, 88:511-525.
9. Sušnik S, Snoj A, Dovč P: Microsatellites in grayling (Thymallus thymallus):
comparison of two geographically remote populations from the
Danubian and Adriatic river basin in Slovenia. Mol Ecol 1999, 8:1756-1758.
10. Sušnik S, Snoj A, Dovč P: Evolutionary distinctness of grayling (Thymallus
thymallus) inhabiting the Adriatic river system, as based on mtDNA
variation. Biol J Linn Soc 2001, 74:375-385.
11. Sušnik
S, Berrebi P, Dovč P, Hansen MM, Snoj A: Genetic introgression
between wild and stocked salmonids and the prospects for using
molecular markers in population rehabilitation: the case of the Adriatic
grayling (Thymallus thymallus L. 1785). Heredity 2004, 93:273-282.
12. Gross R, Kühn R, Baars M, Schröder W, Stein H, Rottmann O: Genetic
differentiation of European grayling populations across the Main,
Danube and Elbe drainages in Bavaria. J Fish Biol 2001, 58:264-280.
13. Koskinen MT, Primmer CR: High throughput analysis of 17 microsatellite
loci grayling (Thymallus spp. Salmonidae). Cons Genet 2001, 2:173-177.
14. Koskinen MT, Knizhin I, Primmer CR, Schlötterer C, Weiss S: Mitochondrial
and nuclear DNA phylogeography of Thymallus spp. (grayling) provides
evidence of ice-age mediated environmental perturbations in the
world’s oldest body of freshwater, Lake Baikal. Mol Ecol 2002,
11:2599-2611.
15. Uiblein F, Jagsch A, Honsig-Erlenburg , Weiss S: Status, habitat use, and
vulnerability of the European grayling in Austrian waters. J Fish Biol 2001,
59(Suppl. A):223-247.
16. Gum B, Gross R, Rottmann O, Schröder W, Kühn R: Microsatellite variation
in Bavarian populations of European grayling (Thymallus thymallus):
Implications for conservation. Conserv Genet 2003, 4:659-672.
17. Gum B, Gross R, Kuehn R: Discriminating the impact of recent human
mediated stock transfer from historical gene flow on genetic structure of
Marić et al . Genetics Selection Evolution 2011, 43:2
/>Page 10 of 11
European grayling (Thymallus thymallus L.). J Fish Biol 2006, 69(Suppl. C):
115-135.
18. Meldgaard T, Nielsen EE, Loeschke V: Fragmentation by weirs in a riverine
system: A study of genetic variation in time and space among
populations of European grayling (Thymallus thymallus) in a Danish river
system. Conserv Genet 2003, 4:735-747.
19. Gum B, Gross R, Geist J: Conservation genetics and management
implications for European grayling, Thymallus thymallus: synthesis of
phylogeography and population genetics. Fisheries Manag Ecol 2009,
16:37-51.
20. Hewitt GM: Some genetic consequences of ice ages, and their role in
divergence and speciation. Biol J Linn Soc 1996, 58:274-276.
21. Hewitt GM: Post-glacial re-colonization of European biota. Biol J Linn Soc
1999, 68:87-112.
22. Conservation International. [ />23. Kryštufek B, Reed JM: Pattern and Process in Balkan Biodiversity - an
Overview. In Balkan Biodiversity, Pattern and Process in the European
Hotspot. Edited by: Griffiths HI, Kryštufek B, Reed JM. Dordrecht: Kluwer
Academic Publishers; 2004:203-217.
24. Swatdipong A, Primmer CR, Vasemägi A: Historical and recent genetic
bottlenecks in European grayling, Thymallus thymallus. Conserv Genet
2010, 11:279-292.
25. Persat H: Threatened populations and conservation of European
grayling, Thymallus thymallus (L., 1758). In Conservation of Endangered
Freshwater Fish in Europe. Edited by: Kirchhofer A, Hefti D. Basel: Birkhäuser
Verlag; 1996:233-247.
26. Baars M, Mathes E, Stein H, Steinhörster U: Die Äsche Hohenwarsleben: Die
Neue Brehm-Bücherei, Westarp Wissenschaften; 2001.
27. Gum B: Genetic characterisation of European grayling (Thymallus
thymallus) populations: implications for conservation and management.
PhD thesis Fakultät Wissenschaftszentrum, Weihenstephan für Ernährung;
2007.
28. Janković D: Sistematika i ekologija lipljena Jugoslavije Beograd: Biološki
Institut; 1960.
29. Duftner N, Koblmüller S, Weiss S, Medgyesy N, Sturmbauer C: The impact
of stocking on the genetic structure of European grayling (Thymallus
thymallus, Salmonidae) in two alpine rivers.
Hydrobiologia 2005,
542:121-129.
30. Giuffra E, Bernatchez L, Guyomard R: Mitochondrial CR and protein coding
genes sequence variation among phenotypic forms of brown trout
Salmo trutta from northern Italy. Mol Ecol 1994, 3:161-171.
31. Snoj A, Sušnik S, Pohar J, Dovč P: The first microsatellite marker
(BFRO004) for grayling, informative for its Adriatic population. Anim
Genet 1999, 30:74-75.
32. Sušnik S, Snoj A, Jesenšek D, Dovč P: Microsatellite DNA markers
(BFRO010 and BFRO011) for grayling. J Anim Sci 2000, 78:488-489.
33. Sušnik S, Snoj A, Dovč P: A new set of microsatellite markers for grayling:
BFRO014, BFRO015, BFRO016, BFRO017 and BFRO018. Anim Genet 1999,
30:478.
34. Thompson JD, Higgins DG, Gibson TJ: CLUSTAL W: improving the
sensitivity of progressive multiple sequence alignment through
sequence weighting, position-specific gap penalties and weight matrix
choice. Nucleic Acids Res 1994, 22:4637-4680.
35. Rozas J, Sánchez-Delbarrio JC, Messeguer X, Rozas R: DnaSP, DNA
polymorphism analyses by the coalescent and other methods.
Bioinformatics 2003, 19:2496-2497.
36. Kumar S, Tamura K, Jakobsen IB, Nei M: MEGA2: molecular evolutionary
genetics analysis software. Bioinformatics 2001, 17:1244-1245.
37. Swofford DL: PAUP*, b-VERSION 4.0. Sunderland MA: Sinauer; 2000.
38. Clement M, Posada D, Crandall K: TCS: A computer program to estimate
gene genealogies. Mol Ecol 2000, 9:1657-1660.
39. Belkhir K, Borsa P, Chikhi L, Raufaste N, Bonhomme F: GENETIX v. 4.04,
Logiciel sous WindowsTM pour la Génétique des Populations.
Montpellier : Université Montpellier 2, Laboratoire Génome et Population;
2003.
40. Goudet J: FSTAT, a program to estimate and test gene diversities and
fixation indices (version 2.9.3.2). [ />fstat.htm].
41. Bowcock AM, Ruiz-Linares A, Tomfohrde J, Minch E, Kidd JR, Cavalli-
Sforza LL: High resolution of human evolutionary trees with polymorphic
microsatellites. Nature 1994, 368:455-457.
42. Langella O: Populations 1.2.28. Logiciel de génétique des populations.
[ = 84].
43. Piry S, Luikart G, Cournet JM, BOTTLENECK:
A computer program for
detecting recent reductions in the effective population size using allele
frequency data. J Hered 1999, 90:502-503.
44. Beaumont MA: Detecting population expansion and decline using
microsatellites. Genetics 1999, 153:2013-2029.
45. Vähä JP, Erkinaro J, Niemela E, Primmer CR: Life-history and habitat
features influence the within-river genetic structure of Atlantic salmon.
Mol Ecol 2007, 16:2638-2654.
46. Pritchard JK, Stephens M, Donnelly P: Inference of population structure
using multilocus genotype data. Genetics 2000, 155:945-959.
47. Evanno G, Regnaut S, Goudet J: Detecting the number of clusters of
individuals using the software STRUCTURE: a simulation study. Mol Ecol
2005, 14:2611-2620.
48. Uiblein F, Jagsch A, Kössner G, Weiss S, Gollmann P, Kainz E:
Untersuchungen zu lokaler Anpassung, Gefährdung und Schutz der
Äsche (Thymallus thymallus) in drei Gewässern in Oberösterreich.
Österreichs Fischerei 2000, 4:88-165.
49. Froufe E, Knizhin I, Koskinen MT, Primmer CR, Weiss S: Identification of
reproductively isolated lineages of Amur grayling (Thymallus grubii
Dybowski 1869): concordance between phenotypic and genetic
variation. Mol Ecol 2003, 12:2345-2355.
50. Weiss S, Marić S, Snoj A: Regional structure despite limited mtDNA
sequence diversity found in the endangered Huchen, Hucho hucho
(Linnaeus, 1758). Hydrobiologia 2011, 658:103-110.
51. Swatdipong A, Vasemägi A, Koskinen MT, Piironen P, Primmer CR:
Unanticipated population structure of European grayling in its northern
distribution: implications for conservation prioritization. Front Zool 2009,
6:6.
52. Sušnik S: Chromosomal and mtDNA polymorphism in grayling (Thymallus
thymallus) and phylogeographic relationship among its geographically
separated populations. PhD thesis University of Ljubljana, Medical Faculty;
2000.
53. Koskinen MT, Piironen J, Primmer CR: Genetic assessment of
spatiotemporal evolutionary relationships and stocking effects in
grayling (Thymallus thymallus, Salmonidae). Ecol Lett 2002, 5:193-205.
doi:10.1186/1297-9686-43-2
Cite this article as: Marić et al.: Genetic differentiation of European
grayling (Thymallus thymallus) populations in Serbia, based on
mitochondrial and nuclear DNA analyses. Genetics Selection Evolution
2011 43:2.
Submit your next manuscript to BioMed Central
and take full advantage of:
• Convenient online submission
• Thorough peer review
• No space constraints or color figure charges
• Immediate publication on acceptance
• Inclusion in PubMed, CAS, Scopus and Google Scholar
• Research which is freely available for redistribution
Submit your manuscript at
www.biomedcentral.com/submit
Marić et al . Genetics Selection Evolution 2011, 43:2
/>Page 11 of 11