Báo cáo sinh học: "Association between plasma metabolites and gene expression profiles in five porcine endocrine tissues" docx
Bạn đang xem bản rút gọn của tài liệu. Xem và tải ngay bản đầy đủ của tài liệu tại đây (1.43 MB, 12 trang )
RESEARC H Open Access
Association between plasma metabolites and
gene expression profiles in five porcine
endocrine tissues
Bin Yang
1,2,3*
, Anna Bassols
4
, Yolanda Saco
4
and Miguel Pérez-Enciso
1,2,5
Abstract
Background: Endocrine tissues play a fundamental role in maintaining homeostasis of plasma metabolites such as
non-esterified fatty acids and glucose, the levels of which reflect the energy balance or the health status of
animals. However, the relationship between the transcriptome of endocrine tissues and plasma metabolites has
been poorly studied.
Methods: We determined the blood levels of 12 plasma metabolites in 27 pigs belonging to five breeds, each
breed consisting of both females and males. The transcriptome of five endocrine tissues i.e. hypothalamus,
adenohypophysis, thyroid gland, gonads and backfat tissues from 16 out of the 27 pigs was also determined. Sex
and breed effects on the 12 plasma metabolites were investigated and associations between genes expressed in
the five endocrine tissues and the 12 plasma metabolites measured were analyzed. A probeset was defined as a
quantitative trait transcript (QTT) when its association with a particular metabolic trait achieved a nominal P value
< 0.01.
Results: A larger than expected number of QTT was found for non-esterified fatty acids and alanine
aminotransferase in at least two tissues. The associations were highly tissue-specific. The QTT within the tissues
were divided into co-expression network modules enriched for genes in Kyoto Encyclopedia of Gen es and
Genomes or gene ontology categories that are related to the physiological functions of the corresponding tissues.
We also explored a multi-tissue co-expression network using QTT for non-esterified fatty acids from the five tissues
and found that a module, enriched in hypothalamus QTT, was positioned at the centre of the entire multi-tissue
network.
Conclusions: These results emphasize the relationships between endocrine tissues and plasma metabolites in
terms of gene expression. Highly tissue-specific association patterns suggest that candidate genes or gene
pathways should be investigated in the context of specific tiss ues.
Background
In recent years, high-throughput genomic technologies
have accelerated the discovery of new causal mutations
and made the st udy of biological s ystems more accessi-
ble than ever. This is true not only in humans and
model organisms but also in agriculturally i mportant
species like the pig. One major interest in the study of
livestock species is that the strong selection pressure
applied in breeding programs h as resulted in breeds
that are phenotypically extreme for many traits. In addi-
tion, such selection has indirectly acted on the tran-
scriptome and the metabolome, but the resulting effects
are much less studied, not to say understood, than
those on external phenotypes like growth or fat
deposition.
In humans an d other animal species, the blood levels
of molecules related to lipid, glucose and protein meta-
bolism, such as non-esterified fatty acids, triglyceride,
glucose and alanine aminotransferase (ALT), reflect
nutritional and disease status. In livestock species, the
abundance of plasma metabolites can be associated with
agriculturally important traits like growth and fatness
* Correspondence:
1
Department of Food and Animal Science, Veterinary School, Universitat
Autònoma de Barcelona, Bellaterra, 08193 Spain
Full list of author information is available at the end of the article
Yang et al. Genetics Selection Evolution 2011, 43:28
/>Genetics
Selection
Evolution
© 2011 Yang et al; licensee BioMed Central Ltd. This is an Open Access article distributed under the terms of the Creative Commons
Attribution License (http://creativecomm ons.org/licenses/by/2.0), which permits unrestricted use, distribution, and reproduction in
any medium, provided the original work is properly cited.
[1]. Among the major l ivestock species, pig is a good
model for human diseases such as atherosclerosis [2].
Genetic mapping studies have identified several genetic
loci affecting blood metabolites in both human and pig
populations [3,4]. Ideally, the functions of genes need to
be defined in the context of relevant tissues and gene
expression networks. M ost of the studies that combine
gene expression network and data on plasma metabo-
lites have been primarily carried out on liver and adi-
pose tissues [5,6]. However, endocrine glands, by
secreting hormones, also play a pivotal role in maintain-
ing the homeostasis of plasma metabolites, either
directly or indirectly. Despite the importance of these
tissues, the relationship between endocrine transcrip-
tome and plasma metabolites is not well known. In
addition, most existing analyses have considered tissues
separately although complex traits like obesity or meta-
bolite blood levels involve mo lecular networks both
within and between multiple tissues.
In the work reported here, we have analyzed the asso-
ciation between the transcriptome of five endocrine tis-
sues (hypothalamus, adenohypophysis, thyroid gland,
gonad and fat tissue) and 12 plasma metabolites in pig.
Since the study was carried out on pigs belonging to dif-
ferent breeds but managed and sacrificed simulta-
neously, we could also investigate the existence of any
genetic (breed) effect on the metabolites analyzed. The
plasma metabolites studied here play a fundamental role
in the basal metabolism (glucose, cholesterol, triglycer-
ide and non-esterified fatty acids, alanine aminotransfer-
ase), or the inflammatory response (haptoglobin, pig
major acute phase protein). The term “quantitative trait
transcript” or QTT refers to a probeset, the expression
of which is significantly associated (P < 0.01) with a par-
ticular metabolic trait. Gene co-expression networks,
were inferred both for each tissue separately and for all
tissues together. We conclude that using a multi-tissue
network provi des key relevant information to under-
stand the underlying regulation of the metabolites
studied.
Methods
Animals and sample collection
Animal management and tissue collection procedures
have been detailed elsewhere[7].Briefly,27pigsfrom
five breeds, Large White (N = 6), Landrace (N = 5),
Duroc (N = 5), a Sino-European hybrid line (N = 5) and
Iberian (N = 6), were bought from three breeding com-
panies after weaning. All pigs were housed together in
the university experimental farms and fed the same diet
fortwomonths.At80to89daysofageandafter24
hours fasting, pigs were euthanized and sacrificed for
blood and tissue sampling. All procedures were
appr oved by the Ethical and Animal Welfare committee
of the Universitat Autònoma de Barcelona (Spain).
Phenotype measurements
Twelve plasma metabolites were measured in the 27
pigs. Briefly, after collecting and coagulating blood
samples at room temperature, serum was separated
from clots by centrifugation at 3000 rpm at 4°C for 20
min and stored at -80°C until use. Plasma metabolite
concentrations were measured with the following
methods: hexokinase assay for glucose, Ranbut assay
(Randox Laboratories Ltd., UK) for 3-hydroxybutyrate,
NEFA-C reagent (Wako Chemicals GmbH, Germany)
for no n-esterified f atty acids (NEFA), CHOD-PAP-
method for cholesterol, immuno-inhibition method for
high density lipoprotein cholesterol (HDL-C), selective
protection method for low density lipoprotein choles-
terol (LDL-C), GPO-PAP method for triglyceride,
Biuret method for total protein and, methods recom-
mended by IFCC (International Federation of Clinical
Chemistry) for alanine aminotransferase (ALT) and
alkaline phosphatase (ALP). Haptoglobin was assayed
with the Phase Haptoglobin kit (colorimetric assay
based on binding of haptoglobin to hemoglobin,
Tridelta Ltd, Ireland) and pig major acute phase pro-
tein (PigMAP) levels with an ELISA kit ( PigCHAMP
ProEuropa, Segovia, Spain). All the assays were per-
formed with an Olympus AU400 analyzer according to
the manufacturer’s recommendations.
Microarray data
We used the GeneChip
®
Porcine Genome Array from
Affymetrix (Santa Clara CA) to profile the transcriptome
of five endocrine tissues: hypothalamus (HYPO), adeno-
hypophysis (AHYP), thyroid gland (THYG), gonads
(GONA) from both male and female pigs, and backfat
tissue (FATB) in 16 (four Large White, four Duroc, four
Iberian and four from the Sino-European hybrid line) of
the 27 pigs. Each breed consisted of two males and two
fema les, except for the hybrid line with three males and
one female [7]. Total RNA was extracted from 100 mg
of tissue and RNA samples were cleaned, quantified,
andadjustedto500-1000ng/μ l. Five μgoftotalRNA
were used to synthesize cDNA. Then, the 80 microar-
rays corresponding to 16 animals × five tissues were
hybridized and scanned to generate signal intensities
which were converted to CEL files by the GeneChip
Operating Software (GCOS). All CEL files were adjusted
for background noise and normalized using the
GCRMA procedure [8] and the data was then used for
subsequent analysis. The transcriptome data are depos-
ited in the Gene Expression Omnibus (GEO) database
under accession number [GEO:GSE14739].
Yang et al. Genetics Selection Evolution 2011, 43:28
/>Page 2 of 12
Data processing and analysis
We used a general linear regression model to investigate
the effect of sex and breed on the biochemical traits:
y
= sex + breed + e,
where y is a vector of the studied metabolite
measures.
The model applied to assess the strength of the asso-
ciation between metabolic traits and probesets was:
y
= sex + breed + probeset
i
+ e
,
where probeset i is defined as a quantitative trait tran-
script (QTT) if its association with a particular bio-
chemical trait achieves a nominal P value < 0.01. Since
both breed and sex were adjusted in the regression ana-
lysis, the detected QTT for a particular metabolite
represent general transcriptional effects in both breed
and sex. The analysis were implemented using the GLM
function in R [9]. The False Discovery Rates (FDR) of
the associations were determined by pe rmuting the
labels of the phenotypes for 20 iterations, while preser-
ving the correlation structure of the transcriptome.
Gene set enrichment analysis
A gene set enrichment analysis (GSEA) was implemen-
ted using R scripts downloaded from ad-
institute.org/gsea/ with a few modifications. In this
analysis, the average value across probesets was used as
the expression value of that gene in each individual
when a gene was represented by more than one probe-
set. This reduced the 24,123 probesets to 18 ,017 unique
genes. For each metabolic trait, we ranked the 18,017
genes according to their partial correlations with the
metabolic trait under study (conditional on sex and
breed). Then, an enrichment score measuring the extent
to which a predefined set of genes (e.g., genes in a speci-
fic KEGG for Kyoto Encyclopedia of Genes and Gen-
omes category) clustered at the top or the bottom of the
ranks is calculated for each gene set. The normalized
enrichment scores were used to measure the strength of
the association between gene sets and the metabolic
trait. The significance and FDR of the associations were
determined by 1000 permutations [10].
Weighted gene co-expression network analysis
The gene expression data were corrected for sex and
breed effects, and corresponding residuals were used to
bui ld up a weighted ge ne co-expression network using R
package weighted gene co-expression network analysis
(WGCNA)[11,12].Briefly,aPearson correlation matrix
was first obtained and t hen transformed into an adja-
cency matrix A using a power function a
ij
=|r
ij
|
b
,where
|r
ij
| is the absolute value of Pearson correlation coeffi-
cients between probeset i and probeset j, a
ij
is the ele-
ment in A. The network connectivity (K) of probeset i is
defined as
k
i
=
N
−1
j
=1
a
i
j
where index j corresponds to all
probesets other than probeset i in the network, N is the
overall number of transcripts studied [12]. The parameter
b is chosen so that th e connectivity distribution approxi-
mates a scale-fre e criterion, P(K)=K
-r
. The adjac ency
matrix was fur ther transformed i nto a distance matrix
through topological overlap-based dissimilarity measures;
finally a dynamic clustering procedure was applied on the
distance matrix to divide the entire co-expression net-
work into multiple modules [12]. Similarly, the intramod-
ular connectivity probeset i was defined as
N
m
−1
j
=1
a
i
j
,
where index j indicates all probesets other than probeset
i in a specific module of size N
m
.
We also introduced a standardized inter-tissue con-
nectivity of probeset i:
k
int
t
=
N
ot
l=1
a
il
N
ot
, which measures
the connection strength for a probeset i to probesets in
external tissues, here index l indicates all the N
ot
probe-
sets in tissues other than the tissue to which probeset i
corresponds. The strength of connection between a pair
of tissues with regard to gene expression is defined as
N
1
i=1
N
2
j=1
a
ij
N
1
N
2
,wherei and j correspond to probesets in
tissue 1 and tissue 2, and N
1
and N
2
are the number of
probesets in tissue 1 and tissue 2, respectively.
Gene ontology (GO) and KEGG pathway enrichment
analysis
The porcine Affymetrix probeset identifiers were con-
verted into their human orthologs using the latest anno-
tation file version (2010) from [13]. The gene category
enrichment analyses were conducted using the Database
for Annotation, Visualization and Integrated Discovery
(DAVID) web-accessible program [14].
Results
Breed and sex differences for metabolite traits
The physiological re levance and main statistics of the 12
metabolites considered in this study are summarized in
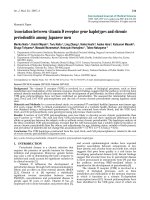
Table 1. Overall, sex had little influence. Given a p-
value threshold of 0.05, only the NEFA levels differed
between sexes, with male pigs having higher NEFA
levels than female pigs (1.22 ± 0.46 mmol/L vs. 0.96 ±
0.33 mmol/L) (Figure 1). In comparison, breed was a
greater source of variability. Breed effects were signifi-
cant for six traits (P < 0.05). The most breed-biased
trait was total protein content, followed by NEFA, ALP,
LDL-C, haptoglobin and PigMAP. Sino-European hybrid
pigs had the highest NEFA and ALP levels, but the low-
est PigMAP and LDL-C levels, Iberian pigs had the
highest total protein and PigMAP levels, but the lowest
ALP level and a relatively low NEFA content and the
Duroc and Large White pigs had the highest LDL-C
Yang et al. Genetics Selection Evolution 2011, 43:28
/>Page 3 of 12
levels (Figure 1). The correlation coefficients among the
levels of the 12 metabolites are summarized in Addi-
tional file 1: Table S1. The strongest correlation was
observed between LDL-C and cholesterol (r = 0.84),
which is not unexpected since cholesterol is defined as
the sum of LDL-C, HDL-C and other forms of lipopro-
tein associated cholesterol.
Differences in metabolite levels among breeds were
also visualized with a dendrogram, these differences
being defined as 1 - r, where r is the correlation coeffi-
cient between standardized average values of 12 metabo-
lites in any two breeds. Note that a perfect positive
correlation corresponds to 0, no correlation to 1 and a
perfect negative correlation to 2 on the y axis (Figure
1b). To facilitate the comparison with the dendrograms
built with gene expression data, only the 16 animals
with transcriptome data were used. As shown in Figure
1b, the Iberian and Large White breeds were within the
same clade, whereas the Duroc breed and the Sino-Eur-
opean hybrids clustered together in a distinct clade. The
height of these two clades was approximately equal to 1,
meaning that the metabolite levels between Iberian and
Large White pigs, and between Duroc and Sino-Eur-
opean pigs were uncorrelated, whereas the total height
of the tree was ~ 1.6, suggesting a negative correlation
between clades. Notably, we observed similar patterns in
dendrograms constructed using a Bayesian standardized
measure of the breed’s gene expression levels [ 7] in ade-
nohypophysis, thyroid gland, backfat tissue, hypothala-
mus, and female gonad (Figure 1c-e).
Association between transcriptome and plasma
metabolites
Next, we investigated the association between metabo-
lites and transcripts in each tissue separately across the
16 pigs (see methods above). A probeset was defined as
a quantitative trait transcript (QTT) if its association
with a particular metabolic trait achieved a nominal P
value < 0.01. The number of QTT for the 12 metabo-
lites in each tissue is shown in Table 2. For most of the
metabolic traits, the number of QTT in the five tissues
did not exceed the number expected by chance. Only
three traits, ALT, HDL-C and NEFA measures had
more than 500 QTT (FDR ~ 50%) detected in at least
one tissue. For ALT, 3,322 QTT (FDR ~ 6%) were
detected in the thyroid, which is much higher than the
number of QTT associated with ALT in other tissues.
For NEFA, we observed more than 500 QTT in four tis-
sues: adenohypophysis, gonad, hypothalamus and thyr-
oid. Note that fewer QTT were found in backfat tissue
than in other tissues, although NEFA is mainly secr eted
by adipose tissue.
To assess the tissue specificity of associations between
transcripts and metabolites and to which extent QTT
and functional gene sets associat ed with a particular
metaboliteweresharedacrosstissues,weusedtwo
approac hes: QTT overlap analysis and GSEA. To evalu-
ate the overlap of QTT, we examined whether the num-
ber of QTT shared by any two tissues was significantly
larger than random expectations using Fisher’s exact
test. Generally, a very limited overlap of QTT across tis-
sues was observed for most of the traits . Excessive QTT
overlaps between tissues (P value < 10
-4
) were observed
only for HDL-C and NEFA levels (Table 3). The QTT
enriched for genes involved in a biological process i.e.
RNA processing (Table 3) were those shared by
hypothalamus and thyroid and associated with HDL-C.
GSEA associates gene sets, rather individual genes, to a
given trait, and has been shown to have greater power
in finding similarities between two independent studies
than in a single-gene analysis [10]. Figure 2 shows the
top 10 KEGG pathways with the most significant
Table 1 Characteristics and statistics of the 12 plasma metabolites analyzed in this study
Metabolite Physiological indications Mean (SD) P
sex
P
breed
Glucose (mmol/L) diabetes, stress 4.05 (1.15) 0.50 0.09
3-hydroxybutyrate (mmol/L) energy source of brain, rise when blood glucose is low 0.04 (0.02) 0.61 0.10
NEFA (mmol/L) starvation, insulin resistance and blood pressure 1.08 (0.41) 0.025 0.0005
Cholesterol (mmol/L) progression of atherosclerosis, diet 2.93 (0.37) 0.73 0.15
HDL-C (mmol/L) inverse predictor of cardiovascular disease 1.07 (0.15) 0.08 0.16
LDL-C (mmol/L) high level Associated with cardiovascular disease 1.57 (0.27) 0.67 0.002
Triglyceride (mmol/L) atherosclerosis, heart disease and stroke, diet 0.77 (0.43) 0.83 0.43
Total protein (g/L) reflects albumin concentration, infection, inflammation. 61.66 (4.88) 0.59 0.0003
ALT (U/L) rises dramatically in acute liver damage 51.33 (7.75) 0.83 0.30
ALP (U/L) rises with large bile duct obstruction, liver disease 219.0 (61.0) 0.98 0.0011
Haptoglobin (g/L) infection, inflammatory and pathological lesion, stress 0.72 (0.48) 0.46 0.047
PigMAP(g/L) infection, inflammatory and pathological lesion, stress 0.44 (0.17) 0.24 0.048
P
sex
and P
breed
: P value corresponding to significance of sex and breed effect by F test, respectively; non-esterified fatty acids (NEFA); alanine aminotransferase
(ALT); alkaline phosphatase (ALP); pig major acute phase protein (PigMAP)
Yang et al. Genetics Selection Evolution 2011, 43:28
/>Page 4 of 12
normalized enrichment scores, five positive (red) and
five negative (blue) for NEFA in the five tissues. Similar
to the QTT overlaps, a limited number of pathways
were preserved across tissues. A similar situation was
observed for other metabolic traits. Overall, these obser-
vations suggest that the associations between transcrip-
tome and metabolites are highly tissue-specific. This is
also in agreement with our previous analyses [7,15], that
highlighted that the factor with the largest effect on
transcriptome was tissue.
Gene co-expression networks
A gene co-expression network is a representation of
how transcripts are correlated. Genes wit hin the same
biological pathway can be highly correlated and there-
fore grouped into the same module. Using weighted
gene co-expression network analysis, the QTT for each
of the 12 metabolic traits in each of the five tissues were
clustered into one to four modules. Because the net-
works were constructed using probesets separately for
each tissue, we refer to these networks as single-tissue
(
a
)
(b) (c)
(d) (e)
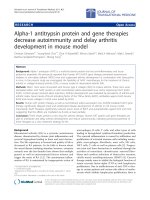
Figure 1 Comparing the metabolic traits between breeds. a) Bar plots of metabolic traits that significantly differed across sexes and breeds i.
e. Duroc (DU), Iberian (IB), Landrace (LR), Large White (LW) and a Sino-European hybrid line (YL). b) Dendrogram of the four pig breeds (DU, IB,
LR, LW) in terms of average standardized values for the 12 plasma metabolites. c-e) Dendrograms between breed z-scores for a subset of tissues
i.e. thyroid (THYG), adenohypophysis (AHYP) and backfat (FATB).
Yang et al. Genetics Selection Evolution 2011, 43:28
/>Page 5 of 12
networks. Furthermore, we examined the biological sig-
nificance of t hese modules by gene ontology (GO) cate-
gories (including biological processes, molecular
function and cellular component) and KEGG pathways
enrichment analysis. The enrichment of these gene cate-
gories was assessed by p values corrected by the Benja-
mini and Hochberg approach [16].
Five of the 12 traits, i.e. NEFA, ALT, HDL-C, glucose
and triglyceride levels were found to have a least one
module enriched for genes in certain KEGG or GO
categories (P
Benjamini
< 0.05, Table 4 and Additional file
2: Table S2). The most striking result was fo und for
NEFA, for which enrichment of functional categories
was observed in four tissues. The backfat module was
enriched in oxidation reduction and biosynthesis of
unsaturated fatty acids. The gonad module was enriched
in genes participating in the regulation of protein and
nucleotide metabolisms, in cell-cell signaling and T cell
proliferation. We observed that both adenohypophysis
(30 genes) and hypothalamus (44 genes) modules were
enriched for genes involved in protein transport, how-
ever, only t hree genes (IPO9, PACS1 and PSEN1)were
shared between tissues. This is consistent with the
highly tissue-specific pattern of associations mentioned
above. For ALT, the most remarkable tissue is thyroid,
for which the 3322 QTT were grouped into a single
module, 96% of the QTT being positively associated
with ALT. Thi s module is enriched in genes related to a
large variety of functional categories (Table 4 ). The
gonad module was enriched for genes involved in cell
adhe sion, leukocyte trans-endothelial migration, nucleo-
side triphosphate metabolism and blood vessel
development.
The previous results were obtained from analyses on
separate tissues. Because endocrine tissues regulate the
homeostasis of plasma metabolites through the secretion
of hormones collaboratively rather than independently, a
deeper understanding of the biology should be gained
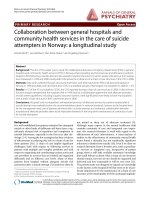
by considering several tissues simultaneously. We
assumed that inter-tissue communications would be
reflected in the inter-tissue gene correlations. To investi-
gate the inter-tissue connections at the gene expression
level, we constructed a multiple-tissue gene co-expres-
sion network that contained 5148 nodes (QTT) asso-
ciated with NEFA from the five tissues. We focused on
NEFA because it was the metabolite for which the lar-
gest number of QTT and biologically meaningful mod-
ules across the five tissues was found (Tables 2 and 4).
In this multiple-tissue network, a large proportion of
the nodes were loosely connected, whereas a small pro-
portion of nodes were high ly connected (Figure 3a). The
hypothalamus genes had the highest average inter-tissue
connectivity, while the gonad genes had the lowest
(Figure 3b). We also assessed the connection strength
between tissues. Interestingly, the strongest connection
was observed between hypothalamus and adenohypo-
physis (Additional file 3: Table S3), two tissues that are
closely related. The entire network was divided into five
modules (Figure 3c). Module 1 was enriched for
Table 2 Number of QTT for each plasma metabolite measured in five tissues
Metabolite FATB GONA AHYP THYG HYPO
Glucose 108 (409)
1
191 (234) 123 (215) 191 (185) 115 (180)
3-hydroxybutyrate 103 (159) 344 (259) 113 (258) 279 (148) 209 (290)
Non-esterified fatty acids 458 (201) 1113 (215) 1919 (209) 655 (214) 1003 (358)
Cholesterol 56 (197) 51 (201) 83 (259) 93 (338) 72 (365)
HDL-C 291 (157) 100 (173) 460 (205) 373 (191) 547 (541)
LDL-C 84 (262) 62 (323) 82 (374) 62 (283) 45 (656)
Triglyceride 185 (292) 117 (213) 273 (175) 304 (143) 318 (177)
Total protein 207 (311) 63 (192) 89 (146) 80 (162) 95 (176)
Alanine aminotransferase 166 (218) 613 (368) 112 (305) 3322 (193) 441 (232)
Alkaline phosphatase 138 (304) 175 (323) 202 (301) 96 (179) 57 (240)
Haptoglobin 84 (327) 45 (251) 70 (263) 118 (181) 72 (235)
PigMAP 51 (287) 254 (253) 100 (172) 99 (161) 58 (161)
1
In brackets, number of QTT expected by random chance; backfat (FATB); gonad (GONA); adenohypophysis (AHYP); thyroid (THYG); hypothalamus (HYPO)
Table 3 Tissue pairs with a significant number of
overlapping QTT
Metabolite Tissue
pairs
Count
(fold)
Bonferroni P
value
GO terms
HDL-C FATB-
THYG
17 (3.8) 0.000396 -
HDL-C AHYP-
THYG
25 (3.5) 7.92E-06 -
HDL-C AHYP-
HYPO
40 (3.8) 5.18E-11 -
HDL-C THYG-
HYPO
50 (5.9) 3.99E-22 RNA
processing
NEFA GONA-
AHYP
211 (2.4) 1.22E-31 -
Non-esterified fatty acids (NEFA); backfat (FATB); gonad (GONA);
adenohypophysis (AHYP); thyroid (THYG); hypothalamus (HYPO)
Yang et al. Genetics Selection Evolution 2011, 43:28
/>Page 6 of 12
adenohypophysis probesets, modules 2 and 4 were
enriched for gonad probesets, whereas module 3 was
overrepresented with hypothalamus and thyroid probe-
sets. Module 5 was not enriched for any tissue (Addi-
tional file 4: Table S4).
Highly connected (hub) nodes constitute the back-
bones of a network structure. In Figure 3d, we show a
subset of the entire network using the top 10% probe-
sets with the highest intra-modular connectivity (hub
nodes). Several interesting observations can be made.
All hub nodes in module 1 corresponded to adenohypo-
physis, while all hub nodes in modules 2 and 4
corresponded to gonad, these modules possibly reflect-
ing biological processes that operate within tissues . In
contrast, hub nodes in module 3 corresponded to four
tissues including hypothalamus, thyroid, adenohypo phy-
sis and backfat, suggesting that the genes in this module
could be part of gene regulation pathways that are
involved in communications between tissues. Notice
that 64% (73/114) of the hub genes in module 3 corre-
sponded to hypothalamus, which is regarded as an
organ integrating information from the body’ snutri-
tional and hormonal signals. Both positive and negative
correlations among hub nodes were present in module
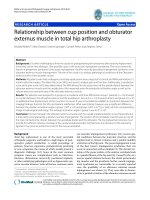
Figure 2 Heat map of KEGG pathways enrichment scores for non-esterified fatty acids in five tissues. Red (blue) denotes top five
pathways with positive (negative) normalized enrichment scores in gene set enrichment analysis (GSEA) for backfat (FATB), gonad (GONA),
adenohypophysis (AHYP), thyroid (THYG), hypothalamus (HYPO).
Yang et al. Genetics Selection Evolution 2011, 43:28
/>Page 7 of 12
3, indicating the existence of feedback signaling. In com-
parison, only positive correlations among probesets
within the three other modules were observed. There
are many more links between module 1 and module 3
than between any other pair of modules. Many of these
are links between hypothalamus and adenohypophysis
genes. Interestingly, hormone secretion in the adenohy-
pophysis is directly regulated by neurons in the
hypothalamus. Thus, these observations emphasize the
central role of the hypothalamus with regard to gene
regulation networks.
Discussion
Plasma metabolite levels are main indicators of endo-
crine status, including health status, and are potential
predictors of perf ormance. In this study, a survey of 12
plasma metabolites showed that six metabolites, includ-
ing total protein, NEFA, ALP, LDL-C, haptoglobin and
PigMAP are affected by breed (P < 0.05) and therefore
have a partial genetic cause. The Iberian pig, which is
fatter and grows more slowly than commercial pig
breeds, has the highest average levels of total protein
and PigMAP, but the lowest level of ALP. Interestingly,
ALP is reported to be associated with body weight in
pigs [1]. The Sino-European hybrid pigs have lower hap-
toglobin and PigMAP average levels which are positively
associated with inflammatory processes. This suggests
that the Sino-European hybrid pigs could have a weaker
inflammatory response as compared to e.g., Dur oc and
Landrace breeds (Figure 1a). Notably, we observed a
similar pattern of correlation among breeds in terms of
both the levels of the 12 metabolites and the transcrip-
tome in multiple tissues (Figure 1b-e).
The endocrine glands play important roles in main-
taining homeostasis of metabolites in blood. Here, we
report an association analysis between gene expression
profiles in five end ocrine tissues and plasma metabolites
in pigs. The associations were found to be highly tissue-
specific, as suggested by the limited overlap of QTT and
biological pathways in the five tissues for all the metabo-
lites. The QTT for NEFA, ALT, HDL-C, triglyceride and
glucose within each tissue were grouped into biologically
meaningful sub-networks. Furthermore, we constructed
a multiple-tissue network using QTT from the five tis-
sues for NEFA.
Overall, the FDR of the associations between probesets
and metabolites was high at the current significance
threshold (P < 0.01) and a similar high FDR was also
observed at a stricter threshold (P < 0.001). This is likely
due to the limited size of the sample (N = 16). Yet, we
did find a significant increase in the number of QTT for
NEFA and ALT, and the QTT within tissues were
grouped into biologically meaningful modules (detailed
below).
Table 4 Enrichment of gene categories in different tissue modules for NEFA, HDL-C, triglyceride, glucose and ALT
levels
Metabolite FATB GONA AHYP THYG HYPO
Glucose RNA binding and splicing
NEFA oxidation reduction
biosynthesis of
unsaturated fatty acid
coenzyme binding
mitochondrion
regulations of protein,
nucleotide metabolism
cell-cell signaling
T cell proliferation
synaptic transmission
muscle and skeletal
development
behavior
protein transport and
localization
calcium ion binding
neuron projection
presynaptic
membrane
contractile fiber
dendritic shaft
protein
transport
learning and
memory
proton
transporting
ATPase
complex
synapse;
dendritic shaft
cell junction
HDL-C lipoprotein particle RNA processing; ribosome RNA splicing
Triglyceride Alzheimer’s disease
monosaccharide catabolic process
ALT tight junction
cell adhesion
leukocyte transendothelial
migration
nucleoside triphosphate
metabolic process
blood vessel development
regulation of cell motion
polysaccharide and heparin
binding
ECM receptor interaction
focal adhesion
cell motion
neuron differentiation
cell-cell signaling
muscle, heart and bone
development
regulation of transcription and
metabolic processes
response to wounding
learning and memory
Non-esterified fatty acids (NEFA); alanine a minotransferase (ALT); backfat (FATB);, gonad (GONA ); adenohypophysis (AHYP); thyroid (THYG); hypothalamus (HYPO)
Yang et al. Genetics Selection Evolution 2011, 43:28
/>Page 8 of 12
The limited overlap between QTT and gene pathways
across tissues suggests that the associations between
endocrine transcriptome and biochemical traits were
highly tissue-specific. This is in agreement with our pre-
vious analyses of the data as well [15] and with the lit-
erature in general. For instance, Yang et al. [17] have
reported a minimal overlap and very different functional
categories of sexually dimorphic genes in brain, liver,
adipose and muscle of mice. Therefore, candidate genes
or gene pathways e.g., obtained from genome-wide asso-
ciation studies should be investigated in the context of
specific tissues.
Single tissue network
The most significant observations regarding QTT num-
ber concerned NEFA. NEFA derive from the hydrolysis
of triglycerides in adipose tissue or lipoproteins, circu-
late in the blood and serve as source of energy (espe-
cially for heart and muscle) and cellular signaling
messengers. In the backfat module, we found that genes
involved in the biosynthesis of unsaturated fatty acids
(such as ELOVL6,ACOT4,ACOT7, HSD1 7B12, PECR
and SCD) were negatively correlated with NEFA, sug-
gesting that the synthesis of unsaturated fatty acids was
repressed in animals with higher plasma NEFA levels.
(a) (b)
(c) (d)
Module 1
Module 2
Module 3
Module 4
Module 5
1
2
3
4
4
4
5
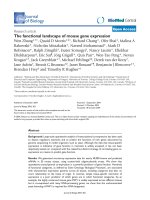
Figure 3 Analys is of multiple tissue network for non-esterified fatty acid s. a) Distribution of probeset connectivity in the multiple-tissue
network. b) Box plot of standardized inter-tissue connectivity of genes in the five tissues i.e. backfat (FATB), gonad (GONA), adenohypophysis
(AHYP), thyroid (THYG) and hypothalamus (HYPO). c) Heat map for the multiple-tissue network, color shades i.e., from white to red represent the
correlation strength between a pair of probesets; different modules are indicated by different colors in the row and column box, and ordered by
size (the module labels are shown on top of the graph); the genes within modules in the rows and columns are sorted according to their
intramodular connectivity. d) A subset of the multiple-tissue network containing nodes that are QTT for NEFA in the five tissues; here, the nodes
represent the top 10% probesets with the highest intramodular connectivity in each of the four modules; node colors denote the tissues: red
(hypothalamus), blue (adenohypophysis), yellow (gonad), cyan (thyroid) and green (backfat); two nodes were connected with an edge if their
correlation was significant (nominal P < 10
-4
, FDR < 0.05), the pink (blue) edge indicates a positive (negative) correlation.
Yang et al. Genetics Selection Evolution 2011, 43:28
/>Page 9 of 12
Moreover, other genes involved in fatty acid and lipid
metabolisms (such as DECR1, ACADL, ACOX2, DCI,
ECHDC2, FABP3, FASN, LIPA, PRDX6, ENPP2,
DDHD1, DGAT2 and SCP2) were also found negatively
correlated with NEFA in this module. The hypothala-
mus module for NEFA was enriched for genes related to
synapses, learning and memory. Many genes participat-
ing in protein transport and localization processes like
SENP1, CDK5, SYNGR1, SNAP23, RIMS1 and YWHAZ
are also active at synapses. Synaptic plasticity in the
hypothalamus is known to be associated with nutritional
state [18]. In the adenohypophysis module, genes
involved in calcium ion binding, protein transport and
localization, neuron projection and in the presynaptic
membrane were overrepresented. The importance of
calcium-dependent electrical activity in adenohypophysis
cells has been reviewed, e.g., by [19]. Both in vitro [20]
and in vivo [21] experiments have shown that changing
NEFA concentrations can alter pituitary hormone secre-
tion in pigs. Both in humans and dog, it was shown that
the plasma NEFA level increases after administration of
growthhormone[22],NEFAinturncanblockgrowth
hormone secretion [23]. Thus, in general, we observe
that enriched functional categories often have a physio-
logical interpretation.
For ALT, the most relevant tissues in this analysis are
the thyroid and gonad (Tables 2 and 4). The observed
large number (3322) of QTT and wide range of func-
tional categories in thyroid suggest a close relationship
between thyroid function and plasma ALT levels. It is
well known t hat ALT blood levels reflect the liver con-
dition since clinical links between the thyroid and liver
are well documented. Liver metabolizes the th yroid hor-
mone, which in turn influences the liver function and
thyroid disorders are ofte n associated with an elevation
of ATL [24]. In the gonad module, we checked the
genes in the enriched functional categories using
DAVID online tools and
found that many g enes (CLDN3, CLDN4, PTK2B, EPAS,
CDH1,CDH2,TYMP,TGFA,WT1,CTGF,FN1and
ITGB3) related to cell adhesion or migration were asso-
ciated to ovarian tumors. Moorthy et al. (2005) reported
that administration of gonadal hormones like estradiol
and progesterone decreased ALT levels in heart, liver,
kidney and uterus in naturally menopausal rats [25].
For HDL-C, the backfat module, was slightly enriched
for apolipoprotein genes including APOB, APOA4,
APOC3, APOC4 and APOH (P
Benjamini
=0.061).This
observation is unexpected, since no evidence was found
to support the synthesis of these apolipoproteins in adi-
pose tissue. Both thyroid gland and hypothalamus mod-
ules contain a group of genes participating in mRNA
processing specifically mRNA splicing. Alternative pre-
mRNA splicing plays an important role in the control of
neuronal development a nd function [26]. Thyroid hor-
mones and their receptors have been shown to stimulate
reverse cholesterol transport in animal models [27].
Multiple-tissue network
To explore the connections between tissues at the gene
expression level, we built a co-expression network con-
taining all the QTT for NEFA from the five tissues
(Figure 3). Module 3, in which hypothalamus genes are
overrepresented, appears to be particularly interesting.
The top 10% most connected genes in this module are
from four different tissues and might constitute core
regulation pathways involved in communication between
tissues. Additionally, we have also shown that genes
have a sig nificantly higher average inter-tissue connec-
tivity in the hypothalamus than in other tissues (Figure
3b). These observations emphasize the central role of
hypothalamus genes in the multiple-tissue co-expression
network. Dobrin et al. (2009) constructed inter-tissue
co-expression networks betwe en hypothalamus, liver
and adipose tissue. Their results also suggested the
hypothalamus as the controlling tissue since asymmetric
connectivity was more common in the hypothalamus
than in other tissues. e.g., the most connected hypotha-
lamus gene, Aqp5 was linked to 169 adipose genes,
while adipose gene Aqp5 wa s only li nked to tw o
hypothalamus genes. Interestingly, the hypothalamus i s
known as an o rgan that integrates and responds to s ig-
nals from peripheral tissues [28,29].
More links were found in hub genes between modules
1 and 3 than between any other modules (Figure 3d),
suggesting that the genes in these two modules act in a
more coordinate fashion. Several h ypothalamus genes
(FAM69B, NPTXR, RUNDC3A, N4BP2L2, KIAA1429,
SNURF and KCTD20) and a backfat gene (RUNDC3B)
in module 3 were highly connected to hub genes in
module 1. Furthermore, we examined the hub genes in
module 3 (Additional file 5: Table S5) using DAVID
online tools [14], and highlighted the genes associated
with functions in corresponding tissues. We found
genes in the hypothalamus that were related to the dif-
ferentiation and development of the central nervous sys-
tem (ATP7A, CDK5, HPRT1 and SS18L1) and to protein
transport and localization (ARFIP1, RAB6B, SENP2,
C11orf2, PACS1, RIMS1 and TNKS). Most of these
genes are relevant to neuron function or energy balance
e.g., CDK5 is a member of the cyclin dependent kinase
family, and serves as an essential modulator of synaptic
function and plasticity [30]. RAB6B isaGTPasepredo-
minantly expressed in brain that has been suggested to
participate in retrograde transport of cargo in neuronal
cells [31]. This gene was also up-regulated in the brain
of mice fed with omega 3 polyunsaturated fatty acid
enriched diet [32]. TNKS is a Golgi associated poly-
Yang et al. Genetics Selection Evolution 2011, 43:28
/>Page 10 of 12
ADP-ribose polymerase gene, abundantly expressed in
brain. TNKS-deficient mice show an increase in energy
expenditure, fatty acid oxidation and insulin simula ted
glucose utilization [33]. Two transcripts in the backfat
module correspond to UGP2, which is involved in the
synthesis of UDP-glucose, the precursor of glycogen in
liver and muscle tissue, and of lactose in lactating mam-
mary gland. Among the adenohypophysis genes, FTO,
RHOB and ELP2 are related to the function of the ade-
nohypo phy sis. FTO is a well studied gene that is abun-
dantly expressed in the hypothalamus and
adenohypophysis and related to food intake and obesity
[34,35]. RHOB is a GTP-binding protein involved in
vesicular trafficking in anterior pituitary cells [36]. ELP2
is an isofor m of steroidogenic factor 1 (SF1), and plays
an important role on pituitary gonadotrope function.
Conclusions
Our results suggest a partial hereditary basis for some
metab olite levels, like total protein, NEFA, ALP, LDL-C,
haptoglobin and PigMAP. Single-tissue gene co-expres-
sion networks were composed of highly connected mod-
ules associated with metabolites (especially NEFA) that
had a biologically meaningful role. T hese networks
were, in general, tissue-specific. Finally, the multiple-tis-
sue network emphasized the central role played by the
hypothalamus.
Additional material
Additional file 1: Pearson correlation coefficients for pairs of traits.
This file provides the analysis of pair-wise Pearson correlation coefficients
for levels of the 12 metabolites.
Additional File 2: Enrichment of KEGG or GO categories in the
modules of the five tissues for five plasma metabolites. This file
provides detailed KEGG and GO categories that are significantly (P
Benjamini
< 0.05) enriched in QTT modules associated with nonesterified fatty
acids, HDL-C, Triglyceride, Glucose and Alanine aminotransferase.
Additional File 3: Strengths of connection between any two tissues
in terms of inter-tissue correlations of gene expression traits. This
file provides a table of connection between any tissue pairs in terms of
inter-tissue correlations of gene expression traits.
Additional File 4: Enrichment of tissue probesets in modules of
multiple-tissue network for NEFA. This file provides results of
enrichment of probesets from a certain tissue in the modules of
multiple-tissue network that associated with non-esterified fatty acids.
Additional File 5: Top 10% probesets in module 3 of the multiple-
tissue network for NEFA. This file provides origin of tissue, gene
symbols, Entrez gene ID, Intramodular connectivity and annotations for
top 10% probesets in module 3 of the multiple-tissue network that
associated with non-esterified fatty acids.
Acknowledgements
We thank all the people involved in tissue collection for this experiment, in
particular, M. López-Béjar, A.L. Ferraz and L. Fernandes. BY is funded by a
scholarship (File No. 2008836039) from the China Scholarship Council (CSC).
The work was funded by grants AGL2007-65563-C02/GAN and AGL2010-
14822/GAN to MPE and by a Consolider grant from Spanish Ministry of
Research, CSD2007-00036 “Centre for Research in Agrigenomics”.
Author details
1
Department of Food and Animal Science, Veterinary School, Universitat
Autònoma de Barcelona, Bellaterra, 08193 Spain.
2
Centre for Research in
Agricultural Genomics (CRAG), Bellaterra, 08193 Spain.
3
Key Laboratory for
Animal Biotechnology of Jiangxi Province and the Ministry of Agriculture of
China, Jiangxi Agricultural University, Nanchang, 330045, China.
4
Department
of Biochemistry and Molecular Biology, Veterinary School, Universitat
Autònoma de Barcelona, Bellaterra, 08193 Spain.
5
ICREA, Passeig Lluís
Companys, 23; 08010 Barcelona, Spain.
Authors’ contributions
MPE and BY designed the study, AB and YS provided the metabolite
measurements, BY analyzed data. BY and MPE wrote the manuscript with
help from the rest of authors. All authors read and approved the final
manuscript.
Competing interests
The authors declare that the y have no competing interests.
Received: 11 March 2011 Accepted: 25 July 2011
Published: 25 July 2011
References
1. Pond WG, Su DR, Mersmann HJ: Divergent concentrations of plasma
metabolites in swine selected for seven generations for high or low
plasma total cholesterol. J Anim Sci 1997, 75(2):311-316.
2. Turk JR, Laughlin MH: Physical activity and atherosclerosis: which animal
model? Can J Appl Physiol 2004, 29(5):657-683.
3. Sabatti C, Service SK, Hartikainen AL, Pouta A, Ripatti S, Brodsky J, Jones CG,
Zaitlen NA, Varilo T, Kaakinen M, Sovio U, Ruokonen A, Laitinen J, Jakkula E,
Coin L, Hoggart C, Collins A, Turunen H, Gabriel S, Elliot P, McCarthy MI,
Daly MJ, Järvelin MR, Freimer NB, Peltonen L: Genome-wide association
analysis of metabolic traits in a birth cohort from a founder population.
Nat Genet 2009, 41(1):35-46.
4. Chen R, Ren J, Li W, Huang X, Yan X, Yang B, Zhao Y, Guo Y, Mao H,
Huang L: A genome-wide scan for quantitative trait loci affecting serum
glucose and lipids in a White Duroc x Erhualian intercross F(2)
population. Mamm Genome 2009, 20(6):386-392.
5. Ferrara CT, Wang P, Neto EC, Stevens RD, Bain JR, Wenner BR, Ilkayeva OR,
Keller MP, Blasiole DA, Kendziorski C, Yandell BS, Newgard CB, Attie AD:
Genetic networks of liver metabolism revealed by integration of
metabolic and transcriptional profiling. PLoS Genet 2008, 4(3):e1000034.
6. Wolfs MG, Rensen SS, Bruin-Van Dijk EJ, Verdam FJ, Greve JW, Sanjabi B,
Bruinenberg M, Wijmenga C, van Haeften TW, Buurman WA, Franke L,
Hofker MH: Co-expressed immune and metabolic genes in visceral and
subcutaneous adipose tissue from severely obese individuals are
associated with plasma HDL and glucose levels: a microarray study.
BMC Med Genomics 2010, 3:34.
7. Perez-Enciso M, Ferraz AL, Ojeda A, Lopez-Bejar M: Impact of breed and
sex on porcine endocrine transcriptome: a bayesian biometrical analysis.
BMC Genomics 2009, 10:89.
8. Irizarry RA, Bolstad BM, Collin F, Cope LM, Hobbs B, Speed TP: Summaries of
Affymetrix GeneChip probe level data. Nucleic Acids Res 2003, 31(4):e15.
9. R development core team: R: A Language and Environment for Statistical
Computing. R Foundation for Statistical Computing Vienna, Austria 2009,
ISBN 3-900051-07-0.
10. Subramanian A, Tamayo P, Mootha VK, Mukherjee S, Ebert BL, Gillette MA,
Paulovich A, Pomeroy SL, Golub TR, Lander ES, Mesirov JP: Gene set
enrichment analysis: a knowledge-based approach for interpreting
genome-wide expression profiles. Proc Natl Acad Sci USA 2005,
102(43):15545-15550.
11. Langfelder P, Horvath S: WGCNA: an R package for weighted correlation
network analysis. BMC Bioinformatics 2008, 9:559.
12. Zhang B, Horvath S: A general framework for weighted gene co-
expression network analysis. Stat Appl Genet Mol Biol 2005, 4:Article17.
13. Tsai S, Cassady JP, Freking BA, Nonneman DJ, Rohrer GA, Piedrahita JA:
Annotation of the Affymetrix porcine genome microarray. Anim Genet
2006, 37(4):423-424.
Yang et al. Genetics Selection Evolution 2011, 43:28
/>Page 11 of 12
14. Huang da W, Sherman BT, Lempicki RA: Systematic and integrative
analysis of large gene lists using DAVID bioinformatics resources.
Nat Protoc 2009, 4(1):44-57.
15. Ferraz AL, Ojeda A, Lopez-Bejar M, Fernandes LT, Castello A, Folch JM,
Perez-Enciso M: Transcriptome architecture across tissues in the pig.
BMC Genomics 2008, 9:173.
16. Benjamini Y, Hochberg Y: Controlling the false discovery rate: A practical
and powerful approach to multiple testing. J Roy Statist Soc, Ser B 1995,
57(1):289-300.
17. Yang X, Schadt EE, Wang S, Wang H, Arnold AP, Ingram-Drake L, Drake TA,
Lusis AJ: Tissue-specific expression and regulation of sexually dimorphic
genes in mice. Genome Res 2006, 16(8):995-1004.
18. Pinto S, Roseberry AG, Liu H, Diano S, Shanabrough M, Cai X, Friedman JM,
Horvath TL: Rapid rewiring of arcuate nucleus feeding circuits by leptin.
Science 2004, 304(5667):110-115.
19. Stojilkovic SS: Pituitary cell type-specific electrical activity, calcium
signaling and secretion. Biol Res 2006, 39(3):403-423.
20. Barb CR, Kraeling RR, Rampacek GB: Glucose and free fatty acid
modulation of growth hormone and luteinizing hormone secretion by
cultured porcine pituitary cells. J Anim Sci 1995, 73(5):1416-1423.
21. Barb CR, Kraeling RR, Barrett JB, Rampacek GB, Campbell RM, Mowles TF:
Serum glucose and free fatty acids modulate growth hormone and
luteinizing hormone secretion in the pig. Proc Soc Exp Biol Med 1991,
198(1):636-642.
22. Engel HR, Hallman L, Siegel S, Bergenstal DM: Effect of growth hormone
on plasma unesterified fatty acid levels of pypophysectomized rats.
Proc Soc Exp Biol Med 1958, 98(4):753-755.
23. Casanueva FF, Villanueva L, Dieguez C, Diaz Y, Cabranes JA, Szoke B,
Scanlon MF, Schally AV, Fernandez-Cruz A: Free fatty acids block growth
hormone (GH) releasing hormone-stimulated GH secretion in man
directly at the pituitary. J Clin Endocrinol Metab 1987, 65(4):634-642.
24. Huang MJ, Liaw YF: Clinical associations between thyroid and liver
diseases. J Gastroenterol Hepatol 1995, 10(3):344-350.
25. Moorthy K, Sharma D, Basir SF, Baquer NZ: Administration of estradiol and
progesterone modulate the activities of antioxidant enzyme and
aminotransferases in naturally menopausal rats. Exp Gerontol 2005,
40(4):295-302.
26. Li Q, Lee JA, Black DL: Neuronal regulation of alternative pre-mRNA
splicing. Nat Rev Neurosci 2007, 8(11):819-831.
27. Pedrelli M, Pramfalk C, Parini P: Thyroid hormones and thyroid hormone
receptors: effects of thyromimetics on reverse cholesterol transport.
World J Gastroenterol 2010, 16(47):5958-5964.
28. Lam TK, Schwartz GJ, Rossetti L: Hypothalamic sensing of fatty acids.
Nat Neurosci 2005,
8(5):579-584.
29. Williams G, Bing C, Cai XJ, Harrold JA, King PJ, Liu XH: The hypothalamus
and the control of energy homeostasis: different circuits, different
purposes. Physiol Behav 2001, 74(4-5):683-701.
30. Cheung ZH, Fu AK, Ip NY: Synaptic roles of Cdk5: implications in higher
cognitive functions and neurodegenerative diseases. Neuron 2006,
50(1):13-18.
31. Wanschers BF, van de Vorstenbosch R, Schlager MA, Splinter D,
Akhmanova A, Hoogenraad CC, Wieringa B, Fransen JA: A role for the
Rab6B Bicaudal-D1 interaction in retrograde transport in neuronal cells.
Exp Cell Res 2007, 313(16):3408-3420.
32. Kitajka K, Sinclair AJ, Weisinger RS, Weisinger HS, Mathai M, Jayasooriya AP,
Halver JE, Puskas LG: Effects of dietary omega-3 polyunsaturated fatty
acids on brain gene expression. Proc Natl Acad Sci USA 2004,
101(30):10931-10936.
33. Yeh TY, Beiswenger KK, Li P, Bolin KE, Lee RM, Tsao TS, Murphy AN,
Hevener AL, Chi NW: Hypermetabolism, hyperphagia, and reduced
adiposity in tankyrase-deficient mice. Diabetes 2009, 58(11):2476-2485.
34. Church C, Moir L, McMurray F, Girard C, Banks GT, Teboul L, Wells S,
Bruning JC, Nolan PM, Ashcroft FM, Cox RD: Overexpression of Fto leads
to increased food intake and results in obesity. Nat Genet 2010,
42(12):1086-1092.
35. Dina C, Meyre D, Gallina S, Durand E, Korner A, Jacobson P, Carlsson LM,
Kiess W, Vatin V, Lecoeur C, Delplanque J, Vaillant E, Pattou F, Ruiz J, Weill J,
Levy-Marchal C, Horber F, Potoczna N, Hercberg S, Le Stunff C,
Bougnères P, Kovacs P, Marre M, Balkau B, Cauchi S, Chèvre JC, Froguel P:
Variation in FTO contributes to childhood obesity and severe adult
obesity. Nat Genet 2007, 39(6):724-726.
36. Cussac D, Leblanc P, L’Heritier A, Bertoglio J, Lang P, Kordon C, Enjalbert A,
Saltarelli D: Rho proteins are localized with different membrane
compartments involved in vesicular trafficking in anterior pituitary cells.
Mol Cell Endocrinol 1996, 119(2):195-206.
doi:10.1186/1297-9686-43-28
Cite this article as: Yang et al.: Association between plasma metabolites
and gene expression profiles in five porcine endocrine tissues. Genetics
Selection Evolution 2011 43:28.
Submit your next manuscript to BioMed Central
and take full advantage of:
• Convenient online submission
• Thorough peer review
• No space constraints or color figure charges
• Immediate publication on acceptance
• Inclusion in PubMed, CAS, Scopus and Google Scholar
• Research which is freely available for redistribution
Submit your manuscript at
www.biomedcentral.com/submit
Yang et al. Genetics Selection Evolution 2011, 43:28
/>Page 12 of 12