Báo cáo sinh học: "Assessing the contribution of breeds to genetic diversity in conservation schemes" pps
Bạn đang xem bản rút gọn của tài liệu. Xem và tải ngay bản đầy đủ của tài liệu tại đây (278.04 KB, 21 trang )
Genet. Sel. Evol. 34 (2002) 613–633
613
© INRA, EDP Sciences, 2002
DOI: 10.1051/gse:2002027
Original article
Assessing the contribution of breeds
to genetic diversity in conservation
schemes
Herwin E
DING
a∗
,RichardP.M.A.C
ROOIJMANS
b
,
Martien A.M. G
ROENEN
b
,TheoH.E.M
EUWISSEN
c
a
Institute for Animal Breeding and Genetics, 37075 Göttingen, Germany
b
Animal Breeding and Genetics group, Wageningen Institute for Animal Science,
Wageningen University, Box 338, 6700 AH Wageningen, The Netherlands
c
Institute for Animal Science and Health, Box 65, 8200 AB Lelystad,
The Netherlands
(Received 27 March 2001; accepted 16 May 2002)
Abstract – The quantitative assessment of genetic diversity within and between populations is
important for decision making in genetic conservation plans. In this paper we define the genetic
diversity of a set of populations, S, as the maximum genetic variance that can be obtained in
a random mating population that is bred from the set of populations S. First we calculated the
relative contribution of populations to a core set of populations in which the overlap of genetic
diversity was minimised. This implies that the mean kinship in the core set should be minimal.
The above definition of diversity differs from Weitzman diversity in that it attempts to conserve
the founder population (and thus minimises the loss of alleles), whereas Weitzman diversity
favours the conservation of many inbred lines. The former is preferred in species where inbred
lines suffer from inbreeding depression. The application of the method is illustrated by an
example involving 45 Dutch poultry breeds. The calculations used were easy to implement and
not computer intensive. The method gave a ranking of breeds according to their contributions
to genetic diversity. Losses in genetic diversity ranged from 2.1% to 4.5% for different subsets
relative to the entire set of breeds, while the loss of founder genome equivalents ranged from
22.9% to 39.3%.
conservation / genetic diversity / gene banks / marker estimated kinships / poultry
1. INTRODUCTION
In conservation genetics of livestock the question of which breeds to conserve
is important. Decisions on which breeds to conserve can be based on a number
of different considerations, with the degree of endangerment being the most
∗
Correspondence and reprints
E-mail:
614 H. Eding et al.
important [8]. Forced by limited resources to concentrate efforts on only a
few populations under threat, we need insight into the genetic variation present
in each population. Quantitative assessment of genetic diversity within and
between populations is a tool for decision making in genetic conservation
plans. Weitzman proposed a method to quantify the diversity in a set of
populations [11], which is based on pairwise genetic distances between the
populations. In the same paper, Weitzman put forth a number of criteria (see
Sect. 2 for further details), to which a meaningful measure of diversity should
adhere. Thaon d’Arnoldi et al. demonstrated this method in a set of cattle
breeds [10]. They noted that because of the recursive nature of the Weitzman
method, the algorithm to calculate the total diversity in a set of breeds and the
loss of genetic diversity when a breed is excluded from the set is c omplex and
computer intensive, limiting its use to sets of 25 populations or less. A simpler
method, which would not have these limitations, would be advantageous.
In this paper we develop such a method based on marker estimated kinships
(MEK). Eding and Meuwissen [3] proposed the use of MEK to asses genetic
diversity, a measure which expresses genetic diversity in terms of average
(estimated) kinships between (and within) populations using genetic marker
genes. In contrast, the Weitzman method expresses only between population
diversity. Furthermore, kinships have a direct relationship with other well-
known indicators of genetic diversity [3]. A population that is the result of
random mating within and between populations of a conserved set will show
the conserved genetic variance which is: σ
2
w
= (1 −
¯
f )σ
2
a
,whereσ
2
a
is the
total original genetic variance and
¯
f is the average kinship within the set of
populations [4] (page 265; their term “line” refers to the conserved set here).
Note that this definition assumes that genetic diversity is the result of genetic
drift only. Mutation is not accounted for in this method, since the time scale
of breed formation is relatively small such that mutations are expected to have
only a minor impact on diversity [3].
From the former, it follows that a kinship based method of assessing genetic
diversity is essentially based on genetic variance. Thaon d’Arnoldi et al.
observed that variance based estimates do not necessarily comply with Weitz-
man criteria. For instance, it is possible that the removal of a population from
the set leads to an increase in diversity [10].
In this note we propose a MEK based definition of total genetic diversity
in a set of populations. Genetic diversity is defined as: the maximum of
genetic variation present in a population in Hardy-Weinberg equilibrium that
is derived from breeds in the core set. The calculations used are non-recursive
and therefore easier to implement and less computer intensive than the Weitz-
man approach. Moreover, this method accounts for both within and between
population diversity simultaneously. The method relies on the estimation of the
contribution of each breed to a core set (core set). These estimated contributions
Assessing genetic diversity 615
provide a way of ranking breeds according to their importance with regards to
genetic diversity, as will be demonstrated in an example of poultry breeds.
2. METHOD
As an example, consider three populations, where populations 2 and 3 are
identical, while population 1 is unrelated to both 2 and 3. The kinship matrix
is:
M =
100
011
011
The average kinship in M is 5/9 (5 ones over 9 elements). Removal of
population 3 from M leads to
M
∗
=
10
01
and the average kinship has decreased to 2/4, which implies an increase of
genetic diversity. This is in violation of the Weitzman criteria, according to
which the removal of a population should have either a negative or zero effect
on the measure of diversity. The decrease in average kinship that occurred with
the removal of population 3 from the set, occurred because populations 3 and 2
are the same population. There is one population that contributes twice to the
mean kinship of set S and is actually over-represented.
This problem is avoided by basing the diversity contained in set S on the
mean kinship of a core set of set S, where the core set is a mixture of populations
such that “genetic overlap” within the core set is minimised [5]. Minimising
the mean kinship within a core set does this.
The coefficient of kinship is defined as the probability that two randomly
drawn alleles from two individuals are identical by descent. Thus the average
coefficient of kinship between two populations indicates the fraction of alleles
two populations have in common through common ancestors. To eliminate
as much genetic overlap as possible, the average coefficient of kinship in the
core set of S should be minimised. In the case of the former example the
solution would be the removal of population 3 (or equivalently, r emoval of
population 2). This removal does not affect the diversity contained in the core
set, which seems intuitively correct.
2.1. Optimal contributions to a core set
Consider an n × nmatrixM containing within and between population
kinships for n populations in set S. Also define an n-dimensional vector c that
616 H. Eding et al.
will contain the relative contribution of each population to the core set, such
that the elements of c sum up to one. We can calculate the average kinship in
the set, given c,as:
f (S) = c
Mc. (1)
For the construction of the core set we must find contributions in c such that
the average kinship in the core set is minimal. To this end we introduce a
Lagrangian multiplier λ that restricts the c vector such that the elements of c
sum up to 1, leading to the Lagrangian equation:
L(S) = c
Mc − λ
c
1
n
− 1
(2)
where 1
n
is a n dimensional vector of ones.
Setting the first derivative of (2) with respect to c to zero we get:
∂L(S)
min
∂c
= 2Mc − λ1
n
= 0
Mc =
1
2
λ1
n
c =
1
2
λM
−1
1
n
. (3)
And since c
1
n
= 1
c
1 =
1
2
λ1
n
M
−1
1
n
= 1
λ =
2
1
n
M
−1
1
n
· (4)
Substituting this result in (3) we obtain:
c
min
=
M
−1
1
n
1
n
M
−1
1
n
· (5)
The minimum kinship in the core set, f (S)
min
, can be obtained from
c
min
Mc
min
=
1
1
n
M
−1
1
n
2
· 1
n
M
−1
1
n
=
1
1
n
M
−1
1
n
· (6)
Because the genetic variance contained within set S is proportional to
(1 − f (S)
min
), the genetic diversity Div(S) in set S is defined as Div(S) =
1 − f (S)
min
.
Assessing genetic diversity 617
2.2. The Weitzman criteria
Weitzman defined four criteria for a proper measure of diversity [10, 11].
Criterion 1: Continuity in species. The total amount of diversity in a set of
populations should not increase when a population is removed from the set.
Criterion 2: The twin property. The addition of an element identical to an
element already in the set should not change the diversity content in a set of
populations.
Criterion 3: Continuity in distance. A small change in distance measures
should not result in large changes in the diversity measure.
Criterion 4: Monotonicity in distance. The diversity contained in a set of
populations should increase if the distance between these populations increases.
With regards to the first criterion: Since kinship is essentially a measure of
variance it is possible that the estimated genetic diversity in terms of kinship
increases when a population is removed from the set [10]. However, when
the contribution of each population is optimised, the average kinship is at a
minimum. Removal of a breed from the set will give a solution away from
the minimum average kinship if the contribution of this breed is non-zero and
genetic diversity will decrease. In the case a population is identical to another
population in the set ( or an inbred sub-population of another population) its
contribution is zero and can be excluded from the set without affecting t he
diversity, which satisfies criterion 2.
With regards to criterion 3: The measure of genetic diversity in a set of breeds
as presented above is a continuous function of the (estimated) average kinships
between and within breeds. Hence, the measure of genetic diversity presented
here changes only slightly, when kinships or distances change slightly.
With regards to criterion 4, it should be noted that an increase in genetic
distance in a pure drift model can be caused by two reasons: (1) a decrease in
the kinship between breeds, and (2) an increase in the within breed kinships (i.e.
continued inbreeding within a population). In the latter situation, criterion 4
does not hold, since continued inbreeding reduces genetic diversity, even as the
genetic distance increases. Criterion 4 can be rewritten in terms of kinships
between populations as: the diversity contained in a pair of populations should
increase if the kinship between or within these populations decreases. This
preserves the intent of criterion 4 and the core set method adheres to this
criterion (see Sect. 4).
2.3. Application to real marker data
As an illustration of the use of the MEK/core set method, we present here the
results from a data set containing microsatellite data from 46 lines of poultry.
DNA was isolated from pooled blood samples (approximately 50 animals per
line) as described by Crooijmans et al. [2]. For Sumatra breed only 10 animals
618 H. Eding et al.
were present in the pool. These 46 lines were genotyped for 17 microsatellites.
Within the lines, three major groups could be distinguished: Commercial layer
lines (N
l
= 9) which were subdivided into brown layers (lines 25, 26, 27,
29 and 57) and white layers (lines 17, 18, 20, 56), commercial broiler lines
(N
b
= 17) and non-commercial breeds of poultry (N
h
= 20). The latter
included indigenous Dutch breeds, which are mainly kept and bred as fancy
breeds, and the Bankiva and Sumatra breed. The data are summarised in
Table I.
Per locus similarity scores were calculated from t he allele frequencies. For
a single locus with K alleles the similarity between populations i and j, can be
calculated as:
¯
S
ijk
=
k
p
ik
p
jk
(7)
where k is the kth allele of the locus. This expression assumes a random
breeding population. To account for a structured population one could calculate
similarities between individuals and average over pairs of animals to obtain the
mean similarity between populations [3].
We defined the population that existed just before this first fission as the
founder population, in which all animals are unrelated. Analysis of the
similarity scores indicated that the earliest detectable population fission was
between the Bankiva and the cluster of broiler lines, i.e. they had the lowest
similarity scores. The per l ocus average similarity between the Bankiva and
the broiler cluster were assumed to be s, i.e. the probability of alleles Alike In
State. Hence, an estimate of the kinship between populations i and j for L loci
can be calculated:
ˆ
f
ij
=
1
L
L
l=1
S
ij,l
− s
l
1 − s
l
· (8)
MEKs between and within populations were calculated as the weighted average
of kinship estimates per locus, where the standard errors of the estimates are
used for weighing [3].
3. RESULTS
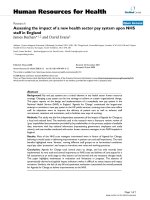
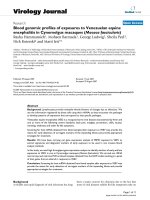
Figure 1 is a graphical representation of the 46 × 46 M matrix containing
the MEKs, where a darker shade reflects a higher kinship between populations.
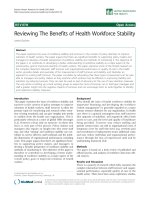
A schematic representation of the relations is given as a Neighbour-Joining
tree in Figure 2. The tree was constructed using the Phylip package [6]. For
the construction of this tree kinship estimates had to be converted to “kinship
distances” by:
d(i, j) =
ˆ
f
ii
+
ˆ
f
jj
− 2
ˆ
f
ij
. (9)
Assessing genetic diversity 619
Table I. Summary of the data on poultry lines and genetic markers used in the
application of the marker estimated kinship/core set method.
¯
H
O
refers to the mean
observed heterozygosity over all loci per line.
Indigenous populations Commercial lines Markers used # alleles
¯
H
O
¯
H
O
Assendelft fowl 0.325 Broiler CD 0.587 ADL0112 5
Bankiva 0.306 Broiler CG 0.538 ADL0114 8
Barnevelder A 0.417 Broiler CH 0.545 ADL0268 8
Barnevelder B 0.445 Broiler CK 0.530 ADL0278 7
Bearded Polish 0.346 Broiler CO 0.488
Brabanter 0.531 Broiler CP 0.586 LEI0166 5
Breda fowl 0.464 Broiler CQ 0.530 LEI0228 26
Drents fowl 0.472 Broiler CR 0.541
Dutch Bantam 0.487 Broiler CT 0.562 MCW0111 6
Dutch booted bantam 0.474 Br oiler CV 0.578 MCW0014 11
Dutch Owl-bearded 0.487 Broiler CZ 0.464 MCW0150 8
Frisian fowl 0.363 Broiler DA 0.572 MCW0183 13
Groninger Mew 0.233 Broiler DB 0.556
MCW0248 10
Hamburgh 0.448 Broiler DD 0.563
MCW0295 8
Kraienkoppe 0.363 Br oiler DE 0.550
MCW0330 6
Lakenvelder 0.363 Broiler EE 0.497
MCW0004 17
Non-bearded Polish 0.237 Broiler GB 0.534 MCW0067 7
Noord Hollands hoen 0.474
MCW0078 8
Sumatra 0.322 Layer 17 (white) 0.394
MCW0081 11
Welsummer 0.423 Layer 18 (white) 0.405
Layer 20 (white) 0.416
Layer 56 (white) 0.408
Layer 25 (brown) 0.514
Layer 26 (brown) 0.526
Layer 27 (brown) 0.512
Layer 29 (brown) 0.503
Layer 57 (brown) 0.547
Note that this distance is twice the Nei minimum distance corrected for allele
frequencies in the founder population. In the contour plot of Figure 1 the
populations are ranked according to the dendrogram of Figure 2.
620 H. Eding et al.
Sumatra
Layer 17
Layer 20
Layer 18
Layer 56
Welsummer
Broiler CD
Broiler CT
Broiler GB
Broiler CQ
Broiler DE
Broiler CG
Broiler DA
Broiler CP
Broiler DD
Broiler CH
Broiler CK
Broiler CO
Broiler CZ
Broiler DB
Broiler CR
Broiler CV
Broiler EE
Barneveld B
Barneveld A
Booted bantam
Layer 25
Layer 27
Layer 26
Layer 57
Layer 29
NH hoen
Gron.Mew
Polish brd
Owl beard
Polish non-brd
Brabanter
Frisian
Breda
Assendelft
Lakenvelder
Hamburgh
Drents
Dutch bantam
Kraienkoppe
Bankiva
Sumatra
Layer 17
Layer 20
Layer 18
Layer 56
Welsummer
Broiler CD
Broiler CT
Broiler GB
Broiler CQ
Broiler DE
Broiler CG
Broiler DA
Broiler CP
Broiler DD
Broiler CH
Broiler CK
Broiler CO
Broiler CZ
Broiler DB
Broiler CR
Broiler CV
Broiler EE
Barneveld B
Barneveld A
Booted bantam
Layer 25
Layer 27
Layer 26
Layer 57
Layer 29
NH hoen
Gron.Mew
Polish brd
Owl beard
Polish non-brd
Brabanter
Frisian
Breda
Assendelft
Lakenvelder
Hamburgh
Drents
Dutch bantam
Kraienkoppe
0.600-0.700
0.500-0.600
0.400-0.500
0.300-0.400
0.200-0.300
0.100-0.200
0.000-0.100
-0.100-0.000
Figure 1. Graphical representation of marker estimated kinship matrix. Shading is dependent on the value of the MEK, where darker
shades reflect a higher kinship estimate.
Assessing genetic diversity 621
Figure 2. Neighbour-Joining tree representation of relationships between 46 popula-
tions of poultry.
622 H. Eding et al.
The dendrogram resulting from the kinship distances shows three main
clusters. The Bankiva breed, generally considered to be closely related to the
ancestral population of all poultry breeds, constitutes one cluster, the Sumatra
another. All the old Dutch fancy breeds and commercial lines are clustered
together in what could be termed as “Western cluster”. Within the Western
cluster we see two separated clusters of layer lines and two closely related
clusters of broiler lines. The distinction between the two clusters of broiler
lines can be seen from the contour plot. The first cluster, comprised of broiler
lines CD through CH, has a generally low kinship with the other populations
in the set, whereas the second cluster (broiler lines CK to EE) is related not
only to the first broiler cluster, but also to a cluster of Layer lines (Layer 17,
20, 56 and 18) and a number of indigenous breeds. A similar pattern can be
observed in the two clusters of layer lines. The cluster consisting of Layer
lines 25, 26, 27, 29 and 57 (the brown layer lines) are only closely related t o
each other, while the cluster of Layer lines 17, 20, 56 and 18 (the white layer
lines) are related to a cluster of indigenous breeds (the cluster beginning with
Groninger Mew and ending with Hamburgh), apart from the relation with the
aforementioned cluster of broiler lines.
Considering that the length of the branches corresponds to the extent of
inbreeding, we can see from the tree representation, as well as from the contour
plot, that there are a number of indigenous poultry breeds (e.g. Welsummer,
Noord Hollands hoen, Groninger Mew, Non-bearded Polish fowl, Assendelft),
that seem to suffer from higher levels of inbreeding than commercial lines. The
within population MEK ranged from 0.17 to 0.28 for broiler lines, 0.29 to 0.42
for layer lines and 0.26 to 0.65 for Dutch indigenous breeds, averaging 0.24,
0.36 and 0.41 for broilers, layers and indigenous populations respectively.
There were a number of negative estimates of MEK, most notably for the
Bankiva (MEKs with broiler lines), Drents fowl and Welsummer (both for
MEKs with the brown layer lines). These negative estimates ranged from
−0.01 to −0.06 and were caused by sampling errors on the kinship estimates.
Note that in the case of the Bankiva and broiler lines the between population
similarity was used to estimate the alike-in-state probability, s, implying that
their expected kinship is zero.
The results of the core set method are given in Table II. In the uncorrected
solution we saw negative contributions. These arise when a within kinship
estimate of (a group of) population(s) is lower than the between population
average kinship of the population with the (group of) population(s) (see
Appendix B). Note that this can actually happen in practice, e.g., a large group
of half sibs has a within population kinship of approximately 0.125 while the
between population kinship of the half sib group with the common sire is
0.25. Because contributions to a core set cannot be negative, we iteratively
removed the breed with the most negative contribution from the core set setting
Assessing genetic diversity 623
Table II. Optimal contributions to a core set of Dutch poultry populations c
cor
. Div(M)
is the genetic diversity captured and is calculated as 1 − f
cs
, where f
cs
is the average
kinship in the core set.
Breed c
cor
Broiler CD 0.177
Broiler CP 0.167
Drents fowl 0.130
Bankiva 0.122
Layer 57 0.094
Dutch Bantam 0.094
Welsummer 0.066
Owl-bearded 0.056
Layer 26 0.043
Layer 27 0.024
Barneveld B 0.020
Booted bantam 0.005
Kraienkoppe 0.002
Broiler CH 0.001
Div(M) 0.935
its contribution to zero, until all contributions were equal or greater than zero.
This procedure results in the solution under c
cor
(Tab. II). Only populations
with non-zero contributions are given.
Fourteen of the 46 populations received a contribution greater than zero.
Six of these were commercial lines, while 7 Dutch indigenous breeds and the
Bankiva also contributed to the core set. Contributions of commercial lines
totalled 51%, while indigenous breeds contributed 37%. The broiler lines with
non-zero contributions all stem from one of the two clusters of broilers, namely
the cluster of broilers that is relatively isolated (see before). The layer lines
with non-zero contributions also stem from one cluster: the brown layer cluster
(25, 26, 27, 29 and 57), which was relatively more isolated.
Following Thaon d’Arnoldi et al. [10] we defined a set of breeds that are not
likely to become extinct (the Safe set, consisting of all commercial lines) and
compare the diversity lost by only retaining this Safe set to the safe set plus one
other breed (Safe + 1). This was done by comparing the diversity of the core
set constructed from the Safe set with the diversity of the core set created from
the Safe set plus one population (Safe + 1). The results are shown in Table III.
Genetic diversity was calculated i n two ways: Div(M) = 1 − f
cs
,wheref
cs
624 H. Eding et al.
Table III. Relative loss in genetic diversity, when only a fixed set of breeds is kept
(Safe, consisting of commercial broiler and layer lines) or the Safe set plus one other
population. Div(M) is the genetic diversity and N
ge
is the number of founder genome
equivalents [7] in the core set constructed from the populations in the indicated set.
Whole is the entire set of 46 populations. Losses are calculated relative to either the
genetic diversity or N
ge
of the Whole set. c
s+1
is the contribution of a population to
the core set constructed from the appropriate Safe + 1 set.
Set c
S+1
Div(M) % loss N
ge
% loss
Whole 0.935 7.69
Safe only 0.893 4.49 4.67 39.25
Safe + 1 set :
Drents fowl 0.247 0.916 2.06 5.93 22.89
Dutch bantam 0.269 0.915 2.12 5.90 23.35
Bankiva 0.180 0.914 2.29 5.79 24.77
Kraienkoppe 0.241 0.911 2.60 5.60 27.21
Dutch Owl-bearded 0.168 0.902 3.49 5.12 33.40
Welsummer 0.157 0.902 3.57 5.08 33.94
Brabanter 0.167 0.900 3.70 5.02 34.74
Frisian fowl 0.132 0.900 3.72 5.01 34.87
Breda fowl 0.138 0.900 3.72 5.01 34.87
Polish bearded 0.115 0.899 3.82 4.97 35.45
Sumatra 0.106 0.899 3.88 4.94 35.83
Polish non-bearded 0.100 0.898 3.91 4.92 36.02
Groninger Mew 0.079 0.897 4.05 4.86 36.83
Lakenvelder 0.109 0.897 4.05 4.86 36.83
Hamburgh 0.121 0.895 4.24 4.78 37.86
Barnevelder A 0.091 0.895 4.24 4.78 37.86
Booted bantam 0.098 0.895 4.26 4.77 37.98
Barnevelder B 0.067 0.894 4.35 4.73 38.51
Noord-Hollands hoen 0.051 0.894 4.44 4.69 38.97
Assendelft 0.000 0.893 4.49 4.67 39.25
is the average estimated kinship in the core set, and N
ge
= (2f
cs
)
−1
,where
N
ge
is the number of founder genome equivalents [1,7] represented in the core
set. Changes in Div(M) are directly related to changes in genetic variation of
quantitative traits. Changes in N
ge
indicate the loss of founders represented in
the core set, i.e. the potential loss of rare alleles and/or haplotypes.
Assessing genetic diversity 625
In terms of Div(M) the loss in genetic diversity by keeping only t he Safe
set compared to keeping the entire set of populations is rather small: 4.5%
(Tab. III). The loss in founder genome equivalents is substantially higher:
39.3%. This pattern remains throughout the different Safe + 1sets.
Of the populations not in the Safe set only the Assendelft showed a contri-
bution of zero. This can be attributed to the relatively high estimated kinships
with all other populations in the whole set (Fig. 1, see also Appendix C).
All other populations contributed moderately to substantially when added to
the Safe set (Tab. III). The contributions of breeds to the core set are not
very closely r elated to the loss due to exclusion of the breed. For instance,
inclusion of the Hamburgh gives the same increase in diversity as inclusion
of the Barnevelder A. However, its contribution is 33% higher: 0.121 for the
Hamburgh versus 0.091 for the Barnevelder A.
From Table III the first four breeds (Drents fowl, Dutch bantam, Bankiva
and Kraienkoppe) have large contributions to genetic diversity, both in terms of
their relative contributions (c
S+1
) and added genetic diversity, Div(M).Further
down the list, the contributions are markedly lower and the % losses markedly
higher. Looking at Figure 2 we see that these four breeds have a distinct
position in the dendrogram. They form clusters only with themselves and
the average kinships with the other populations indicate that these breeds are
relatively older and/or more isolated.
Comparing the results from Table II with the results from Table III, we see
that the top indigenous contributors are the same, although some reranking has
occurred. However, in Table II both the Barnevelder B and the Dutch Booted
bantam receive non-zero contributions, while in Table III they rank among the
lowest in diversity contributed to t he Safe + 1set.
4. DISCUSSION
In principle the core set method offers an alternative to the Weitzman [11]
approach in quantifying genetic diversity and support of decision making in
conservation genetics. The core set method has a number of advantages over
the Weitzman method.
First, it is easy to use. Calculations in the Weitzman method are complex
and time consuming, because of the recursive nature of the Weitzman method.
The core set method is a straightforward optimisation procedure requiring less
programming and computations. Also, the MEK/core set method could be
applied at the level of individuals, optimising the individual contributions to
a conservation scheme. In contrast, the number of calculations needed in
the Weitzman method limit the amount of data that can be used as input,
thus preventing the Weitzman method from being used in larger conservation
problems [10]. The MEK/core set method could also be extended to incorporate
626 H. Eding et al.
additional data, such as the economic valuation of genetic diversity, or data
on additional considerations for conservation, such as socio-economic and
traditional reasons. Alternatively, by using the weights per marker locus one
could place emphasis on the importance of certain genomic regions.
Second, the core set method uses between and within breed diversity simul-
taneously. Within and between population diversity are measured in the same
units (kinship) and the within breed diversity is weighed against the between
breed diversity. This means that an inbred population will receive a smaller
contribution. In the Weitzman method some additional weighing is needed to
account for within breed diversity. Following Weitzman [11], Thaon d’Arnoldi
et al. [10] suggest weighing with expected probabilities of extinction of each
breed in the set. However, this suggestion could lead to results opposite from
the core set method. A highly inbred breed will receive a lower contribution
in the core set method. Because of the higher risk of extinction, following
the suggestion by Thaon d’Arnoldi et al., such a breed would get a higher
weight, increasing its priority in conservation decisions. Extinction risk could
be accommodated in the core set method by calculating the expectation of
Div(M(I)), where the expectation is taken over a vector I of indicator variables
that indicates whether population i becomes extinct in set M(I) or not (I
i
= 0
means population i will become extinct).
Third, using average population kinships is a natural way for measuring
genetic diversity in a set of populations S, because it is proportional to the
maximum genetic variance that can be recovered in a random mating population
that is bred from populations S. Average population kinships are closely related
to well-known concepts as effective population sizes and inbreeding [3]. Most
genetic distances used in the analysis of microsatellite data can be written in
terms of kinships between and within population kinships [3]. Additionally, the
MEK/core set method closely links genetic diversity to variation in quantitative
traits, putting less emphasis on the conservation of r are alleles and more on the
conservation of a wide range of genotypes.
Due to the nature of the optimisation algorithm used in this study, rela-
tionships need only to be known proportionally. Different definitions of the
founder population (which is a major factor determining the values of the
marker estimated kinships [3]) will have no effect on the solution to the c
min
vector, which means that the composition of the core set does not change if the
definition of the founder population changes (Appendix A).
The tree representation in this paper was constructed using the Neighbour
Joining method on “kinship-distances” (which essentially is twice the Nei
minimum distance corrected for allele-frequencies in the founder population).
Generally this approach seems to give results that correlate well with the actual
estimates of the average kinship coefficients (Fig. 1). However, tree represent-
ations as in Figure 2 assume population fission and subsequent isolation and
Assessing genetic diversity 627
therefore do not show migration or crossbreeding patterns. A contour plot as
given in Figure 1 is able to show patterns of gene flow. The combination of the
dendrogram and contour plot, where the dendrogram is used to determine the
sorting order of the populations in the contour plot seems to give a clear image
of both relatedness and gene flow between (clusters of) populations.
Although we use a genetic distance (the “kinship distance”) for imaging
purposes, it should be noted that genetic distances in a pure drift model tend to
be ambiguous if they are used to assess genetic diversity. As an example, let
us consider the “kinship distance”:
d(i, j) =
ˆ
f
ii
−
ˆ
f
ij
+
ˆ
f
jj
−
ˆ
f
ij
.
(9)
The total distance between a pair of populations i and j is determined by two
distances: the distance between each population and the most recent common
ancestor of i and j (i.e. the founder of the pair (i, j)). Essentially the distance
between i and j is determined by the increase in kinships (or the amount of
inbreeding) since the founder of i and j. Given that f
ij
remains unchanged after
population fission, an increase in distance between i and j can only be caused
by an increase in f
ii
and/or an increase in f
jj
. This means that i n this case an
increase in distance can only occur if the inbreeding coefficient in i and/or j
increases.
This leads to a fundamental difference between Weitzman diversity and
kinship based diversity. The Weitzman criterion 4, i.e. diversity should increase
if distance increases, favours populations with extreme allele frequencies,
whereas the kinship based diversity will decrease if the extreme allele frequen-
cies occurred due to high inbreeding in the population. Favouring populations
with extreme frequencies, implies that new mutants are valued (which are
ignored by kinship based diversity), and that homozygote populations are
valued. Kinship based diversity does not value homozygotes, since it values
the genetic variance in a random mating population that could be bred from
the conserved set of populations. Conservation plans that maximise kinship
based diversity will minimise the change in allele frequencies from the founder
population and thus also minimise the loss of alleles.
The conservation of many fully inbred populations, which maximise Weitz-
man diversity, has the advantage that genetic variance will not change anymore,
i.e. further inbreeding will not result in any further loss of alleles. The drawback
however, is that many animal populations will not survive high levels of
inbreeding, and there is thus the danger that entire populations will be lost.
The use of Weitzman diversity may t hus lead to the conservation of highly
inbred, unfit populations, with allele frequencies that are very different from
the founder population. In contrast, the kinship based diversity criterion would
prefer non-inbred populations with frequencies close to the founder population.
628 H. Eding et al.
Overall, the kinship estimates and more specifically the low within breed
kinship estimates (relative to the between breed estimates) suggest that migra-
tion between populations is quite large. In such situations the MEK/core set
method would seem to be preferable to other methods, since complete isolation
of populations after fission is not assumed. Between population kinships may
be increased due to migration and the core set method will account for the
migration.
The per locus average similarity between the Bankiva and the broiler cluster
wereassumedtobes, because the genetic similarities between the Bankiva and
the broiler clusters were the lowest, indicating the oldest population fission.
From Figure 2 we can see that this actually indicated the first population fission
resulting in the Bankiva line and a line that was the ancestor to all “Western”
lines. The definition of s is somewhat ad-hoc here. Other, more formal methods
for the simultaneous estimation of f and s will be described in a subsequent
paper.
The base population is assumed to be the population that might have existed
at the time the population first split into two separate populations. The core set
method weighs the contributions of each breed in such a way that the genetic
diversity in the base population is recovered as fully as possible. In the different
sets for which solutions were calculated, genetic diversities ranged from 0.935
(full set) to 0.893 (“safe”set; see Tab. III). The MEK/core set method implicitly
assumes a base population in which all individuals are unrelated and therefore
Div(Base) = 1.00. This suggests that t he solutions to the c-vector conserve
approximately 90% or more of the genetic variation of the hypothetical founder
population. It may be noted that exclusion of a breed causes an adjustment of
the contributions of the remaining populations in such a way that the loss in
diversity is minimised. This readjustment uses the overlap in genetic diversity
between breeds, increasing weights of breeds that are genetically related to the
removed breed.
However, when the loss of diversity is expressed in founder genome equi-
valences, the loss is much larger, 23–39%, while the loss in genetic variation
is small: 2.0–4.5% This discrepancy is noteworthy, because both genetic
diversity and N
fe
are derived from the average kinship within a set of breeds [1].
Basically, as
¯
f increases from small to large, at first a lot of founder genomes
are lost while there is little loss of genetic variation. However, as
¯
f becomes
large, there are few founder genomes left and thus few will be lost, but the
loss of genetic variation becomes substantial. Thus, N
ge
is more sensitive to
initial increases of
¯
f (e.g. due to the loss of populations), while Div(M) is
more sensitive to the loss of populations when
¯
f is large. When conservation
of a sufficient number of founder alleles per locus is a consideration in a
conservation program, it might be advisable to express losses from excluding
breeds from the core set in terms of N
ge
instead of genetic diversity. Doing
Assessing genetic diversity 629
this does not affect the ranking of breeds with respect to their contribution to
diversity, but the relative contribution of a breed to N
ge
is larger than its relative
contribution t o genetic variation.
The r esults from the MEK/core set method seem promising. Application
of the method is flexible and is computationally feasible in large data sets.
According to the results presented in this paper it is possible to conserve
most of the genetic diversity originally found in the founder population. The
MEK/core set method employed in this paper provides a method of ranking
breeds according to their “diversity content”, both relative to the entire set and
relative to alternative sets (in this study the Safe set).
The c-vector could also be used to allocate resources to a gene bank. But
such an approach carries the risk that some breeds will be allocated insufficient
resources to maintain them as independent, viable populations. In these cases
crossbreeding might be used to conserve the diversity of breeds. However,
this could mean the loss of valuable genotypes and allele combinations that
need to be conserved. This is especially true for populations at risk, which by
definition are small in (effective) size and hence do not, generally, contribute to
diversity very much. If there are other criteria [9], according to which the loss
of a breed is deemed unacceptable, some extra restrictions could be applied
in Expression (2). Alternatively, it might be advisable to incorporate them in
the Safe set. Ultimately, the decision to conserve a breed is dependent on a
number of considerations of which genetic diversity in the terms presented in
this paper is only one [9,10].
ACKNOWLEDGEMENTS
The helpful comments of John Woolliams are gratefully acknowledged.
REFERENCES
[1] Caballero A., Toro M.A., Interrelations between effective population size and
other pedigree tools for the management of conserved populations, Genet. Res.
75 (2000) 331–343.
[2] Crooijmans R.P.M.A., Groen A.B., Kampen A.J.A van, Beek S. van der, Poel J.J.
van der, Groenen M.A.M., Microsatellite polymorphism in commercial broiler
and layer lines estimated using pooled blood samples, Poultry Sci. 75 (1996)
904–909.
[3] Eding J.H., Meuwissen T.H.E., Marker based estimates of between and within
population kinships for the conservation of genetic diversity, J. Anim. Breed.
Genet. 118 (2001) 141–159.
[4] Falconer D.S., Mackay T.F.C., Introduction to quantitative genetics, Longman
House, Harlow, 1996.
630 H. Eding et al.
[5] Frankel O.H., Brown A.H.D., Plant genetic resources today: a critical appraisal,
in: Crop genetic resources: conservation and evaluation, George Allen & Unwin,
London, United Kingdom, 1984.
[6] Felsenstein J., PHYLIP (Phylogeny Inference Package) Version 3.5c, Uni versity
of Washington, 1995, />[7] Lacy R.C., Analysis of founder representation in pedigrees: founder equivalents
and founder genome equivalence, Zoo Biol. 8 (1989) 111–124.
[8] Oldenbroek J.K., Genebanks and the conservation of farm animal genetic
resources, ID-DLO, Lelystad, The Netherlands, 1999.
[9] Ruane J., A critical review of the value of genetic distance studies in c onservation
of animal genetic resources, J. Anim. Breed. Genet.116 (1999) 317–323.
[10] Thaon d’Arnoldi C., Foulley J L., Ollivier L., An overview of the Weitzman
approach to diversity, Gen. Sel. Evol. 30 (1998) 149–161.
[11] Weitzman M.L., On diversity, Quart. J. Econ. 107 (1992) 363–405.
APPENDIX A
Invariance of the contributions vector to probability
of alleles Alike In State (AIS)
We consider the set M of m populations. Suppose A is an m × mmatrix
containing the actual (unknown) kinships between populations. The vector
containing optimal contribution to the core set should be calculated through:
c
min
=
A
−1
1
1
A
−1
1
(A.1)
where 1 is an m-dimensional vector of ones.
However, for a locus L where alleles can be alike in state without being
identical by descent the similarity matrix M
L
will be of the form:
M
L
=
(
1 − s
L
)
A + 11
s
L
(A.2)
where s
L
is the probability of alleles being alike in state but not identical by
descent [3]. Substituting t he similarity matrix M
L
for A , expression (A.1)
changes into:
ˆ
c
min
=
M
−1
L
1
1
M
−1
L
1
·
(A.3)
Assessing genetic diversity 631
For the calculation of the estimate of c
min
we need the inverse of M
L
. Setting
M = (1 − s
L
)A,weget:
M
−1
L
=
M + 11
s
L
−1
= M
−1
− M
−1
1
1
M
−1
1 + s
−1
L
−1
1
M
−1
. (A.4)
Multiplication by 1 gives:
M
−1
L
1 = M
−1
1 − M
−1
1
1
M
−1
1 + s
−1
L
−1
1
M
−1
1
= M
−1
1
1 −
1
M
−1
1
1
M
−1
1 + s
−1
L
·
(A.5)
Substituting (A.5) in (A.3) and substituting M = (1 − s
L
)A we see that
ˆ
c
min
=
M
−1
L
1
1
M
−1
L
1
=
A
−1
1
1
A
−1
1
= c
min
. (A.6)
The vector c
min
is insensitive to the probability of alleles AIS, provided this
probability is equal for all populations in M. This holds true for probabilities of
alleles AIS in general. If estimates of f
ij
are made, a correction will take
place for the probabilities of alleles being alike in state at different loci.
However, there will inherently be some probability of alleles AIS left because
we implicitly assume a founder population, where the relations among animals
and inbreeding are zero. The above shows that the choice of the founder
population will not affect the contributions of populations to the core set.
APPENDIX B
This appendix prooves that negative contributions of breeds to the core
set occur when the kinship within a set of populations is smaller than the
kinship between the set and another breed. The latter may occur as a result
of estimation errors on the kinship estimates, but also the real kinships may
show this phenomenon. An example of the latter is a large population of half
sibs which has a within population kinship of approximately 0.125 while the
kinship of t he half sib family with its common sire is 0.25.
For a MEK matrix M the contribution vector c
min
that minimises the average
kinship in a set of N populations is:
c
min
=
M
−1
1
n
1
n
M
−1
1
n
where 1
n
is a vector whose N elements equal one.
632 H. Eding et al.
Suppose population P has a negative contribution. The inverse of M matrix
may be partitioned as:
M
−1
=
.
.
.
M
11
.
.
. M
1P
··· ···
.
.
. ···
M
P1
.
.
. M
PP
−1
=
.
.
.
.
.
.
··· ···
.
.
. ···
−Q
−1
M
−1
P1
M
−1
11
.
.
. Q
−1
and
Q
−1
= M
PP
− M
P1
M
−1
11
M
1P
where M
11
is the (N−1)×(N−1) partition of matrix of M in which population P
is excluded. M
1P
is a vector containing the MEKs between P and all other
populations. M
PP
is the within population kinship estimate of P.
The contribution of P follows from formula (5) in the main text. The
contribution of population P is negative, when the Pth element of M
−1
1 < 0.
M
−1
1
P
=−Q
−1
M
P1
M
−1
11
1 + Q
−1
1
= Q
−1
1 − M
P1
M
−1
11
1
= Q
−1
1 − M
P1
·
M
−1
11
1
1
M
−1
11
1
· 1
M
−1
11
1
= Q
−1
1 −
M
P1
c
min,11
f
min,11
where c
min,11
=
M
−1
11
1
n
1
n
M
−1
11
1
n
is the optimum contributions vector of populations
1to(N − 1) to their core set (A) and f
min,11
=
1
1
M
−1
11
1
is the average kinship
within the core set A.
From this we see that the contribution of population P is smaller than zero if
Q
−1
< 0orM
P1
c
min,11
> f
min,11
where Q
−1
is a diagonal element of M
−1
.SinceM is a relationship matrix and
therefore a variance/covariance matrix, M must be positive definite. Q
−1
< 0
Assessing genetic diversity 633
indicates that M is not positive definite and thus not a proper relationship
matrix, probably due to sampling errors on the MEKs.
The scalar f
min,11
is the average minimal kinship within core set A, composed
of all populations except population P. M
P1
c
min,11
is the minimal average
kinship between population P and the composite population A. A negative
contribution therefore occurs when the kinship between populations P and A
is greater than the kinship within population A. As mentioned above, this may
occur in practice, as for example in the case of the half sib family, but it is more
likely to be due to sampling errors.
To access this journal online:
www.edpsciences.org