Báo cáo sinh học: "Estimation of genetic variability and selection response for clutch length in dwarf brown-egg layers carrying or not the naked neck gene" pdf
Bạn đang xem bản rút gọn của tài liệu. Xem và tải ngay bản đầy đủ của tài liệu tại đây (375.29 KB, 20 trang )
Genet. Sel. Evol. 35 (2003) 219–238 219
© INRA, EDP Sciences, 2003
DOI: 10.1051/gse:2003005
Original article
Estimation of genetic variability
and selection response for clutch length
in dwarf brown-egg layers carrying
or not the naked neck gene
Chih-Feng C
HEN
a, b
, Michèle T
IXIER
-B
OICHARD
a∗
a
Laboratoire de génétique factorielle, Département de génétique animale,
Institut national de la recherche agronomique, 78352 Jouy-en-Josas Cedex, France
b
Department of Animal Science, National Chung-Hsing University,
Taichung, Taiwan
(Received 13 May 2002; accepted 12 August 2002)
Abstract – In order to investigate the possibility of using the dwarf gene for egg production,
two dwarf brown-egg laying lines were selected for 16 generations on average clutch length; one
line (L1) was normally feathered and the other (L2) was homozygous for the naked neck gene
NA. A control line from the same base population, dwarf and segregating for the NA gene, was
maintained during the selection experiment under random mating. The average clutch length
was normalized using a Box-Cox transformation. Genetic variability and selection response
were estimated either with the mixed model methodology, or with the classical methods for
calculating genetic gain, as the deviation from the control line, and the realized heritability, as
the ratio of the selection response on cumulative selection differentials. Heritability of average
clutch length was estimated to be 0.42 ± 0.02, with a multiple trait animal model, whereas
the estimates of the realized heritability were lower, being 0.28 and 0.22 in lines L1 and L2,
respectively. REML estimates of heritability were found to decline with generations of selection,
suggesting a departure from the infinitesimal model, either because a limited number of genes
was involved, or their frequencies were changed. The yearly genetic gains in average clutch
length, after normalization, were estimated to be 0.37 ± 0.02 and 0.33 ± 0.04 with the classical
methods, 0.46 ± 0.02 and 0.43 ± 0.01 with animal model methodology, for lines L1 and L2
respectively, which represented about 30% of the genetic standard deviation on the transformed
scale. Selection response appeared to be faster in line L2, homozygous for the NA gene, but the
final cumulated selection response for clutch length was not different between the L1 and L2
lines at generation 16.
dwarf chicken / naked neck gene / clutch length / genetic variability / selection response
∗
Correspondence and reprints
E-mail:
220 C F. Chen, M. Tixier-Boichard
1. INTRODUCTION
The sex-linked dwarf gene, DW, has been described for many years [19] and
is known to improve food efficiency and egg production in dam lines used for
broiler production, as reviewed by Mérat [24]. But in egg-laying strains, the
DW gene has been shown to decrease egg production [6], and more particularly
clutch length [1]. The clutch length is the number of eggs laid on consecutive
days, which is one of the important components of the total number of eggs
laid along a production cycle. Clutch length is inversely related to the interval
between ovipositions, a trait that has been shown to be highly heritable [21,23,
45] and to be increased by about two hours by the DW gene [43]. Consequently,
selection for clutch length can be proposed as a specific approach for improving
egg production of dwarf layers. In previous studies, clutch length has been
shown to be moderately to highly heritable, with a high genetic correlation
with egg number [4, 22, 39]. Furthermore, the association of the naked neck
gene, NA, with the DW gene, was previously found to have a favorable effect
on egg weight and food efficiency [10]. Thus, a selection experiment was
initiated in 1985, with the aim to improve clutch length in two lines of dwarf
brown-egg layers, differing by their genotype for the NA gene. In addition to
the investigation of the genetic variability of clutch length in dwarf layers, this
experiment also made it possible to examine the effect of the combination of
two major genes, DW and NA, on selection response.
The aim of the present study was to estimate heritability and direct selection
response for average clutch length, after 16 generations of selection of dwarf
brown-egg layers. The mixed model methodology was chosen because of
its theoretical advantages for the estimation of genetic parameters in selected
populations [5, 7, 27–30, 35, 37,41]. The estimates were compared to the results
obtained with the classical methods of calculating the deviation from the control
line, and estimating the realized heritability as the ratio of selection response
to selection differentials [18].
2. MATERIALS AND METHODS
2.1. Animals and housing
The selection experiment in one direction has been conducted at Inra in
Jouy-en-Josas since 1985, starting from a sex-linked dwarf base population
(= generation 0), with 99 dams and 23 sires hatched in 1983. This population
originated in 1982 from a cross between light and heavy dwarf lines, where
the NA gene had been introduced in 1981. From the first generation, birds
were separated, according to their genotype for the NA gene, into three lines:
two selected lines, and one control line. The L1 selected line was normally
feathered, homozygous for the non-naked neck allele (NA*N), the L2 line
Selection on clutch length in layers 221
was homozygous for the naked neck allele (NA*NA), and control line C was
segregating for the three possible genotypes at the NA locus. Because the base
population exhibited a large variability and a high mean value for body weight,
it appeared necessary to decrease body weight in lines L1 and L2. The females
of the first two generations were selected on an index incorporating body
weight, with a negative coefficient, egg weight and average clutch length, with
positive coefficients, determined according to the expected genetic gains [42],
and males were selected on individual body weight within each sire family.
The average clutch length was calculated as the arithmetic mean of all clutches
recorded, from the first egg until 42 weeks of age. From generation 2 on,
selection was done solely on average clutch length. The females were selected
on a within-sire basis, combining the individual value and the full-sib mean,
assuming heritability value of 0.4 in both lines. Selection of males combined
the within-sire full-sister mean and the deviation of the sire family mean from
the general mean. The lines were reproduced with a 1-year generation interval.
For each selected line, on average, 10 sires were selected each year out of 59
candidates, and 49 dams were selected out of 169 candidates until generation
16. For the control line, on average, 11 sires out of 46 males and 55 dams out
of 159 females per generation were randomly selected, as far as performance
was concerned, but the genotype at the NA locus was taken into account so
as to maintain a 50% frequency of the mutant NA*NA allele. After pooling
the three lines, the data set included a total of 10 595 birds consisting of 2616
male and 7979 female chickens. They were produced from 518 sires and 2609
dams. The performances of the 122 founder animals were not included.
Each year, the chicks of the three lines were hatched in 1 to 3 batches, 2 or
3 weeks apart, and were reared on the floor with a 10L/14D cycle. The sexes
were separated and the lines were intermingled. They were vaccinated against
the major poultry infectious diseases. Between 16 and 17 weeks of age, the
pullets were moved into individual cages with a 3-tier system. The light cycle
in the laying house was set to 16L/8D from the day of housing on. The layer
mash containing 2600 kcal · kg
−1
and 15.5% crude protein was distributed ad
libitum. Ambient temperature was held constant at 23
◦
C, in order to avoid
an interaction between the lines and the environment that could be due to the
NA*NA allele in the case of fluctuating temperatures. Egg production was
recorded daily for each hen, including the date of lay and the status for each
egg (normal, broken, soft-shelled, double-yolked).
2.2. Statistical analysis
2.2.1. Data distribution and transformation
The data of average clutch length was checked for skewness and kurtosis
with the UNIVARIATE procedure of SAS
®
[33]. In order to satisfy the classical
222 C F. Chen, M. Tixier-Boichard
hypothesis for describing traits with a polygenic inheritance via a linear model
with a normal error, a power transformation was used [11]. The transformation
form is as follows:
g
t
(x) =
x
t
− 1
t × ˙y
(t−1)
if t = 0
= log(x) if t = 0
where ˙y is the geometric mean of the y’s. This transformation relies on a
single parameter t, empirically chosen to simultaneously fulfill several desirable
criteria, as proposed by Ibe and Hill [20] and Besbes et al. [8].
2.2.2. Phenotypic trends, line effects and the effect of the genotype
at the
NA
locus
The phenotypic variability and yearly trend of clutch length were compared
among the three lines. The contrast between the lines was estimated for each
year with Model I, whereas the effect of the genotype at the NA locus was
estimated in the control line only with Model II, using the General Linear
Models (GLM) procedure [32]:
Model I: Y
ijkl
= µ + (year × h)
ij
+ (year × l)
ik
+ e
ijkl
Model II: Y
ijkl
= µ + (year × h)
ij
+ G
k
+ e
ijkl
where Y
ijkl
= the individual observation for clutch length, µ = the overall
mean, (year × h)
ij
= the fixed effect of the jth hatch within the ith year,
(year × L)
ik
= the fixed effect of the kth line within the ith year, G
k
= the fixed
effect of the genotype at the NA locus within the control line, and e
ijkl
= the
random error.
Only generations 6, 8, and 10 to 16, of the control line were considered for
model II, because the other generations exhibited either very few birds, or no
bird, of each homozygous genotype at the NA locus.
2.2.3. Coefficient of inbreeding
In the first generation, the coefficient of inbreeding was assumed to be 0,
then individual inbreeding coefficients were computed by using the PEDIG
package [9]. The program used the method described by Meuwissen and
Luo [26], which was a modification of the method of Quaas [31].
2.2.4. Estimated heritability of clutch length
Variance and covariance components were estimated using the derivative-
free multiple trait restricted maximum likelihood (REML) procedure with the
Selection on clutch length in layers 223
VCE package of Groeneveld [16]. The three linear models considered in this
study were (A) an animal model, (B) an animal model with a fixed effect for
the genotype at the NA locus, (C) an animal model with a random permanent
maternal environmental effect, and written as:
Model A: Y
ijl
= µ + (year × h)
ij
+ a
l
+ e
ijl
Model B: Y
ijkl
= µ + (year × h)
ij
+ G
k
+ a
l
+ e
ijkl
Model C: Y
ijkl
= µ + (year × h)
ij
+ d
ijk
+ a
l
+ e
ijkl
The notations for fixed effects were the same as in 2.2.2, with the addition of
a
l
= the random animal effect (l = 1 to m, m = the total number of records),
d
ijk
a random effect common to all the progeny of dam k, and e
ijl
= the random
error. The expectation and variance of the vector of performance, y, were
distributed as follows, in a matrix notation:
E
y
a
d
e
=
Xβ
0
0
0
and V
a
d
e
=
A ⊗ G 0 0
0 I
Nd
⊗ D 0
0 0 ⊕
m
l=1
R
l
,
where y is the observed performance, a is the individual additive genetic value,
d is the random permanent maternal environmental effect (Model C), e is the
residual, β is either the vector of the year-hatch fixed effect (Model A, C) or is
the vector of the year-hatch and genotype (NA gene) fixed effects (Model B);
and X its incidence matrix, A is the numerator relationship matrix, G is the
variance-covariance matrix for the animal additive genetic effect, I
Nd
is the
identity matrix of dimension Nd (number of dams), D is the variance-covariance
matrix for the maternal environmental effect d (Model C), R
l
is the residual
variance-covariance matrix for the animal l. The direct product and direct sum
of matrices are indicated by ⊗ and ⊕, respectively.
In order to take into account the effect of selection done on other traits
at the beginning of this selection experiment, the four traits, clutch length,
egg number, adult body weight and egg weight at 29 weeks were involved
simultaneously in each analysis.
All the data were analyzed with model A, B and C to estimate genetic
parameters in the base population. Moreover, we also analyzed each line as
a separate data set, using Model A in the two selected lines (no NA genotype
effect), and using Model B in the control line (with the NA genotype effect).
The stability of the heritability estimates was analyzed by increasing the
number of generations successively taken into account in nine different subsets
of the whole data set. Pedigree information back to generation 0 was included
in the analysis to connect the three lines. The consequence of omitting per-
formance data from earlier generations was investigated by analyzing three
224 C F. Chen, M. Tixier-Boichard
different subsets of data, namely generations G5–G8, G9–G12 and G13–G16,
with the same model as previously described for the three lines, including
pedigree information back to generation 0.
In order to monitor the change in genetic variance along selection, another
group of data sets was defined by excluding the data successively from genera-
tion 0 until generation 12 by 4 generations, ignoring back pedigree information.
Model A was applied to the “descending” analysis of the two selected lines.
Model B was applied to the analysis of the control line.
2.2.5. Genetic gain
Method I. Least Squares Methodology: The selection response in each line
was estimated by the deviation from the control line, taking into account the
initial difference at generation 1. The cumulated selection response (CSR) at
generation n was calculated by:
CSR = (S
n
− C
n
) − (S
1
− C
1
)
where S
n
and C
n
were least square means of Model I for average clutch
length (transformed value) at generation n in the selection line and control
line, respectively.
Method II. Individual Animal Model: Estimated breeding values (EBV)
were estimated by the best linear unbiased prediction (BLUP) using a mixed
linear model, to evaluate genetic gain using the PEST package [17]. For this
evaluation, variance components obtained from the REML analysis done with
model A on the entire data set were used. Estimated breeding values were
averaged per line and generation. Concomitantly, the individual inbreeding
coefficient was used as a covariable, with the following model:
Model D: Y
ijkl
= µ + bI + (year × h)
ij
+ G
k
+ a
l
+ e
ijkl
where Y
ijkl
= individual observation, µ = the overall mean, b = the regression
coefficient, I = the individual inbreeding coefficient, (year × h)
ij
= the fixed
effect of the jth hatch within the ith year, G
k
= the fixed effect of the genotype
at the NA locus, a
l
= the random animal effect and e
ijkl
= the random error.
2.2.6. Realized heritability
To enable the calculation of realized heritability, the actual selection dif-
ferential for dams was calculated, at each generation, by the within-line
difference between the average clutch length (transformed value) of selected
birds, weighted by the number of dam’s progeny, and the mean average clutch
length (transformed value) of the population. For sires, without individual
phenotypic observations, the selection differential was approximated by the
Selection on clutch length in layers 225
difference between the mean record (transformed value) of full-sisters of
each sire, weighted by the number of the sire’s progeny, and the generation
mean (transformed value). The cumulated selection differential (CSD), on the
transformed scale, was then calculated as:
CSD =
16
n=1
SDs
n
× is
n
+ SDd
n
× id
n
is
n
+ id
n
where SDs
n
and SDd
n
are the weighted selection differentials of sires and dams
in generation n, is
n
and id
n
are the selection intensity of the sires and dams in
generation n.
3. RESULTS
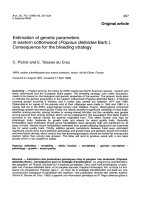
3.1. Data distribution and transformation
Figure 1 shows the data distribution of average clutch length before and
after transformation. The average clutch length was modified by a Box-Cox
power transformation to reduce non-normality and curvilinearity of heritability.
The transformation parameter (t) was −0.247, and the skewness and kurtosis
after transformation were 0.228 and −0.014 respectively.
0
5
10
15
20
25
0 1 2 3 4 5 6 7 8 9 10 11 12 13 14 15 16 17 18 19 20 21 22 23 24 25 26
%
Figure 1. The distribution of average clutch length before/after the Box-Cox trans-
formation.
226 C F. Chen, M. Tixier-Boichard
Table I. Number of recorded hens per generation in each genotype (normal =
NA*N/NA*N, heterozygous = NA*N/NA*NA, naked neck = NA*NA/NA*NA).
Generations Control line L1 L2 Total
(normal) (naked neck)
normal heterozygous naked
neck
G0 Male = 23 Female = 99 (heterozygous) 122
G1 – 163 – 136 151 450
G2 16 136 19 157 161 489
G3 18 145 15 187 179 544
G4 – 174 – 189 179 542
G5 – 136 – 215 195 546
G6 58 63 67 185 179 552
G7 2 135 7 140 171 455
G8 30 50 22 109 149 360
G9 1 86 – 176 214 477
G10 31 67 35 171 156 460
G11 67 67 67 181 176 558
G12 49 92 35 160 162 498
G13 49 73 59 177 194 552
G14 47 79 45 200 191 562
G15 48 73 59 171 203 554
G16 53 64 54 102 107 380
3.2. Phenotypic trends, line effects, and effect of the NA gene
The number of hens with a record in each genotype per generation is presen-
ted in Table I for the 16 generations. Figure 2 shows the yearly phenotypic
means in each line for average clutch length. The normally feathered line (L1)
and the naked neck line (L2) differed significantly from the control line (C)
starting at G5 and G4, respectively. Between the two selected lines, the mean
of line L2 was significantly higher than the mean of line L1 beginning at G5 and
until G13, but in the last three generations, lines L1 and L2 means did not differ
significantly any more. In G12, an acute failure in water distribution affected
the mean performance much more severely for line L2 than for line L1, and
more severely for both selected lines than for the control line. The selection
response was maintained, however, in G13, but the differences between lines L1
and L2 disappeared.
Within the control line, the least squares means for average clutch length
was estimated to be 3.09, 3.28 and 3.34 for NA*N/NA*N, NA*NA/NA*N and
Selection on clutch length in layers 227
0
2
4
6
8
10
12
14
16
0 1 2 3 4 5 6 7 8 9 10 11 12 13 14 15 16
Generations
Figure 2. The phenotypic means in each line per generation for average clutch length.
L1 line: selected and normally feathered; L2 line: selected line and naked neck line;
control line: unselected and segregating for the naked neck gene.
NA*NA/NA*NA genotypes, respectively. The normally feathered genotype
showed a significantly shorter clutch length than either the heterozygous or the
homozygous carrier of the naked neck mutation.
3.3. Inbreeding level
After 16 generations, the cumulated inbreeding level was the lowest in the
control (C) (11.1%), and showed very similar values in the normally feathered
line (L1) and the naked neck line (L2) with 18.0% and 18.4%, respectively.
The average increment of the percent inbreeding coefficient per generation was
0.74%, 1.20% and 1.23% in line C, line L1 and line L2, respectively. A 10%
increase of inbreeding reduced the clutch length on the transformed scale by
1.16 (L1), 1.19 (L2) and 0.29 (C), according to the result of model D where
the inbreeding coefficient was included as a covariable.
3.4. The estimated heritability of clutch length
The heritability of the average clutch length was estimated to be 0.42 ± 0.02
with a multiple trait animal model using the data on all the lines over 16
generations. The heritabilities estimated separately for each line were 0.41 ±
0.03, 0.36 ± 0.03 and 0.58 ± 0.02 in the normally feathered line (L1), the
naked neck line (L2) and control line (C) respectively. When the analysis was
run on an increasing number of generations, starting from G0, the estimated
228 C F. Chen, M. Tixier-Boichard
Table II. Estimated heritabilities of average clutch length according to three models
with increasing numbers of generations.
Generation Model A Model C No. records
h
2
SE σ
2
G
h
2
SE σ
2
G
G0–G1 0.510 0.065 2.042 0.523 0.096 2.053 450
G0–G2 0.517 0.030 2.037 0.652 0.054 2.876 939
G0–G4 0.555 0.024 2.248 0.498 0.048 2.007 2025
G0–G6 0.573 0.023 2.481 0.484 0.040 1.990 3123
G0–G8 0.541 0.020 2.529 0.390 0.032 1.660 3938
G0–G10 0.519 0.021 2.467 0.403 0.029 1.772 4875
G0–G12 0.481 0.014 2.397 0.370 0.021 1.667 5931
G0–G14 0.457 0.018 2.361 0.324 0.029 1.494 7045
G0–G16 0.421 0.018 2.206 0.307 0.028 1.456 7979
Model A is a purely additive model. Model C allows for the dam’s environmental
effect.
heritability dropped from 0.57 to 0.42 in model A and model B, and dropped
from 0.65 to 0.31 in model C. Model A and model B yielded very similar
estimates. The estimates obtained with model A and model B were generally
higher than those obtained with model C, the difference represented 10% for
the G0–G4 data set, and 27% for the G0–G16 data set (Tab. II).
Table III shows estimates from the analyses of the partial data sets omitting
records from earlier generations, including or excluding pedigree information
back to generation 0. The heritability of the base population defined by
generation 0 decreased when considering only the data of later generations,
from 0.49 to 0.20 in line L1 and from 0.43 to 0.19 in line L2, by contrast,
it remained almost a constant in the control line, 0.56–0.57. In the analyses
ignoring back pedigree information, the reduction of genetic variance along
selection was obvious, when, for instance, the heritability values estimated in
G4, G8 and G12 were 0.37, 0.28 and 0.17 in line L1.
3.5. Genetic gain
The linear regression of the deviations from the control line on the phenotypic
scale showed a yearly increase in average clutch length of 0.65 ± 0.08 (R
2
=
0.82) and 0.65 ± 0.06 (R
2
= 0.90) for the normally feathered line (L1) and
the naked neck line (L2), respectively. The results of BLUP evaluation, using
a heritability of 0.42, may be compared with the genetic trends estimated
by deviation from the control line, only after Box-Cox transformation of the
average clutch length (Fig. 3). On the transformed scale, the linear regression of
Selection on clutch length in layers 229
Table III. Effect of omitting either (1) performance data or (2) pedigree and perform-
ance data from earlier generations, on heritability estimates (line L1, L2 with Model A,
control line with Model B), and on realized heritability (lines L1 and L2 only).
Data set Base Line L1 Line L2 Control line
Generations Population h
2
± SE h
2
r
h
2
± SE h
2
r
h
2
± SE
(1) G16–G5 G0 0.49 ± 0.056 – 0.43 ± 0.039 – 0.56 ± 0.040
G16–G9 G0 0.42 ± 0.034 – 0.37 ± 0.045 – 0.57 ± 0.042
G16–G13 G0 0.20 ± 0.045 – 0.19 ± 0.046 – 0.57 ± 0.056
(2) G5–G8 G4 0.37 ± 0.033 0.18 0.34 ± 0.027 0.22 0.55 ± 0.026
G9–G12 G8 0.28 ± 0.027 0.19 0.31 ± 0.065 0 0.55 ± 0.035
G13–G16 G12 0.17 ± 0.042 0.18 0.16 ± 0.044 0.14 0.51 ± 0.050
L1 line: selected and normally feathered; L2 line: selected and naked neck; control
line: unselected and segregating for the naked neck gene.
- 2
- 1
0
1
2
3
4
5
6
7
8
0 1 2 3 4 5 6 7 8 9 1 0 1 1 1 2 1 3 1 4 1 5 1 6
Generations
Figure 3. The genetic gains in classic and animal model methodology for transformed
clutch length.
genetic gains estimated by the deviations from the control line was 0.37 ± 0.02
(R
2
= 0.94) and 0.33±0.04 (R
2
= 0.85) for lines L1 and L2, respectively. The
estimated breeding values with the animal model followed a yearly increase of
0.46 ± 0.02 (R
2
= 0.98) and 0.43 ± 0.01 (R
2
= 0.98), for lines L1 and L2,
respectively, which represented a yearly gain of about 30% of the genetic
standard deviation.
230 C F. Chen, M. Tixier-Boichard
The selection response estimated from the classical method was more
fluctuating than the response obtained from the mixed model methodology.
The least-squares estimator used only the records from one generation at a
time, whereas, the mixed model methodology used information from more
generations. Consequently, the curve of the genetic trend was smoother when
averaging EBV, as found by Pinard et al. [30] and Meyer [25].
3.6. Realized heritability
The cumulated selection differential and intensity of selection are given
in Table IV. The selection differentials for the normally feathered line (L1)
were constantly lower than that of the naked neck line (L2), and the average
selection differentials per generation in lines L1 and L2 were 1.44 and 1.74 on
the transformed scale, respectively. The cumulative selection response (CSR)
for line L2 increased faster than for line L1 until generation 11, by contrast,
the CSR for line L1 increased faster than for line L2 after generation 11 and
was even larger than for line L2 at the last generation. Consequently the
realized heritability was higher in line L1, being 0.28, than in line L2, being
0.22. When calculated over the periods G5–G8, G9–G12, and G13–G16, the
realized heritability appeared rather constant in line L1, but fluctuated more in
line L2 (Tab. III).
4. DISCUSSION
4.1. Data distribution and transformation
The distribution of clutch length was nearly a Poisson distribution. Ayorinde
and Olagbuyiro [2] also reported that clutch size varied from 1 to 12 eggs,
and the highest frequency was 72.3% for a 1–3 egg clutch. The Box-Cox
transformation of egg production traits resulted in increases in estimated her-
itability, which were reported by Ibe and Hill [20], Besbes et al. [7] and
Chapuis et al. [13]. In the present study, the estimated heritability values were
0.15 ± 0.01 and 0.42 ± 0.02 for un-transformed and transformed variables,
respectively. However, the data distributions over generations were dynamic, so
that the skewness and kurtosis changed along generations as a result of selection.
Figure 4 shows the distribution of clutch length for the two selected lines in
three periods, each of them representing five generations. The skewness and
kurtosis were increasing in last generations because of the occurrence of hens
showing extremely high values. The optimal transformation parameter t, to
fulfill the same normality condition, was not a constant over time. Nevertheless,
Banks et al. [3] reported that REML is robust and they verified this robustness
even for slight skewness. Therefore, in the present analysis, in order to avoid
the scale diversity due to different transformation parameters, we used the same
Selection on clutch length in layers 231
Table IV. Intensity of selection (i), cumulative selection responses (CSR), cumulative
selection differentials (CSD), and realized heritability for transformed clutch length
per generation.
Generation,
n
Line L1 Line L2
i/sire i/dam CSR CSD h
2
r
i/sire i/dam CSR CSD h
2
r
1 0.65 1.03 – 0.85 – 0.16 0.89 – 1.01 –
2 1.27 1.02 0.43 0.87 – 1.29 1.02 1.01 1.37 –
3 1.31 1.12 1.18 2.11 0.78 1.37 1.12 1.41 2.70 0.57
4 1.26 1.16 1.65 3.76 0.63 1.32 1.23 1.54 4.81 0.63
5 1.32 1.20 2.36 5.42 0.54 1.31 1.24 3.02 6.96 0.54
6 1.23 1.17 2.93 7.37 0.48 1.17 1.17 3.75 8.84 0.47
7 1.28 1.12 3.53 8.55 0.38 1.20 1.02 4.18 10.48 0.40
8 1.23 1.05 3.22 10.13 0.31 1.06 0.79 4.24 11.77 0.36
9 1.30 1.31 3.09 11.65 0.33 1.27 1.15 4.18 13.44 0.33
10 1.22 1.17 3.87 13.10 0.30 1.18 1.22 4.43 15.40 0.33
11 1.19 1.00 3.99 14.80 0.25 1.27 1.25 5.07 17.46 0.24
12 1.48 1.20 3.64 16.45 0.32 1.36 1.30 4.11 20.13 0.24
13 1.29 1.28 5.22 18.20 0.29 1.14 1.20 4.90 22.37 0.23
14 1.27 1.37 5.20 19.92 0.29 1.12 1.27 5.08 23.92 0.22
15 1.38 1.19 5.83 21.65 0.28 1.27 1.29 5.26 26.04 0.22
16 1.03 0.86 6.15 – – 0.89 0.89 5.72 – –
L1 line: selected and normally feathered; L2 line: selected and naked neck.
h
2
=
CSR
n+1
CSD
n
·
parameter for all the analyses, and checked that normality was satisfied for the
base population.
The distribution of average clutch length may depart from normality for
different reasons. First, lower values are truncated towards 1, whereas there is
no limit for high values. As a physiological consequence, indeed, clutch length
tends towards infinity when the time interval between the ovipositions tends
towards 24 h. Second, the observed distribution might contain a mixture of
distributions due to the possible segregation of an unknown mutation, picked
up by selection. Tixier-Boichard et al. [40] found a mixture of two non-normal
distributions in line L2 at the 10th generation, one of which consisted in 4%
of the animals, with a mean value at three standard deviations above the mean
of the main distribution. In the future, it would be necessary to analyze the
232 C F. Chen, M. Tixier-Boichard
0
5
10
15
20
25
30
35
40
0 5 10 15 20 25 30
%
G1-G5 G6-G10 G11-G16
0
5
10
15
20
25
30
35
0 5 10 15 20 25 30
%
G1-G5 G6-G10 G11-G16
Figure 4. The clutch length distribution (%) for two selected lines over three periods
of five generations each.
heterogeneity of sire family variances in order to test the hypothesis of a major
gene affecting clutch length.
Selection on clutch length in layers 233
4.2. Phenotypic trends, selection response,
and the effect of the NA gene
Selection for average clutch length in the dwarf laying hens achieved signi-
ficant progress. At generation 16, the average clutch length was 15.16, 14.87
and 3.63 for the normally feathered line (L1), the naked neck line (L2) and
control line (C), respectively. The two selected lines showed a similar selection
response in the last generations. We suggest that the selected lines have reached
an optimum performance level from the viewpoint of the oviposition pattern.
In a previous study [38], at generation 1, 5 and 10, the time of lay was recorded
manually on an hourly basis, and the results showed a significant reduction of
the interval between the ovipositions from 27 h to 24.5 h. At the 16th generation,
the time interval between the ovipositions was 24.7, 24.3 and 26.8 h in lines L1,
L2 and the control, respectively (unpublished data). The decrease in the time
interval between the ovipositions approached the 24 h limit fixed by the light-
dark cycle. In another experiment [44], oviposition times were recorded under
a normal light-dark cycle for a commercial White Leghorn strain. The distribu-
tion statistics of oviposition intervals clearly showed the physiological barrier
in egg production imposed by a 24 h-cycle. Mean oviposition intervals ranged
from 24.1 to 26.3. In the same 24 h light-dark cycle condition, McClung [23]
selected single comb White Leghorns for a shorter intra-clutch interval between
ovipositions: the average time interval between the ovipositions significantly
decreased from 25.6 to 24.38 h after seven generations, and the clutch length
increased significantly from 5.1 to 12.8 days, but at the last two generations the
average clutch length remained the same, 12.8 days. The selection would be
expected to become less effective with increasing generations, unless the light-
dark cycle is changed. Lillpers and Wilhelmson [21] compared three selected
lines, and suggested the oviposition pattern was a good criterion for improved
egg production, because of the higher heritability and genetic correlation with
egg production. In the present work, clutch length was inversely related to
the interval between the ovipositions, and its measurement was easier than
monitoring the oviposition time everyday, although it may have been influenced
by false recording due to atypical very short sequences and internal ovulations.
During the course of selection, a higher selection response for line L2 took
place in the first generations, whereas inversely, a higher selection response
took place in the last generations for line L1. This difference could be due
either to an effect of random drift, or to a change in selection intensity, or to
an effect of the NA gene, or to a genotype × environment interaction. Tixier-
Boichard et al. [40] compared the selection response achieved in L1 and L2
lines at generation 10, taking into account an approximate drift variance, and the
result showed a significant difference in genetic trends between the lines. The
negative effect associated with the non naked neck genotype within the control
line could suggest that L1 started with an initial “handicap”. After pooling the
234 C F. Chen, M. Tixier-Boichard
data of G6, G8 and G10 to G16 of the control line, the analysis showed a positive
effect of the NA gene on the mean and on the coefficient of variation of the
clutch length with 3.09, 3.28, 3.34 and 35.0%, 41.2%, 42.8%, for NA*N/NA*N,
NA*NA/NA*N and NA*NA/NA*NA genotypes, respectively. On the contrary,
the NA gene did not significantly affect the clutch length according to the PEST
analysis, which was performed on the transformed value of the clutch length.
This suggests that the main effect of the NA gene on clutch length would be an
increased variability due to an increased proportion of animals with extreme
values. This effect disappeared after normalization of the distribution of clutch
length. Indeed, phenotypic variability was larger in line L2 and higher selection
differentials could be achieved. However, a higher selection intensity was
observed in males in L1 as compared to L2, starting from G12 (Tab. II). Further-
more, a genotype × environment interaction, took place in the selection history
of lines L1 and L2, when a difference was found between the two selected lines
regarding the ALV infection, with a higher incidence in line L1 between G4 and
G7. ALV infection is known to decrease egg production [15]. The difference in
ALV infection between the L1 and L2 lines could not be explained by a direct
effect of the NA gene on susceptibility to leucosis, because no difference was
found between the genotypes at the NA locus within the control line, following
a challenge with the Rous sarcoma virus [36]. It was concluded that the higher
incidence of ALV infection in line L1 was a random phenomenon.
4.3. Inbreeding level
Although inbreeding tended to reduce the average clutch length, the inbreed-
ing coefficient increased slowly in the selected lines. The rate of inbreeding
and its effect on average clutch length did not introduce a significant difference
between the two selected lines. In a study of inbreeding depression on pro-
duction traits of White Leghorns [34], inbreeding tended to reduce egg number
and delayed the age at first egg in all lines, but in a line selected on egg weight
out of three, a significant effect of inbreeding was also found on fertility and
hatchability.
4.4. Genetic parameters: REML estimates and realized heritability
Estimated heritability of clutch length was reported only in a few studies.
The estimated values ranged from 0.19±0.11 to 0.87±0.39 [22] and 0.15±0.05
to 0.34 ± 0.07 [4] and were obtained from the analysis of untransformed data.
Assuming an infinitesimal model [12], REML estimation of genetic variance
will account for the effects of selection on estimated parameters, such as genetic
drift, inbreeding and gametic disequilibrium. In the present work, all the
information was included, but the estimated heritabilities tended to decrease
during the course of the experiment (Tab. II), suggesting that the infinitesimal
Selection on clutch length in layers 235
model may not be appropriate. An explanation could be that changes of gene
frequencies may have occurred, and that the number of loci affecting clutch
length may be limited, with the possible segregation of a few genes with
large effects. Previous analyses of other selection experiments using mixed
model methodology [25,30] also observed changes in estimated heritability,
suggesting departure from the infinitesimal model assumption of unlinked
additive genes each of very small effect. Furthermore an analysis omitting data
from earlier generations and ignoring earlier pedigree information is expected to
give an estimate of the genetic variance in different generations. As expected,
the heritabilities were decreasing along selection, and genetic variance also
decreased slightly.
With the different models used to estimate genetic variance, the estimated
heritability values were nearly the same for either model A or model B. This
suggested that the genotype at the NA locus could be neglected in this analysis.
Model C was aimed at estimating the influence of maternal and/or dominance
effects. Significant common environmental variance was observed only from
the 4th to 8th generations, with a small value. This suggests that common
environmental variance had a small effect in this analysis.
The realized heritability decreased over generations (Tab. IV), particularly,
the h
2
r
values were constantly lower than the REML estimate after the 6th
generation (h
2
r
< 0.42). One of the reasons, the same as above, was the
occurrence of gametic disequilibrium due to a change of genetic variance with
the gene frequencies changing in response to selection. Realized heritability
underestimated the heritability in the base population as described by Falconer
and Mackay [14]. Yet, the realized heritability calculated over the last period,
G13–G16, was very similar to the REML estimate obtained for the same period
when considering G12 as the base population, both for lines L1 and L2.
5. CONCLUSION
In conclusion, our results indicate that average clutch length is effectively
improved by selection in dwarf laying hens. The dwarf laying hens carrying
or not the naked neck gene showed a similar selection response in the last
generations, but a positive effect of the NA gene was observed within the
control line as well as on initial response to selection. Regarding genetic
variance, the time trend in REML estimates, starting from G0, suggested a
departure from the hypothesis of an infinitestimal model. The results from
this study indicate that selection for average clutch length has reduced the
genetic variance over the generations. Further investigations will involve the
estimation of correlated selection responses on the other egg production traits,
which may indicate (un)favorable effects associated with an increased clutch
length.
236 C F. Chen, M. Tixier-Boichard
ACKNOWLEDGEMENTS
The technical help of the staff of the animal caretakers all along the selection
experiment is gratefully acknowledged. The authors are grateful to Mrs.
Boitard, a computer engineer for programming the data recording and clutch
length computing. We are grateful to Dr. D. Boichard and Dr. E. Groeneveld
for helpful advice in using VCE, PEST and PEDIG softwares. C.F. Chen was
supported by a Ph.D. scholarship from Inra.
REFERENCES
[1] Amin-Bakhche M., Mérat P., Study of a sex linked dwarfing gene in the fowl:
oviposition and characteristics of the successive eggs in laying sequences, Ann.
Génét. Sél. Anim. 7 (1975) 13–22.
[2] Ayorinde K.L., Olagbuyiro B., The influence of clutch size and oviposition time
on egg weight and egg index in Hubbard layers, Bull. Anim. Health Prod. Afr.
39 (1991) 251–253 (abstract).
[3] Banks B.D., Mao I.L., Walter J.P., Robustness of the restricted maximum
likelihood estimator derived under normality as applied to data with skewed
distributions, J. Dairy Sci. 68 (1985) 1785–1792.
[4] Bednarczyk M., Kieclzewski K., Szwaczkowski T., Genetic parameters of the
traditional selection traits and some clutch traits in a commercial line of laying
hens, Arch. Geflügelkd. 64 (2000) 129–133.
[5] Beniwall B.K., Hastings I.M., Thompson R., Hill W.G., Estimation of changes in
genetic parameters in selected lines of mice using REML with an animal model.
1. Lean mass, Heredity 69 (1992) 352–360.
[6] Bernier P.E., Arscott G.H., Fifteen years of observations on the dwarf gene in the
domestic fowl, Ann. Génét. Sél. Anim. 4 (1972) 183–215.
[7] Besbes B., Ducrocq V., Foulley J.L., Protais M., Tavernier A., Tixier-Boichard
M., Beaumont C., Estimation of genetic parameters of egg production traits of
laying hens by restricted maximum likelihood applied to a multiple-trait reduced
animal model, Genet. Sel. Evol. 24 (1992) 539–552.
[8] Besbes B., Ducrocq V., Foulley J.L., Protais M., Tavernier A., Tixier-Boichard
M., Beaumont C., Box-Cox transformation of egg-production traits of laying
hens to improve genetic parameter estimation and breeding evaluation, Livest.
Prod. Sci. 33 (1993) 313–326.
[9] Boichard D., PEDIG: a fortran package for pedigree analysis suited for large
populations, in: Proc. 7th World Congr. Genet. Appl. Livest. Prod., Montpellier,
France, 19–23 August 2002, Département Génétique Animale, Inra, Castanet-
Tolosan, CD-ROM communication No. 28–13.
[10] Bordas A., Mérat P., Effect of the naked neck gene on traits associated with egg
laying in a dwarf stock at two temperatures, Br. Poult. Sci. 25 (1984) 195–207.
[11] Box G.E.P., Cox D.R., An analysis of transformations, J. Royal Stat. Soc., Series
B 26 (1964) 211–243.
[12] Bulmer M.G., The Mathematical Theory of Quantitative Genetics, Oxford,
Clarendon Press, 1980.
Selection on clutch length in layers 237
[13] Chapuis H., Tixier-Boichard M., Delabrosse Y., Ducrocq V., Multivariate restric-
ted maximum likelihood estimation of genetic parameters for production traits
in three selected turkey strains, Genet. Sel. Evol. 28 (1996) 299–317.
[14] Falconer D.S., MacKay T.F.C., Introduction to quantitative genetics, 4th edn.,
Longman Group Ltd, UK, 1996.
[15] Gavora J.S., Spencer J.L., Effects of lymphoid leukosis virus infection on
response to selection, 25th British Poultry Breeders Roundtable, Edinburgh,
1983, pp. 17–24.
[16] Groeneveld E., VCE4 User’s Manual, version 1.0, Institute of animal husbandry
and animal behavior, Neustadt, Germany, 1996.
[17] Groeneveld E., Computation of random and fixed effects in animal breeding
with the PEST package. EAAP satellite symposium, Ph.D. course, University of
Debrecen, Faculty of Agronomy, 30 August–5 September, 2001.
[18] Hill W.G., Estimation on realized heritabilities from selection experiments. II
Selection in one direction, Biometrics 28 (1972) 767–780.
[19] Hutt F. B., Sex linked dwarfism in the fowl, J. Hered. 50 (1959) 209–221.
[20] Ibe S.N., Hill W.G., Transformation of poultry egg production data to improve
normality, homoscedasticity and linearity of genotypic regression, J. Anim.
Breed. Genet. 105 (1988) 231–240.
[21] Lillpers K., Wilhelmson M., Genetic and phenotypic parameters for oviposition
pattern traits in three selection lines of laying hens, Br. Poult. Sci. 34 (1993)
297–308.
[22] Luc K.M., Miyoshi S., Suzuki M., Mitsumoto T., Heritability estimates of some
clutch traits in the laying hen, Jpn. Poult. Sci. 33 (1996) 23–28.
[23] McClung M.R., Albert B.S., Wang B.S., Jones W.T., Response to selection for
time interval between ovipositions in the hen, Poultry Sci. 55 (1976) 160–171.
[24] Mérat P., The sex-linked dwarf gene in the broiler chicken industry, World’s
Poultry Sci. J. 40 (1984) 10–18.
[25] Meyer K., Hill W.G., Mixed-model analysis of a selection experiment for food
intake in mice, Genet. Res. 57 (1991) 71–81.
[26] Meuwissen T.H.E., Luo Z., Computing inbreeding coefficients in large popula-
tions, Genet. Sel. Evol. 24 (1992) 305–313.
[27] Morris A.J., Pollott G.E., Comparison of selection based on phenotype, selection
index and best linear unbiased prediction using data from a closed broiler line,
Br. Poult. Sci. 38 (1997) 249–254.
[28] Ollivier L., On the use of animal models in the analysis of selection experiments,
Genet. Sel. Evol. 31 (1999) 135–148.
[29] Perez-Enciso M., Toro M., Classical and mixed model analysis of an index
selection experiment for fecundity in Drosophila melanogaster, J. Anim. Sci. 70
(1992) 2673–2681.
[30] Pinard M.H., van Arendonk J.A.M., Nieuwland M.G.B., van der Zijpp A.J.,
Divergent selection for immune responsiveness in chickens: estimation of real-
ized heritability with animal model, J. Anim. Sci. 70 (1992) 2986–2993.
[31] Quaas R.L., Computing the diagonal elements and inverse of a large numerator
relationship matrix, Biometrics 32 (1976) 949–953.
[32] SAS
®
, SAS/STAT User’s Guide, Version 6, 4th edn., Vol. 1, SAS
®
Institute Inc.,
Cary, NC, USA, 1995.
238 C F. Chen, M. Tixier-Boichard
[33] SAS
®
, SAS Procedure Guide, 3rd edn, SAS
®
Institute Inc., Cary, NC, USA,
1990.
[34] Sewalem A., Johansson K., Wilhelmson M., Lillpers K., Inbreeding and inbreed-
ing depression on reproduction and production traits of White Leghorn lines
selected for egg production traits, Br. Poult. Sci. 40 (1999) 203–208.
[35] Sorensen D.A., Kennedy B.W., Estimation of genetic variances from unselected
and selected populations, J. Anim. Sci. 59 (1984) 1213–1223.
[36] Tixier-Boichard M., Dambrine G., Durand L., Lasserre F., Mérat P., Avian
leukosis virus (ALV) infection in dwarf (dw) brown-egg layers selected for
clutch length, with or without the naked neck (Na) gene, in: World’s Poultry
Congress, Amsterdam, 20–24 September 1992, pp. 532–533.
[37] Tixier-Boichard M., Boichard D., Groeneveld E., Bordas A., Restricted max-
imum likelihood estimates of genetic parameters of adult male and female Rhode
Island Red chickens divergently selected for residual feed consumption, Poultry
Sci. 74 (1995) 1245–1252.
[38] Tixier-Boichard M., Balluais J., Boitard M., Oviposition pattern in dwarf lines
selected for clutch length, in: 2nd European Poultry Breeders Roundtable,
Foulum, 6–8 September 1995, Danish Institute of Animal Science, Tjele, 1996,
Report No. 73.
[39] Tixier-Boichard M., Planification et résultats d’une expérience de sélection con-
duite en générations séparées chez la poule pondeuse, in: Séminaire Planification
Expérimentale en Génétique Animale, Saint-Martin de Ré, 2–4 avril 1996, Inra,
pp. 135–144.
[40] Tixier-Boichard M., Boitard M., Coquerelle G., Mérat P., Genetic improvement
of clutch length in dwarf brown-egg layers: additional selection response with
the naked neck gene, in: World’s Poultry Congress, New Delhi, India, 2–5
September, Vol. 1, 1996, pp. 453–458.
[41] van der Werf J.H.J., de Boer I.H.M, Estimation of the additive genetic variance
when base populations are selected, J. Anim. Sci. 68 (1990) 3124–3132.
[42] Yamada Y., Yokouchi K., Nishida A., Selection index when genetic gains of
individual traits are of primary concern, Jpn. J. Genetics 50 (1975) 33–41.
[43] Yoo B.H., Sheldon B.L., Podger R.N., Increase in oviposition interval due to
the sex-linked dwarf gene in White Leghorns and Australorps, Br. Poult. Sci. 25
(1984) 119–126.
[44] Yoo B.H., Sheldon B.L., Podger R.N., Analysis of oviposition times and intervals
in a wide range of layer flocks under normal and continuous lighting regimes,
Br. Poult. Sci. 27 (1986) 267–288.
[45] Yoo B.H., Sheldon B.L., Podger R.N., Genetic parameters for oviposition time
and interval in a White Leghorn population of recent commercial origin, Br.
Poult. Sci. 29 (1988) 627–637.