Báo cáo sinh học: "The effect of using approximate gametic variance covariance matrices on marker assisted selection by BLUP" pdf
Bạn đang xem bản rút gọn của tài liệu. Xem và tải ngay bản đầy đủ của tài liệu tại đây (180.59 KB, 20 trang )
Genet. Sel. Evol. 36 (2004) 29–48 29
c
INRA, EDP Sciences, 2004
DOI: 10.1051/gse:2003049
Original article
The effect of using approximate gametic
variance covariance matrices on marker
assisted selection by BLUP
Liviu R. T
a∗
,RohanL.F
a, b
, Jack C.M. D
a, b
,
Soledad A. F
´
c
,BerntG
d
a
Department of Animal Science, Iowa State University, Ames, IA 50011, USA
b
Lawrence H. Baker Center for Bioinformatics and Biological Statistics, Iowa State
University, Ames, IA 50011, USA
c
Department of Statistics, The Ohio State University, Columbus, OH 43210, USA
d
Danish Institute of Animal Science, Foulum, Denmark
(Received 19 September 2002; accepted 13 May 2003)
Abstract – Under additive inheritance, the Henderson mixed model equations (HMME) pro-
vide an efficient approach to obtaining genetic evaluations by marker assisted best linear un-
biased prediction (MABLUP) given pedigree relationships, trait and marker data. For large
pedigrees with many missing markers, however, it is not feasible to calculate the exact gametic
variance covariance matrix required to construct HMME. The objective of this study was to
investigate the consequences of using approximate gametic variance covariance matrices on re-
sponse to selection by MABLUP. Two methods were used to generate approximate variance
covariance matrices. The first method (Method A) completely discards the marker informa-
tion for individuals with an unknown linkage phase between two flanking markers. The second
method (Method B) makes use of the marker information at only the most polymorphic marker
locus for individuals with an unknown linkage phase. Data sets were simulated with and with-
out missing marker data for flanking markers with 2, 4, 6, 8 or 12 alleles. Several missing
marker data patterns were considered. The genetic variability explained by marked quantitative
trait loci (MQTL) was modeled with one or two MQTL of equal effect. Response to selection
by MABLUP using Method A or Method B were compared with that obtained by MABLUP
using the exact genetic variance covariance matrix, which was estimated using 15 000 samples
from the conditional distribution of genotypic values given the observed marker data. For the
simulated conditions, the superiority of MABLUP over BLUP based only on pedigree relation-
ships and trait data varied between 0.1% and 13.5% for Method A, between 1.7% and 23.8%
for Method B, and between 7.6% and 28.9% for the exact method. The relative performance of
the methods under investigation was not affected by the number of MQTL in the model.
marker assisted selection / BLUP / gametic variance covariance matrix
∗
Corresponding author:
30 L.R. Totir et al.
1. INTRODUCTION
As a result of extensive efforts to map quantitative trait loci (QTL), a large
number of markers linked to QTL have become available for genetic evalua-
tion. A QTL with a linked marker is referred to as a marked QTL (MQTL).
Genotypes at markers linked to an MQTL can be used to model the genotypic
mean and the genetic variance covariance matrix at the MQTL [8, 29]. Thus,
the effects of the marker genotypes can be included as fixed effects and the
gametic effects of the MQTL as random effects in the mixed linear models
used for genetic evaluation by BLUP [29]. Marker genotypes, however, affect
the genotypic mean only if the markers and the MQTL are in gametic phase
(linkage) disequilibrium [29].
For large pedigrees, the Henderson mixed model equations (HMME) [13]
provide an efficient way to obtain BLUP. One of the requirements to obtain
BLUP from HMME is to compute the inverses of the variance covariance
matrices of the random effects in the model. When only pedigree and trait
information are used for genetic evaluation, the inverse of the conditional vari-
ance covariance matrix of the vector of unobservable genotypic values given
pedigree relationships needs to be computed. Under additive inheritance, ef-
ficient algorithms are available to invert this conditional variance covariance
matrix [12, 20,21].
Chevalet et al. [3] provided a general method to compute the genetic vari-
ance covariance matrix at an MQTL given the pedigree and marker pheno-
types. This matrix, however, has a dense inverse and, thus, cannot be com-
puted efficiently for large pedigrees [30]. When marker genotype information
is available, the conditional variance covariance matrix of the vector of gametic
effects at the MQTL given marker and pedigree information, which is referred
to as the gametic variance covariance matrix at the MQTL, can be constructed
using a recursive algorithm [8]. This matrix has a sparse inverse and, thus, can
be computed efficiently even for large pedigrees, when the parental origin of
marker alleles is either known [8] or not known [14, 27, 28, 30]. However, the
algorithms used to invert the gametic variance covariance matrix at the MQTL
yield exact results only if the marker genotypes and the linkage phase between
markers are known, i.e., when the marker information is complete [15, 30]. In
large pedigrees incomplete marker information is the rule rather than the ex-
ception. Wang et al. [30] provided a formula to compute the exact gametic
variance covariance matrix for incomplete marker data. The use of this for-
mula, however, is computationally intensive and thus, not feasible for large
pedigrees. For large pedigrees, when marker information is incomplete, ap-
proximations must be used.
MABLUP with approximate gametic matrices 31
The objective of this study was to examine the effect of two methods of
approximating the gametic variance covariance matrix on response to selection
by MABLUP.
2. METHODS
2.1. Notation
Consider an MQTL (Q) closely linked to two polymorphic flanking markers
(M and N). M and N are assumed to be in linkage equilibrium with Q and
with each other. The following diagram shows the chromosomal segments
containing Q, M, and N, for individual i with parents d and s, and for another
individual j.
M
m
d
Q
m
d
N
m
d
M
m
s
Q
m
s
N
m
s
M
f
d
Q
f
d
N
f
d
M
f
s
Q
f
s
N
f
s
↓
M
m
j
Q
m
j
N
m
j
M
m
i
Q
m
i
N
m
i
M
f
j
Q
f
j
N
f
j
M
f
i
Q
f
i
N
f
i
The paternal allele at a given locus is denoted by a superscript f ,andthema-
ternal allele by a superscript m. The genotypes at markers M and N may be ob-
served, and thus, may be used for marker assisted genetic evaluation (MAGE).
The genotypes at the MQTL (Q), however, cannot be observed. As discussed
later, even if the marker genotypes are known, it is not always possible to infer
the linkage phase between them.
The conditional covariance of the additive effects v
k
i
i
and v
k
j
j
of MQTL alle-
les Q
k
i
i
and Q
k
j
j
in individuals i and j, given the observable marker information
(G
obs
), is written as
Cov
v
k
i
i
,v
k
j
j
| G
obs
= Pr
Q
k
i
i
≡ Q
k
j
j
| G
obs
σ
2
v
, (1)
where k
i
and k
j
are m or f if the MQTL allele origin is known [8], and 1
or 2 if the MQTL allele origin is not known [30]; Pr(Q
k
i
i
≡ Q
k
j
j
| G
obs
)isthe
conditional probability that Q
k
i
i
is identical by descent (IBD) to Q
k
j
j
given G
obs
;
σ
2
v
is half of the variance of the additive effect of the MQTL.
32 L.R. Totir et al.
2.2. IBD probabilities at the MQTL
Given pedigree information, recursive formulae have been widely used to
compute IBD probabilities [2, 4, 6, 9,18, 22–25]. These formulae are based on
the principle that apriorithe allele transmitted from a parent to an offspring is
equally likely to be the parent’s maternal or paternal allele. Thus, the uncon-
ditional probability that Q
m
i
, for example, is IBD to Q
k
j
j
can be written as
Pr
Q
m
i
≡ Q
k
j
j
=
1
2
Pr
Q
m
d
≡ Q
k
j
j
+
1
2
Pr
Q
f
d
≡ Q
k
j
j
. (2)
When genotype information is available at a single marker, but the parental
origin of the marker alleles is not known, following Wang et al. [30], the con-
ditional probability that Q
k
i
i
is IBD to Q
k
j
j
given G
obs
for i j, can be written as
Pr
Q
k
i
i
≡ Q
k
j
j
| G
obs
=
Pr
Q
k
i
i
← Q
1
d
, Q
1
d
≡ Q
k
j
j
| G
obs
+ Pr
Q
k
i
i
← Q
2
d
, Q
2
d
≡ Q
k
j
j
| G
obs
+ Pr
Q
k
i
i
← Q
1
s
, Q
1
s
≡ Q
k
j
j
| G
obs
+ Pr
Q
k
i
i
← Q
2
s
, Q
2
s
≡ Q
k
j
j
| G
obs
, (3)
where for example, Pr(Q
k
i
i
← Q
1
d
, Q
1
d
≡ Q
k
j
j
) denotes the probability of the
event that Q
k
i
i
descended from Q
1
d
and Q
1
d
is IBD to Q
k
j
j
. Note that if the
parental origin of the marker allele is known, two of the four terms in equa-
tion (3) will be null. Thus, for example, for k
i
= m equation (3) becomes
Pr
Q
m
i
≡ Q
k
j
j
| G
obs
=
Pr
Q
m
i
← Q
m
d
, Q
m
d
≡ Q
k
j
j
| G
obs
+ Pr
Q
m
i
← Q
f
d
, Q
f
d
≡ Q
k
j
j
| G
obs
. (4)
If the marker genotypes of d and s are known and j is not a direct descendant
of i, the descent of allele Q
k
i
i
from one of the alleles of d or s, is independent
of the event that alleles in j are identical by descent to alleles in d or s [30].
MABLUP with approximate gametic matrices 33
As a result, equation (3) becomes
Pr
Q
k
i
i
≡ Q
k
j
j
| G
obs
= Pr
Q
k
i
i
← Q
1
d
| G
obs
Pr
Q
1
d
≡ Q
k
j
j
| G
obs
+ Pr
Q
k
i
i
← Q
2
d
| G
obs
Pr
Q
2
d
≡ Q
k
j
j
| G
obs
+ Pr
Q
k
i
i
← Q
1
s
| G
obs
Pr
Q
1
s
≡ Q
k
j
j
| G
obs
+ Pr
Q
k
i
i
← Q
2
s
| G
obs
Pr
Q
2
s
≡ Q
k
j
j
| G
obs
, (5)
where for example, Pr(Q
k
i
i
← Q
1
d
| G
obs
) denotes the probability of descent
of Q
k
i
i
from Q
1
d
(PDQ). Note that if the parental origin at the marker allele is
known, for example k
i
= m, equation (5) becomes
Pr
Q
m
i
≡ Q
k
j
j
| G
obs
= Pr
Q
m
i
← Q
m
d
| G
obs
Pr
Q
m
d
≡ Q
k
j
j
| G
obs
+ Pr
Q
m
i
← Q
f
d
| G
obs
Pr
Q
f
d
≡ Q
k
j
j
| G
obs
. (6)
When marker information for the parents is missing, the independence re-
quired to obtain equation (5) from equation (3) may not hold true [30]. Thus,
equation (5) may yield only approximate results when marker information is
missing. When the parental origin at the marker genotype is not known, equa-
tion (5) cannot be used directly to compute IBD probabilities within an indi-
vidual (i = j) [30]. For this situation, IBD probabilities can be computed using
formula (11) in Wang et al. [30].
When genotype information is available at markers flanking the MQTL, the
conditional probability that Q
k
i
i
is IBD to Q
k
j
j
given G
obs
for i j, can be
obtained from (5) but with PDQ computed conditional on the flanking marker
information [10]. In this situation, even when marker genotypes are observed,
if the linkage phase between the two flanking markers is not known, the in-
dependence required to obtain equation (5) from equation (3) may not hold
true [15]. Thus, equation (5) may yield only approximate results when the
linkage phase between flanking markers is not known.
For a single marker, Wang et al. [30] derived formulae for computing PDQ
in terms of recombination rates and probabilities of descent for a marker allele
(PDM), e.g. Pr(M
k
i
i
← M
1
d
| G
obs
). When some marker genotypes are miss-
ing, however, computing the required PDM may be computationally intensive.
For example, when marker information is missing for an individual i and its
34 L.R. Totir et al.
parents d and s,thePDMPr(M
1
i
← M
1
d
| G
obs
) can be written as
Pr
M
1
i
← M
1
d
| G
obs
=
G
d
G
s
G
i
Pr
M
1
i
← M
1
d
| G
d
, G
s
, G
i
Pr
(
G
d
, G
s
, G
i
| G
obs
)
. (7)
In equation (7), the calculation of Pr(G
d
, G
s
, G
i
| G
obs
) can be computationally
demanding for a pedigree with a large number of missing marker genotypes.
Thus, to make computations feasible for large pedigrees with many missing
marker genotypes, Pr(G
d
, G
s
, G
i
| G
obs
) must also be approximated. Note that
when flanking markers are used, PDM are replaced by probabilities of de-
scent of a haplotype [11]. Again, when the linkage phase between the flanking
markers is not known, these probabilities must be approximated.
If the gametic variance covariance matrix is constructed using the recursive
formula (5), then its inverse can also be obtained using a simple recursive
formula [27, 30]. But, for large pedigrees with many missing markers, this
requires the efficient computation of approximate PDQ. In the next section we
discuss two strategies to compute approximate PDQ for large pedigrees given
genotypes at two flanking markers.
2.3. Approximate calculations of PDQ probabilities
The genotype at a marker locus may be unobserved (missing) or observed.
Based on the observable marker data for the entire pedigree, some of the un-
observed marker genotypes can be inferred with certainty. In this paper, the
genotype elimination algorithm by Lange and Goradia [17] was applied to the
entire pedigree. This algorithm yields a list of possible genotypes for each of
the unobserved genotypes. Whenever such a list contains only one possible
genotype, the unobserved genotype is inferred with certainty and is treated as
an observed genotype. An observed genotype is ordered if the parental origin
of the alleles is known, or unordered if the parental origin is unknown.
One simple method to compute PDQ is to use marker information only
when the genotypes are ordered at both flanking markers, i.e., when the link-
age phase between the markers is known. In this case, PDQ can be computed
as described by Goddard [10]. For example, if we assume at most a single
recombination between the flanking markers, the PDQ for MQTL allele Q
m
i
,
conditional on the maternal marker haplotype inherited by i, can be calculated
as shown in Table I. The PDQ for MQTL allele Q
f
i
, conditional on the paternal
marker haplotype inherited by i, can be calculated in a similar manner.
When the phase is not known, marker information is completely ignored,
and thus, the PDQ for each of the parental alleles is equal to 0.5. This method
will be referred to as Method A.
MABLUP with approximate gametic matrices 35
Tab l e I . Given the maternal marker haplotype inherited by i, the probability that the
MQTL allele Q
m
i
descends from the parental allele Q
k
p
(PDQ), where p is d or s and k
is m or f . M
?
d
N
?
d
denotes an unknown haplotype. Here r
1
is the recombination rate
between marker locus M and MQTL Q; r
2
is the recombination rate between marker
locus N and MQTL Q.
Haplotype Q
k
p
inherited Q
m
d
Q
f
d
Q
m
s
Q
f
s
M
m
d
N
m
d
1.0 0.0 0.0 0.0
M
m
d
N
f
d
r
2
r
1
+r
2
r
1
r
1
+r
2
0.0 0.0
M
f
d
N
m
d
r
1
r
1
+r
2
r
2
r
1
+r
2
0.0 0.0
M
f
d
N
f
d
0.0 1.0 0.0 0.0
M
?
d
N
?
d
0.5 0.5 0.0 0.0
An alternative method that makes better use of the marker information is
described below. This alternative method will be referred to as Method B. As
in Method A, when the linkage phase between the markers is known, PDQ
can be computed conditional on marker haplotypes [10]. When the linkage
phase between the markers is not known, genotype information at one of the
two flanking markers can be used to compute PDQ [19, 26]. The genotype
at the marker locus may be ordered or unordered, and these two cases are
considered separately. When the marker genotype is ordered, PDQ can be
computed as described by Fernando and Grossman [8]. For example, the PDQ
for the MQTL allele Q
m
i
, conditional on the maternal marker allele inherited
by i, can be calculated as shown in Table II. The PDQ for MQTL allele Q
f
i
,
conditional on the paternal marker allele inherited by i, can be calculated in a
similar manner.
When marker genotypes of an offspring are unordered, marker information
can be ignored [8, 19]. However, as discussed later, this results in a loss of
information. The genotype of an offspring at a marker locus may be unordered
only if it is heterozygous at that locus. Given that the genotype of an individual
is heterozygous, it will be unordered if both its parents are heterozygous for the
same alleles, or one of the parents is heterozygous for the same alleles while
the marker information at the other parent is missing, or if the marker informa-
tion is missing in both parents. When the marker genotype is unordered, PDQ
can be calculated as described by Wang et al. [30] by multiplying a 2 × 4ma-
trix of PDM by a 4 × 4 matrix involving recombination rates. If the marker
genotypes are observed for both parents, the PDM are easily obtained from
formula (A1) in Wang et al. [30]. For example, when both parents and the off-
spring have marker genotype A
1
A
2
, the PDM for marker allele M
1
i
are given
in row one of Table III.
36 L.R. Totir et al.
Table II. Given the maternal marker allele inherited by i, the probability that MQTL
allele Q
m
i
descends from the parental allele Q
k
p
(PDQ), where p is d or s and k is m
or f . M
?
d
denotes unknown descent. Here r
1
is the recombination rate between marker
locus M and MQTL Q.
Allele Q
k
p
inherited Q
m
d
Q
f
d
Q
m
s
Q
f
s
M
m
d
1 − r
1
r
1
0.0 0.0
M
f
d
r
1
1 − r
1
0.0 0.0
M
?
d
0.5 0.5 0.0 0.0
Table III. Given the parental marker information, the probability that marker al-
lele M
1
i
descends from the parental allele M
k
p
(PDM), where p is d or s and k is 1
or 2. - denotes missing marker information.
Genotype of M
k
p
ds iM
1
d
M
2
d
M
1
s
M
2
s
A
1
A
2
A
1
A
2
A
1
A
2
0.5 0.0 0.5 0.0
A
1
A
2
- A
1
A
2
0.5 0.0 0.25 0.25
A
1
A
2
0.25 0.25 0.25 0.25
When marker genotypes are missing in the parents, Wang et al. [30] used
equation (7) to compute the PDM. But, this can be computationally demanding
in large pedigrees with many missing genotypes. Thus, we compute the PDM
using only the marker genotypes that are observed in the parents. For example,
if the marker genotype is missing in parent s,andisA
1
A
2
for d and i,thePDM
for marker allele M
1
i
, ignoring all the other marker information in the pedigree,
are given in row two of Table III. Row three of Table III gives the PDM for
marker allele M
1
i
, ignoring all the other marker information in the pedigree,
for the case when the marker genotype is missing for d and s,andisA
1
A
2
in i.
Thus, when marker genotypes of an offspring are unordered, PDM of the type
described above can be computed easily. As mentioned earlier for Method A,
when the genotypes at both markers are unobserved, the PDQ for each of the
parental alleles is equal to 0.5.
It is important to note that, under the assumption of at most a single re-
combination between flanking markers, some PDQ are equal to one (Tab. I).
When this occurs, the MQTL allele Q
m
i
, for example, is traced with certainty
to MQTL allele Q
m
d
, and thus, Pr(Q
m
i
≡ Q
m
d
| G
obs
) = 1. A similar situation
will occur when, for example, Pr(Q
m
d
≡ Q
f
d
| G
obs
) = 1. Recall that Q
m
i
is
either Q
m
d
or Q
f
d
. Thus, regardless of the value of the PDQ, Pr(Q
m
i
≡ Q
m
d
|
G
obs
) = Pr(Q
m
i
≡ Q
f
d
| G
obs
) = 1. When the IBD probability between any pair
MABLUP with approximate gametic matrices 37
of MQTL alleles is one, the gametic variance covariance matrix will not be
positive definite. To avoid this problem, if two alleles are IBD with a probabil-
ity of one, only the effect of one of these two alleles is included in the mixed
linear model. A side effect of this approach is the reduction in the number of
equations in HMME and thus, an increase in the computational efficiency [10].
2.4. Calculation of the inverse of the gametic variance covariance
matrix
The PDQ computed as described above can be used in formulae (18), (19),
and (21) of Wang et al. [30] to efficiently obtain the inverse of the gametic
variance covariance matrix. Formula (19) of Wang et al. [30] requires com-
puting the IBD probabilities between the MQTL alleles of the parents. These
were computed using the recursive formula (5), except for alleles within an
individual with unordered markers. For individuals with unordered markers,
IBD probabilities between their maternal and paternal alleles were computed
using formula (11) in [30].
Recursive computation of the IBD probability between any pair of alleles
may require IBD probabilities previously used in computing the IBD proba-
bility between other pairs of alleles. Thus, as in Abdel-Azim and Freeman [1],
in order to avoid computing the same IBD probability repeatedly, upon the
computation of an IBD probability it was stored for possible future use. While
Abdel-Azim and Freeman [1] used linked lists to store the probabilities, we
used a map container class of the C++ Standard Template Library. Each data
item (an IBD probability in this case) stored in a map container class is indexed
by a key. For elements i and j of the IBD matrix, i and j were used as the key
to store and retrieve this element.
2.5. Estimation of the exact genetic variance covariance matrix
by MCMC
ESIP, an MCMC sampler that combines the Elston-Stewart algorithm with
iterative peeling [7], was used to sample the genotypes for unobserved mark-
ers and all the MQTL genotypes jointly from the entire pedigree. Given the
genotypic effects and the sampled MQTL genotypes, a vector of genotypic
values was obtained for the pedigree. The genetic variance covariance matrix
was estimated from 15 000 independently distributed vectors of genotypic val-
ues. A scenario with 50 000 vectors of genotypic values was also considered
(Sect. 3.1). To validate this approach, the genetic variance covariance matrix
estimated by ESIP was compared with the exact genetic variance covariance
matrix calculated by using formula (27) of Wang et al. [30] for the case of a
single marker linked to the MQTL.
38 L.R. Totir et al.
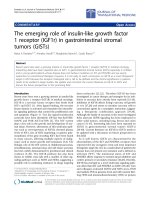
Figure 1. Pedigree used.
2.6. Simulation study
Simulated data were used to examine the consequences of using approxi-
mate gametic covariance matrices on response to selection by MABLUP. Trait
phenotypes and genotypes at two markers flanking the MQTL were simulated
for the hypothetical pedigree shown in Figure 1. This pedigree spans four gen-
erations, has 96 individuals, several loops, and each of its nuclear families has
10 offspring. In all simulations, the recombination rate between each of the
flanking markers and the MQTL was 0.05.
To identify the differences between the two approximations considered, we
simulated experimental situations for which the use of marker information is
expected to have a large effect on response to selection. Thus, a trait with a
heritability of 0.1 that was not measured on the candidates for selection (in-
dividuals 47 to 96) was simulated. To make the simulation computationally
manageable, only one MQTL was simulated to account for 28.5% of the to-
tal genetic variance (2.85% of the phenotypic variance) for all but one of the
experimental situations considered. In addition to the MQTL, the trait was
determined by 40 identical, unlinked, biallelic QTL with an allele frequency
of 0.5.
To examine the effect of the number of marker alleles (N
a
) on the approx-
imations, simulation results were obtained for the models without missing
marker genotypes, one MQTL, and with N
a
= 2, 4, 6, 8, or 12 at each of the
flanking markers. A frequency of
1
N
a
was used for each allele.
MABLUP with approximate gametic matrices 39
To examine if the number of MQTL included in the model has an effect
on the approximations, simulation results were obtained for models without
missing marker genotypes, N
a
= 2 at each of the flanking markers, and with
either one MQTL or two MQTL, with each of the two MQTL accounting for
14.25% of the total genetic variance.
To examine the effect of missing marker data on the approximations, four
missing marker data patterns were considered. In the first missing marker data
pattern (P1), founders 1, 2, 3, 14, and 15 had missing marker genotypes on
both flanking markers. In the second pattern (P2), founders 1, 2, 3, 14, 15,
and half of the terminal offspring that are not candidates for selection had
missing marker genotypes on both flanking markers. In the third pattern (P3),
founders 1, 2, 3, 14, 15, and all terminal offspring that are not candidates for
selection had missing marker genotypes on both flanking markers. Finally, in
the fourth pattern considered (P4), all parents were genotyped but all terminal
offspring that are not candidates for selection had missing marker genotypes
on both flanking markers. Simulation results were obtained for the models
with one MQTL, N
a
= 2 for missing patterns P1, P2, P3, and P4.
For each experimental situation considered, the 5 highest ranking individ-
uals were selected out of the 50 candidates for selection based on genetic
evaluations obtained by: BLUP using only phenotypic data, MABLUP using
the gametic variance covariance matrix calculated by Method A, MABLUP
using the gametic variance covariance matrix calculated by Method B, and
MABLUP using the exact genetic variance covariance matrix estimated by
ESIP (Method E). Response to selection obtained by BLUP using only phe-
notypic data was used as the reference value to compare methods A, B and E.
For each of the three methods under investigation, the percent superiority in
response by MABLUP over response by BLUP was calculated as
R
M ABLU P
− R
BLU P
R
BLU P
× 100,
where, for example, R
M ABLU P
is the difference between the mean of the geno-
typic values of the candidates selected using MABLUP and the mean of the
genotypic values of the candidates for selection.
3. RESULTS
3.1. Validation of the use of ESIP to estimate the exact genetic
variance covariance matrix
To validate ESIP as an accurate method to estimate the exact genetic vari-
ance covariance matrix, we used two simulated data sets with N
a
= 4 at each of
the flanking markers, one with no missing marker data and one with a missing
40 L.R. Totir et al.
Tab l e IV. Maximum, mean and standard deviation of the elements of the matrices of
absolute differences between the exact and the estimated genetic variance covariance
matrices, for the situations with no missing marker data and with missing pattern P1
for N
a
= 4. The estimated matrices were calculated using 15 000 or 50 000 samples
generated by ESIP.
Marker data No. of samples Maximum Mean S.D.
no missing 15 000 7.0 × 10
−2
1.3 × 10
−2
1.0 × 10
−2
50 000 3.0 × 10
−2
6.7 × 10
−3
5.0 × 10
−3
pattern P1 15 000 6.4 × 10
−2
1.3 × 10
−2
1.0 × 10
−2
50 000 3.2 × 10
−2
6.7 × 10
−3
5.0 × 10
−3
marker data pattern P1. However, because it is not computationally feasible
to use formula (27) from Wang et al. [30] to calculate the exact genetic vari-
ance covariance matrix given the information at flanking markers with missing
genotypes, the marker data at one of the two marker loci was discarded. For
each of the two situations considered, the exact genetic variance covariance
matrix was calculated using formula (27) of Wang et al. [30], and it was esti-
mated using 15 000 or 50 000 independently distributed vectors of genotypic
values sampled by ESIP. The absolute difference between the exact genetic
variance covariance matrix and the estimated variance covariance matrix was
calculated for each of the two situations considered. For each matrix of abso-
lute differences, the maximum, mean, and standard deviation of its elements
were computed, and are reported in Table IV.
These statistics were used to assess the accuracy of the variance covari-
ance matrix estimated by ESIP. For both situations, the accuracy of the genetic
variance covariance matrix estimated using 15 000 samples was considered
sufficient.
3.2. Comparison of response to selection obtained with different
MABLUP methods
The running mean of percent superiority of MABLUP by methods A, B,
and E was calculated based on 5000 replicates for each experimental situa-
tion considered. After about 3000 replicates each running mean was virtually
constant.
3.2.1. Response to selection for situations with no missing marker
information
Figure 2 summarizes the percent superiority of MABLUP estimated from
5000 replicates of the simulation, by methods A, B, and E, and by the number
of alleles at a marker when marker data were available for all individuals.
MABLUP with approximate gametic matrices 41
Figure 2. The summary of percent superiority of MABLUP estimated from
5000 replicates of the simulation, by methods A, B, and E, and by the number of
alleles at each of the flanking markers when all individuals have marker data.
Method A performed worst in all situations. Compared with Method A,
Method B resulted in an increased response to selection for all situations con-
sidered. The difference in superiority obtained with Method B versus the
superiority obtained with Method A was approximately 8 to 10.3%.
It can be seen from Figure 2 that as N
a
increases, the percent superiority
of MABLUP by both methods A and B increases. However, the increase for
method A is more rapid, especially from N
a
= 2toN
a
= 4. Recall that in
Method A marker information in a parent is used only if the markers are dou-
bly heterozygous and their linkage phase is known. In contrast for Method B,
even when only one of the two markers is heterozygous and even if the link-
age phase is not known marker information in a parent may be used. In both
methods the increase in percent superiority is due to the increase in the number
of heterozygous genotypes at the two marker loci. A possible explanation for
the more rapid change for Method A is that for the situation with N
a
= 2most
individuals were evaluated using only pedigree and trait information. When
the number of alleles increased to 4, markers became informative for many
of these individuals. In contrast for Method B, even with N
a
= 2manyin-
dividuals were evaluated using pedigree, trait and marker information at one
locus. When the number of alleles increases to 4, many individuals that were
originally evaluated using information at one marker are evaluated using in-
formation at both markers. The change in percent superiority of MABLUP
42 L.R. Totir et al.
Figure 3. The summary of percent superiority of MABLUP estimated from
5000 replicates of the simulation, by methods A, B, and E, and by the number of
MQTL in the model (1 or 2) when all individuals have marker data and each of the
flanking markers has two alleles.
is higher when going from using no marker information to using two mark-
ers, which is what happens with Method A, than when going from using one
marker to using two markers, which is what happens with Method B.
Figure 2 also shows the effect of the increase in the number of alleles at the
two marker loci on percent superiority of MABLUP by Method E. Again, the
increase in the number of heterozygous genotypes at the marker loci resulted in
an increase in superiority, for example, by ∼ 8.9% when moving from N
a
= 2
to N
a
= 4. However, the rate of increase is higher for Method B than for
Method E. A possible explanation for this result is that Method E always uses
information at both marker loci, where phase information comes from the en-
tire pedigree. Thus, even with N
a
= 2 all informative markers are used. For
Method E, the increase in percent response is due only to the increase in the
number of informative markers. Figure 2 also shows that, while for methods A
and B the percent superiority increased continuously as N
a
increased from two
to 12, for method E the percent superiority stayed approximately constant as
N
a
increased from six to 12.
Figure 3 shows the superiority of MABLUP for models with one MQTL
or two MQTL of equal magnitude. These results indicate that the number of
MQTL included in the model has little or no effect on the relative performance
of the methods under investigation.
MABLUP with approximate gametic matrices 43
Figure 4. The summary of percent superiority of MABLUP estimated from
5000 replicates of the simulation, by methods B and E with N
a
= 2, for the situa-
tion with no missing marker data (C), and for missing marker data patterns P1, P2, P3,
and P4 (Sect. 2.6).
3.2.2. Response to selection for situations with missing marker
information
Figure 4 summarizes the percent superiority of MABLUP estimated from
5000 replicates of the simulation, by methods B and E with N
a
= 2 for missing
marker data patterns P1, P2, P3, and P4 as well as for the situation with no
missing marker data (pattern C).
Marker information from offspring contributes to MABLUP in two ways.
First, when both parents and offspring have marker information, it may be
possible to trace the inheritance of MQTL alleles from parents to some of the
offspring. These offspring are said to be informative. Then, the phenotypic
information from each of these informative offspring contributes to the eval-
uation of the MQTL effects in the parents. Second, even if the genotypes of
the parents are missing, when genotype information is available on many off-
spring, it may be possible to infer the genotypes and phase at the flanking
markers of the parents. The inference of the linkage phase will be more certain
for parents that have more offspring with marker data. When the linkage phase
in the parents is inferred with greater certainty, the inheritance of MQTL alleles
is traced more effectively. Thus, for parents with many genotyped offspring,
the contribution of the phenotypic information from each of the informative
offspring becomes more effective for the evaluation of MQTL effects in the
parents.
Recall that Method E is an MCMC method that makes optimal use of all the
marker information from the entire pedigree. Although the marker genotypes
44 L.R. Totir et al.
for the founders were missing in P1, all their offspring were genotyped. Thus,
when Method E was used, the missing marker genotypes of the founders as
well as the linkage phase between the flanking markers were inferred with a
high level of certainty. This explains the negligible difference in superiority
between pattern C and pattern P1 in Figure 4. When method B was used,
the superiority with pattern P1 was considerably lower than with pattern C
(Fig. 4). This was because Method B does not make optimal use of the marker
information from the offspring to infer the genotypes and linkage phase in the
founders.
Recall that in addition to the founders having missing genotypes, the per-
centage of missing genotypes among the terminal offspring that are not can-
didates for selection, is 0% for P1, 50% for P2, and 100% for P3. With both
Methods B and E, the loss in superiority seems to be proportional to the per-
centage of offspring with missing genotypes (Fig. 4).
In pattern P4, all parents are genotyped but all terminal offspring that are not
candidates for selection are not genotyped. Thus, in both Methods B and E,
only the phenotypic information of the non-terminal offspring contributes to
the evaluation of the MQTL effects in the founders. Furthermore, in Method E,
the linkage phase between the flanking markers is inferred only based on the
marker information of the non-terminal offspring. Thus, for both Methods B
and E, the superiority with pattern P4 was considerably lower than that with
pattern C (Fig. 4) where all offspring contribute with marker and phenotype in-
formation. Note that the difference in superiority between P3 and P4 is larger
for Method B than for Method E. The same argument used to explain the dif-
ference in superiority between C and P1 is valid for the difference between P3
and P4.
4. DISCUSSION
Pong-Wong et al. [19] used a method that is similar to our Method B to
compute the approximate gametic variance covariance matrix, yet with some
important differences. First, when marker genotypes are missing, Pong-Wong
et al. [19] used only the marker genotypes of parents and offspring to deter-
mine the missing marker genotypes. In contrast, in Method B genotype elim-
ination [17] was used to determine the missing marker genotypes given the
observable marker data for the entire pedigree. Second, Pong-Wong et al. [19]
used a deterministic approach developed by Knott and Haley [16] to calcu-
late IBD probabilities between the offspring of founders conditional on marker
information of both flanking loci. When the approach proposed by Pong-Wong
et al. is used, however, the inverse of the gametic variance covariance ma-
trix cannot be obtained efficiently and thus, their approach is not useful for
MABLUP with approximate gametic matrices 45
MABLUP. In Method B, to compute the PDQ for offspring from founders, we
used only information from one marker locus, and all IBD probabilities were
computed using the recursive formula (5). Thus, the gametic variance covari-
ance obtained using Method B could be inverted efficiently. Finally, when the
linkage phase was not known in non-founders both the method used by Pong-
Wong et al. [19] and Method B used only one of the two flanking markers to
obtain IBD probabilities. However, if the genotype at the marker locus used is
unordered, Pong-Wong et al. [19] ignored the marker information at this locus.
In Method B, however, following Wang et al. [30], marker information was
used to calculate the IBD probabilities. The benefit of using marker informa-
tion in this situation is described below. Consider the covariance between the
MQTL effects of half-sibs that receive different marker alleles from their sire.
If the marker genotype in the sire is unordered, Pong-Wong et al. [19] used
only pedigree information to compute this covariance between these half-sibs,
which is equal to
1
2
σ
2
v
. However, if the marker information is used as described
by Wang et al. [30] the covariance between half-sibs will be 2(1 − r)rσ
2
v
.
Methods A and B yield approximate gametic variance covariance matri-
ces due to the following reasons. The gametic variance covariance matrix is
constructed in both methods using equation (5). However, when the marker
genotypes for parents are missing, or even when there is no missing marker
data but the linkage phase between flanking markers is unknown, this recur-
sive equation yields approximate IBD probabilities. Furthermore, the PDQ re-
quired to calculate IBD probabilities using equation (5) are approximated to be
able to accommodate large pedigrees with many missing markers. For all sit-
uations considered, Method B yielded a higher response to selection and thus
indicates a better use of the available marker information. However, the re-
sults obtained with Method E indicate that even Method B does not adequately
utilize the observable marker information. For example, with missing data pat-
tern P1 (Fig. 4) where the marker genotypes of the founders are missing, the
loss in response to selection by MABLUP was negligible when Method E was
used. In contrast, when Method B was used the loss in response to selection
by MABLUP was considerable. This shows that when a method that makes
optimal use of marker information (such as Method E) is employed, marker
information from many offspring can make up for missing genotypes in the
parents. However, even when marker information is available on all the par-
ents, genotyping terminal offspring results in greater response to selection by
MABLUP.
At present, in Method B PDQ are computed based only on the marker in-
formation of the individual and its parents. Method B could be improved by
computing the PDQ conditional on observable marker data from all “closely”
related individuals [30]. This can be done by deterministic methods such as the
46 L.R. Totir et al.
Elston-Stewart algorithm [5], or by MCMC. With MCMC methods it may be
possible to estimate PDQ using all the marker information from large and com-
plex pedigrees. This, however, would not be possible with the Elston-Stewart
algorithm except for simple pedigrees.
From the comparisons in this paper it is not possible to determine how much
of the loss in response is due to the violation of the independence condition that
is required to obtain equation (5) as opposed to the use of approximate PDQ.
The use of exact PDQ in Method B in comparison to Method E would allow
us to determine the loss in response caused by the use of equation (5).
The main conclusion of this paper is that the choice of the PDQ approxima-
tions used to construct the gametic variance covariance matrix has a significant
impact on response to selection by MABLUP. Furthermore we demonstrated
the potential advantage of improving the current approximations of the gametic
variance covariance matrix.
ACKNOWLEDGEMENTS
This journal paper of the Iowa Agriculture and Home Economics Experi-
ment Station, Ames, Iowa, Project No. 6587, was supported by Hatch Act and
State of Iowa funds. This work was partially funded by the Monsanto Com-
pany and by award No. 2002-35205-1156 of the National Research Initiative
Competitive Grants Program of the USDA. Helpful comments and suggestions
from the editor and two referees are gratefully acknowledged.
REFERENCES
[1] Abdel-Azim G., Freeman A.E., A rapid method for computing the inverse of
the gametic covariance matrix between relatives for a marked quantitative trait
locus, Genet. Sel. Evol. 33 (2001) 153–173.
[2] Chang H.L., Studies on estimation of genetic variances under non-additive gene
action, Ph.D. Thesis, University of Illinois at Urbana-Champaign, 1988.
[3] Chevalet C., Gillois M., Khang J.V.T., Conditional probabilities of identity of
genes at a locus linked to a marker, G´en´et. S´el.
´
Evol. 16 (1984) 431–444.
[4] Cockerham C.C., Effects of linkage on the covariance between relatives, Genet-
ics 41 (1956) 138–141.
[5] Elston R.C., Stewart J., A general model for the genetic analysis of pedigree
data, Hum. Hered. 21 (1971) 523–542.
[6] Emik L.O., Terrill C.E., Systematic procedures for calculating inbreeding coef-
ficients, J. Hered. 40 (1949) 51–55.
[7] Fernandez S.A., An algorithm to sample genotypes in complex pedigrees, Ph.D.
Thesis, Iowa State University, 2001.
[8] Fernando R.L., Grossman M., Marker assisted selection using best linear unbi-
ased prediction, Genet. Sel. Evol. 21 (1989) 467–477.
MABLUP with approximate gametic matrices 47
[9] Gillois M., La relation d’identit´eeng´en´etique, [genetic identity relationship],
Ph.D. Thesis, Fac. Sci. Paris. (1964) in: Jacquard A. (Ed.), The Genetic Structure
of Populations, Springer-Verlag, Germany, 1974.
[10] Goddard M.E., A mixed model for analysis of data on multiple genetic markers,
Theor. Appl. Genet. 83 (1992) 878–886.
[11] Grignola F.E., Hoeschele I., Tier B., Mapping quantitative trait loci in outcross
populations via residual maximum likelihood. I. Methodology, Genet. Sel. Evol.
28 (1996) 479–490.
[12] Henderson C.R., A simple method for computing the inverse of a numerator
relationship matrix used in prediction of breeding values, Biometrics 32 (1976)
69–83.
[13] Henderson C.R., Applications of linear models in animal breeding, University of
Guelph, Guelph, Ontario, Canada, 1984.
[14] Hoeschele I., Elimination of quantitative trait loci equations in an animal model
incorporating genetic marker data, J. Dairy Sci. 76 (1993) 1693–1713.
[15] Hoeschele I., Mapping of quantitative trait loci in complex pedigrees, in: Balding
D., Bishop M., Cannings C. (Eds.), Handbook of Statistical Genetics, Wiley,
2001, pp. 599–644.
[16] Knott S., Haley C.S., Simple multiple-marker sib-pair analysis for mapping
quantitative trait loci, Heredity 81 (1998) 48–54.
[17] Lange K., Goradia T.M., An algorithm for automatic genotype elimination, Am.
J. Hum. Genet. 40 (1987) 250–256.
[18] Lo L.L., Fernando R.L., Cantet R.J.C., Grossman M., Theory of modelling
means and covariances in a two-breed population with dominance, Theor. Appl.
Genet. 90 (1995) 49–62.
[19] Pong-Wong R., George A.W., Wooliams J.A., Haley C.S., A simple and rapid
method for calculating identity-by-descent matrices using multiple markers,
Genet. Sel. Evol. 33 (2001) 453–471.
[20] Quaas R.L., Additive genetic model with groups and relationships, J. Dairy Sci.
71 (1988) 1338–1345.
[21] Quaas R.L., Anderson R.D., Gilmour A.R., BLUP school handbook; use of
mixed models for prediction and estimation of (co)variance components, Animal
Breeding and Genetics Unit, University of New England, NSW 2351, Australia,
1984.
[22] Quaas R.L., Pollak E.J., Mixed model methodology for farm and ranch beef
cattle testing programs, J. Anim. Sci. 51 (1980) 1277–1287.
[23] Thompson E.A., Two-locus and three-locus gene identity by descent in pedi-
grees, IMA J. Math. Appl. Med. Biol. 5 (1988) 261–279.
[24] Tier B., Computing inbreeding coefficients quickly, Genet. Sel. Evol. 22 (1990)
419–430.
[25] Totir L.R., Fernando R.L., The effect of linkage on the additive by additive co-
variance between relatives, Genet. Sel. Evol. 30 (1998) 409–421.
48 L.R. Totir et al.
[26] Totir L.R., Fernando R.L., Dekkers J.C.M., Effect of using approximate gametic
variance covariance matrices on marker assisted selection by BLUP, J. Anim.
Sci. 80 (Suppl. 2) (2002) 20.
[27] van Arendonk J.A.M., Tier B., Kinghorn B.P., Use of multiple genetic markers
in prediction of breeding values, Genetics 137 (1994) 319–329.
[28] Wang T., van der Beek S., Fernando R.L., Grossman M., Covariance between
effects of marked QTL alleles, J. Anim. Sci. 69 (Suppl. 1) (1991) 202.
[29] Wang T., Fernando R.L., Grossman M., Genetic evaluation by BLUP using
marker and trait information in a multibreed population, Genetics 148 (1998)
507–515.
[30] Wang T., Fernando R.L., van der Beek S., Grossman M., van Arendonk J.A.M.,
Covariance between relatives for a marked quantitative trait locus, Theor. Appl.
Genet. 27 (1995) 251–274.
To access this journal online:
www.edpsciences.org