Báo cáo sinh học: " Genetic analysis of a divergent selection for resistance to Rous sarcomas in chickens " pdf
Bạn đang xem bản rút gọn của tài liệu. Xem và tải ngay bản đầy đủ của tài liệu tại đây (198.42 KB, 17 trang )
Genet. Sel. Evol. 36 (2004) 65–81 65
c
INRA, EDP Sciences, 2004
DOI: 10.1051/gse:2003051
Original article
Genetic analysis of a divergent selection
for resistance to Rous sarcomas in chickens
†
Marie-H
´
el
`
ene P- L
a∗
,DenisS
b
,
Laurence M
´
c
,Dani
`
ele B
d
, Gillette L
d
,
Ginette D
b
, Pierrick T
b
a
UMR G´en´etique et diversit´e animales, Institut national de la recherche agronomique,
78352 Jouy-en-Josas Cedex, France
b
Unit´e BioAgresseurs, Sant´e Environnement, Institut national de la recherche agronomique,
37380 Nouzilly, France
c
Station de pathologie aviaire et parasitologie, Institut national de la recherche agronomique,
37380 Nouzilly, France
d
Domaine du Magneraud, St-Pierre-d’Amilly, Institut national de la recherche agronomique,
BP 52 17700 Surg`eres, France
(Received 9 December 2002; accepted 27 August 2003)
Abstract – Selection for disease resistance related traits is a tool of choice for evidencing and
exploring genetic variability and studying underlying resistance mechanisms. In this frame-
work, chickens originating from a base population, homozygote for the B
19
major histocompat-
ibility complex (MHC) were divergently selected for either progression or regression of tumors
induced at 4 weeks of age by a SR-D strain of Rous sarcoma virus (RSV). The first generation
of selection was based on a progeny test and subsequent selections were performed on full-sibs.
Data of 18 generations including a total of 2010 birds measured were analyzed for the tumor
profile index (TPI), a synthetic criterion of resistance derived from recording the volume of
the tumors and mortality. Response to selection and heritability of TPI were estimated using a
restricted maximum likelihood method with an animal model. Significant progress was shown
in both directions: the lines differing significantly for TPI and mortality becoming null in the
“regressor” line. Heritability of TPI was estimated as 0.49 ± 0.05 and 0.53 ± 0.06 within the
progressor and regressor lines respectively, and 0.46 ± 0.03 when estimated over lines. Prelim-
inary results showed within the progressor line a possible association between one Rfp-Y type
and the growth of tumors.
chicken / selection / resistance / Rous sarcoma / Rfp-Y
†
This article is dedicated to the memory of Pierrick Thoraval (1960-2000).
∗
Corresponding author:
66 M H. Pinard-van der Laan et al.
1. INTRODUCTION
For the analysis of genetic control of health traits in domestic animals, there
is a growing interest for selection experiments as a powerful tool to explore the
genetic variability of these traits and to create extreme phenotypes allowing
the analysis of underlying mechanisms and the search for new genetic mark-
ers of disease resistance traits. Such tools are particularly developed in the
chicken for the analysis of immunoresponsiveness [31] or resistance to spe-
cific diseases [3]. Resistance to viral diseases are examples of traits for which
a genetic basis has been shown in many animal species [36]. For instance, se-
lection for resistance to Marek’s disease is one of the first successful selection
experiments in chickens [9].
Resistance to another type of avian viral disease, the Rous Sarcoma virus
(RSV), has been widely studied. Resistance to this disease is highly interest-
ing as a model of resistance to tumor growth and its study has allowed new
findings on related mechanisms and the genes involved. Indeed, early studies
on RSV stipulated that only a very restricted number of genes and even one
single gene would be involved in the control of tumor regression or progres-
sion. This was in some cases because of the easiness to select for the trait or
because of the observation of the segregation of different phenotypes [21] or
because of the particular genetic background of some inbred lines used inten-
sively for the study of the fate of RSV tumors [10, 33, 39]. Naturally, most
of the studies on RSV tumor control consider MHC as the natural candidate
of choice as far as disease resistance is concerned, and showed an effect of
the avian B-complex on either the progression or regression, as reviewed by
Schierman and Collins [38]. Some major differences between genotypes in
a given background have often been shown. For example, in an F2 cross of
two highly inbred lines homozygous for B
2
and B
5
, the most resistant geno-
type (B
2
B
2
) showed 5% of mortality and a mean Tumor Profile Index (TPI) of
2.94 and the most susceptible genotype (B
5
B
5
) showed a 93% mortality and a
mean TPI of 4.93 whereas the heterozygote showed values closer to the resis-
tant genotype than to the susceptible one [10]. Even if all the studies performed
were not able to distinguish a possible direct effect from a closely linked effect,
some clearly proved, using several recombinants in different backgrounds, that
the genetic control is associated with the B−F/B−L region rather than with
the B−G one [1, 2, 33]. Most reports studying the effect of MHC on the fate
of RSV tumors were conducted from comparisons between congenic inbred
lines or crosses between inbred lines, the possible amount of genetic variabil-
ity expressed. Some of these studies, however, allowed at the same time to
show evidence for non-MHC variation in the control of tumor fate when ge-
netic background was found to play a major role [10–12]. Using backcrosses
Selection for resistance to Rous sarcoma 67
from three partially congenic inbred lines, Cutting et al. [14] and Plachy [32]
showed that resistance to RSV is the result of complementing action of MHC
(or MHC-linked) genes and genes outside the MHC. The frequency of regres-
sor chickens observed in the backcross mating and hybrids corresponded to
the expected frequency of birds heterozygous for allelic genes at two indepen-
dent loci. Indeed, the effect of non-MHC genes has been shown to be critical
for regression of Rous sarcoma [7] using similar or identical MHC haplotypes
in different genetic backgrounds and the relative influence of MHC and non-
MHC genes was evaluated by Gebriel and Nordskog [16].
In this context, the selection experiment analysed hereafter was set up with
animals which were all serologically defined homozygous for BG
19
[15]. The
selection would therefore explore MHC polymorphism outside the BG region
and all the non-MHC variation. The aim of the study was to analyze 18 genera-
tions of selection for either progression or regression of RSV induced tumors,
to estimate genetic parameters of one resistance trait (TPI) and to present a
preliminary result on the association between the fate of the tumor and Rfp-Y
types, the second MHC gene polymorphic cluster in the chicken outside the
B-complex [5].
2. MATERIALS AND METHODS
2.1. Selection lines
A divergent selection for resistance to Rous sarcoma virus was initiated
in 1982 from a White Leghorn base population (generation G
0
) for 18 gen-
erations. The chicken line was bred at the Domaine du Magneraud (Inra,
France) in specified pathogen-free conditions. A serological survey of breeder
stocks was performed to ascertain the absence of specified pathogens includ-
ing Marek’s disease virus, avian leucosis virus, Newcastle disease virus, Gum-
boro disease virus, reovirus, infectious bronchitis disease virus, adenovirus,
pseudoadenovirus, salmonella pullorum and gallinarum, mycoplasma gallisep-
ticum and synoviae. Challenges were performed in filtered-air negative-
pressure rooms at the Station de pathologie aviaire et parasitologie at Nouzilly
(Inra, France).
The first generation of selection was performed by a progeny test. Progeny
was inoculated in the subcutaneous tissue of the wing web at 4 weeks of age
with 1000 focus-forming units per bird of a Rous Sarcoma virus strain D
identified as the Schmidt-Ruppin strain of subgroup D (provided by P. Vigier,
Institut Curie, France). The volume of the tumors was calculated 10 days post
inoculation (PI) from the three maximum dimensions of the tumor using a slide
calliper. Then the volumes were recorded every three days for one month. The
means of the maximum volume of the tumor scored at any time during this
68 M H. Pinard-van der Laan et al.
period were calculated for each sire progeny. Sires producing the upper third
and lower third of this mean distribution were assigned as “progressor” and
“regressor”, respectively. Dams were selected on the basis of their divergence
to sires, i.e., dams whose progeny showed a higher or lower mean of the max-
imum volume of tumors than the sire family were classified as progressor or
regressor, respectively. At this step, 7 sires and 21 dams (hatched in 1982 and
originating from 3 males and 8 females) and 7 sires and 21 dams (hatched in
1982 and originating from 3 males and 6 females) were selected and assigned
as “progressor” and “regressor”, respectively.
Subsequent selections, from G1 to G18, were based on full-sib family per-
formances, carrying out the same protocol of the Schmidt-Ruppin strain virus
challenge and according to the same selection criterion, i.e., maximum volume
of tumors. The numbers of animals tested are given in Table I. One generation
was produced per year, except in 1989, 1993 and 1995 where two generations
were hatched. In years 1986, 1987 and 1989, no selection was performed due
to the occurrence of positive serology to the Marek’s disease virus. The tested
animals were produced in one hatch, except in 1982, 1984 and 1991 and in
1983, where two and three hatches were produced, respectively.
From G10 onwards, the animals were selected still on full-sibs but repro-
duced within separate sublines in each line. Four sublines were derived in the
regressor line, called pe5, pe10, pe11 and pe58. Seven sublines were derived
in the progressor line, called pd2, pd4, pd5, pd8, pd10, pd1317 and pd1321.
These sublines were produced and tested in balanced size.
2.2. Recorded resistance traits: TPI, mortality, time of death
From G1 onwards, the animals were inoculated and tested as previously
described. Only, the length of the experiment may vary. For all generations,
tumor size was recorded every week from 7 to 63 days PI. In addition, the an-
imals from G6, G16 and G18 were measured until 70 days PI and the animals
from G1, G2 and G3 were measured until 99, 126 and 105 days PI, respec-
tively. Mortality was recorded daily. From the observation of the volume of
the tumor and mortality, two classical criteria were defined: score and tumor
profile index. Scores were defined weekly as follows: 0 = no palpable tumor;
1 = tumorupto1cm
3
;2= tumor between 1 and 5 cm
3
;3= tumor between
5 and 25 cm
3
;4= tumor between 25 and 50 cm
3
;5= tumor between 50 and
100 cm
3
;6= tumor over 100 cm
3
;7= death during the experiment. The
scores were used to assign a tumor profile index (TPI) as slightly modified
from Collins et al. [10]: 5 = a terminal tumor at 35 days PI; 4 = terminal
tumorat49daysPI;3= terminal tumor at 63 days PI; 2 = tumorupto1cm
3
;
1 = otherwise (tumor less than 1 cm
3
, no tumor or complete regression by the
end of the experiment).
Selection for resistance to Rous sarcoma 69
In this study, besides mortality and age at death, TPI was only analyzed
since it is the most synthetic criterion describing the resistance to the Rous sar-
coma virus. The detailed analysis of tumor growth of this selection experiment
will be the subject of another study.
2.3. Typing for MHC and Rfp-Y
Refined analysis and characterization of Rfp-Y types are described by Tho-
raval et al. [40]. Briefly, all animals of the progressor and regressor lines
were serologically typed for the B-complex as homozygous BG
19
. In addition,
RFLP typing showed no polymorphism for class IV types but different patterns
using class I and class II probes [8]. The relationship to polymorphism for the
Rfp-Y system was further assessed, revealing three different Rfp-Y haplotypes:
Yw*
15
, Yw*
16
and Yw*
17
. These assignments are tentative since sufficient care-
ful comparisons remain to be done.
2.4. Statistical analysis
A comparison between lines when performed for a given generation were
done, with a t-test for continuous traits, after checking for normality with the
UNIVARIATE procedure. Frequency values were compared with a chi square
test. The effects of Rfp-Y types on mortality were estimated using the CAT-
MOD procedure. The effect of hatch, when applicable, was tested on TPI and
mortality and was found non significant and therefore not included in further
analyses. All these tests were performed using the SAS
library [34, 35].
The heritability of the selected TPI was obtained by using VCE soft-
ware [20], applying the derivative-free restricted maximum likelihood method
(DFREML) of Meyer [30], according to the following individual animal model
(IAM):
TPI
jkm
= µ + G
j
+ S
k
+ U
jkm
+ e
jkm
(1)
where TPI
jkm
= the TPI of the mth chick;
µ = a constant;
G
j
= the fixed effect of the jth generation (0 to 18);
S
k
= the fixed effect of the kth sex of the chick;
U
jkm
= the random additive genetic effect on the TPI in the m th chick
and e
jkm
= a random error.
All relationships of the eighteen generations and data from all generations
measured during this period were used (Tab. I). The fixed effect of the gen-
eration accounted for differences in environmental and experimental condi-
tions between generations. Heritability for TPI was estimated across lines and
within both selected lines. Individual inbreeding coefficients were estimated
using the method of Meuwissen and Luo [29] using the PEDIG software [4].
70 M H. Pinard-van der Laan et al.
Table I. Number of animals measured, data recorded and Rfp-Y type analysed, per
line and generation.
Line
Year G
1
P
2
R
3
TPI
4
Rfp-Y type
5
82 0 262 X
6
ND
7
83 1 157 155 X ND
84 2 158 146 X ND
85 3 96 84 X ND
86 4 . . ND ND
87 5 . . ND ND
88 6 19 38 X ND
89a 7 . . ND ND
89d 8 . . ND ND
90 9 53 49 X X
91 10 83 47 X X
92 11 69 49 X X
93a 12 32 34 X X
93d 13 55 35 X X
94 14 59 41 X X
95a 15 45 27 X X
95d 16 42 27 X X
96 17 48 24 X X
97 18 52 24 X X
1
Generation n;
2
numbers of animals recorded in the progressor (P) line;
3
numbers of animals
recorded in the regressor (R) line;
4
tumor profile index (TPI) recorded (X
6
) or not done (ND
7
);
5
Rfp-Y type analysed (X
6
) or not done (ND
7
).
The average inbreeding level of each line was then calculated per generation.
Estimated breeding values (EBV) for TPI were estimated with the PEST soft-
ware [19] by applying model 1 and using the heritability value estimated by
VCE. The selection response was evaluated by averaging these EBV per line
and generation.
The effects of Rfp-Y type on TPI were separately estimated in the selected
lines, using the following model:
TPI
jklm
= µ + G
j
+ S
k
+ Rfp-Y
l
+ U
jklm
+ e
jklm
(2)
Selection for resistance to Rous sarcoma 71
Table II. LSMean values (± SE) for the tumor profile index (TPI) and time of death
(d), and mortality (%) in the progressor (P) and regressor (R) line, in the generations 1,
14 and 18.
N.B. Means are presented for the first and last generations (1 and 18, respectively) and
at the maximum of response (14).
Generation
11418
Line
Trait P R P R P R
TPI 2.84±0.08
a
2.04±0.08
b
3.45±0.13
a
1.11±0.16
b
1.91±0.14
a
1.22±0.21
b
Mortality (%) 66.24
a
35.48
b
74.58
a
0.00
b
25.00
a
0.00
b
Time of death (d) 49.52±1.77
a
56.23±2.30
b
34.15±2.40 . 55.82±4.41 .
a,b
Values with different superscripts indicate differences (P < 0.01) between lines within
generation.
where Rfp-Y
l
= the fixed effect of the lth Rfp-Y type and all the other terms
are as defined in model (1). The solutions were obtained using the PEST pro-
gram and the heritability values estimated previously in the lines. Differences
between Rfp-Y types were tested as contrasts by a F-value generated by PEST.
3. RESULTS
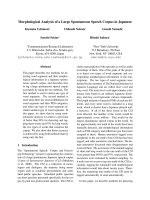
3.1. Phenotypic selection response for TPI
Phenotypic responses to selection for TPI during 18 generations expressed
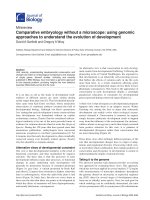
as the mean TPI per line and generation is shown in Figure 1. A significant
difference of 0.8 TPI was obtained already after the first generation of selection
between the progressor and regressor line (Tab. II). The significance of the
TPI difference between the lines remained unstable until generation 10. From
generation 11 onwards, the lines differed significantly for TPI with a maximum
difference of 2.34 in generation 14, the progressor line reaching its highest
value during the selection at 3.45 TPI (Tab. II).
3.2. Phenotypic selection response for mortality and time of death
Mortality in the progressor and regressor lines showed very similar evo-
lution as presented for the TPI in Figure 1 (data not shown). A significant
difference in mortality of 30.76% was observed between the lines at genera-
tion 1 (Tab. II). The difference remained significant (P < 0.01) during the
whole selection except in generation 9. The difference was maximum in gen-
eration 14 with 74.58% and 0% mortality for the progressor and regressor
lines, respectively and tended to decrease afterwards. From this generation
72 M H. Pinard-van der Laan et al.
Figure 1. Phenotypic response for the tumor profile index (TPI) in the regressor (Reg)
and progressor (Prog) lines during 18 generations. “*” indicates differences (P < 0.01)
in mean TPI between the lines for a given generation. “ns” indicates no significant
difference.
14 onwards, mortality was null in the regressor line. Average time at death
was compared when relevant between progressor and regressor lines (Tab. II).
After the first and third generations, the birds from the progressor line died
significantly (P < 0.01) earlier than did those from the regressor line. After-
wards, there was no clear difference for the time of death between the lines nor
for its direction nor significance.
3.3. Inbreeding of the lines
The evolution of the average inbreeding level was similar for the progressor
and regressor lines. Inbreeding increased in a linear way of about +3.51% per
generation and reached after 18 generations high levels of 66.54% and 61.06%
in the progressor and regressor lines, respectively.
3.4. Heritability of the TPI
The heritability of the Tumor Profile Index, estimated using all data and
pedigree information on all lines over 18 generations, was 0. 46 ± 0.03. When
estimated in selected lines separately, the analyses gave similar values in the
progressor line (0.49 ± 0.05) and in the regressor line (0.53 ± 0.06).
Selection for resistance to Rous sarcoma 73
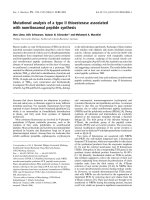
3.5. Genetic selection response for TPI
3.5.1. In progressor and regressor selected lines
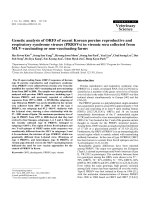
The evolution per line and generation of the mean of the breeding values for
the TPI estimated using all data and pedigree information is shown in Figure 2.
The difference between the progressor and regressor lines remained significant
although the importance of the divergence between the lines varied widely
during the course of the selection. Three phases may be seen with the lines
diverging from each other before becoming closer in terms of genetic values:
generations 0-3, 3-8 and 8-18. The second phase (3-8) corresponds to a period
where only one generation of selection could be actually performed (genera-
tion 6). As observed for phenotypic values, genetic divergence was maximum
at generation 14 (divergence of 1.75 estimated TPI) but diminished at the end
of the period analyzed here (divergence of 0.96 estimated TPI).
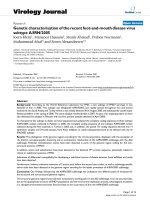
3.5.2. Within sublines of the progressor and regressor s elected lines
Since from generation 10 onwards the animals were selected and bred within
separate sublines, the estimated breeding values for the TPI were averaged per
subline as well. In the regressor line, there were no large changes in the rank-
ing of the sublines during the last eight generations (data not shown). At gen-
eration 18, the pe10 regressor subline showed a significantly higher genetic
value for the TPI than the other sublines (pe58, pe11 and pe5) (Tab. III). In
the progressor line, various trends were observed depending on the sublines
as shown in Figure 3. Finally, in generation 18, there were two significantly
distinct groups within the progressor line with a higher progressor group (pd2,
pd1321, pd8 and pd1317) versus a lower progressor group (pd10, pd4 and pd5)
(Tab. III).
3.6. Generation effect on the TPI
Generation effects, estimated from model 1, showed large variations across
generations, with “favorable” generations like generations 1 (+0.6 TPI), 12
(+0.5 TPI) or 14 (+0.3 TPI) and “unfavorable” ones like the last three genera-
tions (−0.6 TPI).
3.7. Effects of sex on TPI, mortality and time of death
Sex effect was estimated on the TPI and time at death on the whole selec-
tion. For both criteria, females appeared more sensitive, showing a higher TPI
(+0.159 TPI) and dying earlier (−4.38 days) (P < 0.01).
74 M H. Pinard-van der Laan et al.
Figure 2. Genetic response for the tumor profile index (TPI) expressed as the mean
estimated breeding values (EBV) in the regressor (Reg) and progressor (Prog) lines
during 18 generations.
Figure 3. The mean estimated breeding values (EBV) for the tumor profile index
(TPI) per subline in the progressor line from generations 10 to 18.
3.8. Effects of Rfp-Y typesonTPIandtimeofdeath
The effects of Rfp-Y types were estimated on the TPI in both lines and on the
time of death in the progressor line from generations 9 to 18. The results are
shown per line in Table IV. The different sublines of progressor and regressor
differed in Rfp-Y types but the use of the IAM could take into account these
differences to estimate the Rfp-Y type. The effect of Yw*
15
could not be esti-
mated in the regressor line because it was absent there. In the regressor line,
Selection for resistance to Rous sarcoma 75
Table III. Least Square Means of estimated breeding values for tumor profile index
(TPI) in the different sublines of the regressor (R) and progressor (P) lines in genera-
tion 18.
Line
RP
Subline LSMean ± SE Subline LSMean ± SE
pe10 0.115 ± 0.055
a
pd2 1.298 ± 0.101
a
pe58 −0.232 ± 0.055
b
pd1321 1.277 ± 0.109
a
pe11 −0.327 ± 0.055
b
pd8 1.226 ± 0.109
a
pe5 −0.339 ± 0.055
b
pd1317 1.216 ± 0.109
a
pd10 0.476 ± 0.089
b
pd4 0.349 ± 0.089
b
pd5 0.103 ± 0.089
b
a,b
Estimates with different superscripts indicate differences (P < 0.01) between sublines within
line.
Table I V. Estimates of Rfp-Y type effect on the tumor profile index (TPI) in the re-
gressor (R) and progressor (P) lines and on the time of death in the progressor (P) line
in the generations 9 to 18.
Trait
TPI Time of death (d)
Line
Rfp-Y type R P P
Yw*
16
0.000
a
0.000
a
0.00
a
Yw*
17
0.047
a
−0.930
b
5.55
b
Yw*
15
. −1.119
b
8.11
b
a,b,c
Estimates with different superscripts indicate differences (P < 0.01) between Rfp-Y types
within line.
there was no significant effect of the Rfp-Y type on TPI. In the progressor line,
the Yw*
16
type was associated with a higher sensitivity, the animals showing a
higher TPI and dying earlier than the Yw*
17
and Yw*
15
carriers.
4. DISCUSSION
Divergent selection for progression and regression to RSV showed here a
rapid and successful response since after one generation, the two selected lines
diverged significantly for TPI, mortality and age at death. A fast response to
selection for regression of tumors to a Bryan strain of RSV was first reported
76 M H. Pinard-van der Laan et al.
by Gyles and Brown [21], who used individual performances during the first
three generations and a mixture of individual and full-sib family performances
later. It agreed with a previous assumption that the number of genes controlling
resistance to RSV would be limited [15]. The number of birds showing com-
plete regression increased from 14% in the base population to 59% after six
generations, which represented 30% more than in the genetic control line. In
the data presented here, the effect of the selection in the following generations
may be questioned even more. Even if the phenotypic differences between the
progressor and the regressor lines were mostly significant for TPI or mortality,
the end values in the progressor lines were less severe than in the first, 12th
or 14th generations. Time of death did not show either any obvious correlated
response to selection but it should be analyzed more accurately, using dedi-
cated models. Selection in the regressor line was successful but likely limited
downwards in the last generations by this obligatory biological threshold of no
mortality nor tumor, without a finer selection criterion. The assumption that in
the last generation, the regressor birds would no longer be able to be infected
due to a loss of receptors for ALV-D cannot be excluded either.
The genetic analysis of the selection using estimated breeding values from
an animal model provides a more accurate estimate of response to selection
since it takes into account all the numerous relationships between individuals.
Indeed the genetic trends obtained were smoother than the phenotypic ones,
showing more clearly the different phases of selection but also showing obvi-
ously smaller differences between the lines than did the phenotypic means.
The values of heritability for TPI were rather high for a disease resistance
trait (0.46 overall lines) but in agreement with successful selections. The esti-
mates of heritabilities were equivalent in both lines in agreement with a rather
symmetric response to selection. Using other types of animal material (inbred
lines deriving from either noninbred progressor or regressor lines) and estima-
tion methods (sire component from least squares analysis), Gyles et al. [23]
found significant additive genetic variation in the regression process but not in
the progression of tumors. Urban et al. [41] using a nested analysis of vari-
ance estimated a comparable value of heritability for TPI (0.41) in an outbred
line. In addition, these authors indicate the likely presence of dominance or
maternal effects.
In the present study, females appeared more susceptible than males sug-
gesting interactions between the hormonal system and resistance mechanisms.
The effects of sex are widely varying with the disease trait or the genetic back-
ground. In an F2 cross of B
2
B
2
and B
5
B
5
lines, Collins et al. [10] did not
show any effect of sex on the fate of the RSV tumor. But Collins et al. [13] by
analysis of the metastasis later found that females display fewer disseminated
lesions than males. Gyles et al. [22] compared sexes within progressor and
Selection for resistance to Rous sarcoma 77
regressor groups and found no difference in the progressor group but in the re-
gressive one, females showed higher scores, larger tumors and took more days
to regress.
The Rfp-Y system was recently found to be an independent system from the
B-complex [5], the different subtypes identified previously using class I and
class II probes [8] being in fact Rfp-Y types. The studies on the association be-
tween the Rfp-Y system and resistance to diseases are scarce (e.g. resistance to
Marek’s disease [42, 43]). LePage et al. [26] analysed the fate of RSV (Bryan
high-titer strain of subgroup A) tumors for three haplotypes combined into five
different Rfp-Y genotypes obtained in a B
2
B
5
background. A significant effect
of Rfp-Y on TPI and mortality was found, with large differences in mortal-
ity between the most resistant and the most susceptible genotype (14.3% and
72.2%, respectively) and for TPI (1.4 and 3.4, respectively). We found a sig-
nificant but more moderate effect of the Rfp-Y type on the TPI (difference of
1 TPI) in the progressor line. The absence of an effect of Rfp-Y in the regressor
line could be due to an interaction with the genetic background or simply that
Rfp-Y genes did not play a major role in the coselection of regressor genes.
Indeed, the Yw*
15
type disappeared in the regressor line although it was asso-
ciated with a low TPI in the progressor line. Moreover, despite using an animal
model, the results should be cautiously interpreted due to the specific family
structure (sublines bred separately in this typed phase) and high inbreeding.
Several segregating crosses to break linkage disequilibrium accumulated over
generations would be needed to accurately estimate all possible Rfp-Y geno-
types against a more random background. Even more interesting would be
to combine these different Rfp-Y genotypes with different B genotypes since
complementing effects have been suggested by LePage et al. [26]. Also, as
found for the MHC, interactions between the effect of the Rfp-Y system on
the fate of RSV tumors and other factors like age at inoculation [24], virus
strain [27] or dose of virus [37] should be investigated. Senseney et al. [37] in
a cross segregating for two haplotypes (B
Q
and B
17
) found no effect of MHC
on the regression of tumors at a high dose of virus but an effect at a lower dose
of the same virus and in the same genetic stock with an allelic complemen-
tation between the two alleles, the heterozygote state showing an advantage
towards tumor regression. The superiority of other heterozygote combination
were found elsewhere [6,27,39]. The effect of the resistance genes may clearly
depend on the degree of pathogenicity of the virus.
This study opens ways to search for other genes controlling the fate of RSV
tumors. Other genetic systems have been reported as being associated with
the fate of tumors. Non-MHC alloantigens (Ea-L) affected tumor size, TPI
and mortality depending on the MHC background [28] or not [25]. Non-MHC
78 M H. Pinard-van der Laan et al.
T-lymphocyte and B-cells alloantigens were found to have an effect on re-
gression, resulting from specific interactions between alleles and genetic back-
ground [17, 18]. Also the endogenous viral genes have been found to be as-
sociated with progression or regression [32]. The current lines are segregating
for some of the ALVE genes and the role of ALVE1 is now being investigated.
Such divergent lines represent a powerful tool to look jointly for genes con-
trolling the fate of RSV tumors and underlying mechanisms. Tumor fate was
roughly analyzed by the TPI, the most synthetic criterion used so far. A finer
analysis will consider the different aspects of the growth of tumors. Also,
either the progression or regression of tumors involves complex and intricate
immune mechanisms. There are indications that some families in the current
lines may either show antiviral responses or antitumoral response. It will be
of high interest to discover whether the Rfp-Y system or the endogenous viral
genes might control these different pathways.
REFERENCES
[1] Aeed P.A., Briles W.E., Zsigray R.M., Collins W.M., Influence of different B-
complex recombinants on the outcome of Rous sarcomas in chickens, Anim.
Genet. 24 (1993) 177–181.
[2] Auclair B.W., Collins W.M., Zsigray R.M., Briles W.E., B-complex recombi-
nants and sarcoma regression: role of B-L/B-F region genes, Poult. Sci. 74
(1995) 434–440.
[3] Bacon L.D., Hunt H.D., Cheng H.H., A review of the development of chicken
lines to resolve genes determining resistance to diseases, Poult. Sci. 79 (2000)
1082–1093.
[4] Boichard D., PEDIG: a fortran package for pedigree analysis suited for large
populations, in: Proceedings of the 7th World Congress on Genetics Applied to
Livestock Production, August 19-23, 2002, INRA, Castanet Tolosan, CD-ROM
communication n
◦
28–13.
[5] Briles W.E., Goto R.M., Auffray C., Miller M.M., A polymorphic system related
to but genetically independent of the chicken major histocompatibility complex,
Immunogenetics 37 (1993) 408–414.
[6] Brown D.W., Collins W.M., Ward P.H., Briles W.E., Complementation of ma-
jor histocompatibility haplotypes in regression of Rous sarcoma virus-induced
tumors in noninbred chickens, Poult. Sci. 61 (1982) 409–413.
[7] Brown D.W., Collins W.M., Zsigray R.M., Briles W.E., A non-MHC genetic
influence on response to Rous sarcoma virus-induced tumors in chickens, Avian
Dis. 28 (1984) 884–899.
[8] Chauss´e A.M., Thoraval P., Coudert F., Auffray C., Dambrine G., Analysis of B
complex polymorphism in Rous sarcoma progressor and regressor chickens with
B-G, B-F, and B-L beta probes, Avian Dis. 34 (1990) 934–940.
Selection for resistance to Rous sarcoma 79
[9] Cole R.K., Studies on genetic resistance to Marek’s disease, Avian Dis. 12 (1968)
9–28.
[10] Collins W.M., Briles R.W., Zsigray R.M., Dunlop W.R., Corbett A.C., Clark
K.K., Marks J.L., McGrail T.P., The B locus (MHC) in the chicken: association
with the fate of RSV-induced tumors, Immunogenetics 5 (1977) 333–343.
[11] Collins W.M., Heinzelmann E.W., Corbett A.C., Zsigray R.M., Dunlop W.R.,
Rous sarcoma regression in seven highly inbred lines of White Leghorns, Poult.
Sci. 59 (1980) 1172–1177.
[12] Collins W.M., Brown D.W., Ward P.H., Dunlop W.R., Briles W.E., MHC and
non-MHC genetic influences on Rous sarcoma metastasis in chickens, Immuno-
genetics 22 (1985) 315–321.
[13] Collins W.M., Dunlop W.R., Zsigray R.M., Briles R.W., Fite R.W., Metastasis of
Rous sarcoma tumors in chickens is influenced by the major histocompatibility
(B) complex and sex, Poult. Sci. 65 (1986) 1642–1648.
[14] Cutting J.A., Watanabe D.H., Strebel F.R., McBride R.A., Complementing
MHC- and non-MHC-linked genes and resistance to avian sarcoma virus-
induced tumours in inbred lines of chickens, J. Immunogenet. 8 (1981) 215–223.
[15] Dambrine G., Millet N., Boyer J.P., Coudert F., Cauchy L., Immunog´en´etique
et r´esistance au d´eveloppement des sarcomes aviaires, Sci. Tech. Anim. Lab. 11
(1986) 15–24.
[16] Gebriel G.M., Nordskog A.W., Genetic linkage of subgroup C Rous sarcoma
virus-induced tumour expression in chickens to the IR-GAT locus of the B com-
plex, J. Immunogenet. 10 (1983) 231–235.
[17] Gilmour D.G., Collins W.M., Fredericksen T.L., Auclair B., Clark K.K.,
Urban W.E. Jr., Influence of non-MHC T lymphocyte alloantigens on regression
of Rous sarcomas in the chicken, Immunogenetics 17 (1983) 43–54.
[18] Gilmour D.G., Collins W.M., Fredericksen T.L., Urban W.E. Jr, Ward P.F.,
DiFronzo N.L., Genetic interaction between non-MHC T- and B-cell alloanti-
gens in response to Rous sarcomas in chickens, Immunogenetics 23 (1986) 1–6.
[19] Groeneveld E., PEST User’s Manual, University of Illinois, Urbana, 1990.
[20] Groeneveld E., VCE User’s Manual, Neustadt, Germany, 1995.
[21] Gyles N.R., Brown C.J., Selection in chickens for retrogression of tumors caused
by Rous sarcoma virus, Poult. Sci. 50 (1971) 901–905.
[22] Gyles N.R., Miley J.L., Brown C.J., Size, score and speed of development of
tumors in chickens in response to subcutaneous inoculations with Rous sarcoma
virus, Poult. Sci. 46 (1967) 789–795.
[23] Gyles N.R., Johnson L.W., Brown C.J., Whitfill C.E., Heritabilities of regression
and progression of Rous sarcomas in the chicken, Poult. Sci. 61 (1982) 835–841.
[24] Heinzelmann E.W., Clark K.K., Collins W.M., Briles W.E., Host age and major
histocompatibility genotype influence on Rous sarcoma regression in chickens,
Poult. Sci. 60 (1981) 2171–2175.
[25] LePage K.T., Briles W.E., Kopti F., Taylor R.L. Jr, Nonmajor histocompatibility
complex alloantigen effects on the fate of Rous sarcomas, Poult. Sci. 79 (2000)
343–348.
80 M H. Pinard-van der Laan et al.
[26] LePage K.T., Miller M.M., Briles W.E., Taylor R.L. Jr., Rfp-Y genotype affects
the fate of Rous sarcomas in B2B5 chickens, Immunogenetics 51 (2000) 751–
754.
[27] McBride R.A., Cutting J.A., Schierman L.W., Strebel F.R., Watanabe D.H.,
MHC gene control of growth of avian sarcoma virus-induced tumours in chick-
ens: a study on the role of virus strains, J. Immunogenet. 8 (1981) 207–214.
[28] Medarova Z., Briles W.E., Taylor R.L. Jr., Alloantigen system L affects the out-
come of Rous sarcomas, Exp. Biol. Med. 227 (2002) 158–163.
[29] Meuwissen T.H.E., Luo Z., Computing inbreeding coefficient in large popula-
tions, Genet. Sel. Evol. 24 (1992) 305–313.
[30] Meyer K., Restricted maximum likelihood to estimate variance components for
animal models with several random effects using a derivative-free algorithm,
Genet. Sel. Evol. 21 (1989) 317–340.
[31] Pinard-van der Laan M H., Siegel P.B., Lamont S.J., Lessons from selection
experiments on immune response in the chicken, Poult. Avian Biol. Rev. 9 (1998)
125–141.
[32] Plachy J., Korec E., Hlozanek I., Zdenkova E., Effect of the expression of an
endogenous viral gene on the growth of tumours induced by Rous sarcoma virus
in chickens, Folia Biol. (Praha) 31 (1985) 235–240.
[33] Plachy J., Benda V., Location of the gene responsible for Rous sarcoma regres-
sion in the B-F region of the B complex (MHC) of the chicken, Folia Biol.
(Praha) 27 (1981) 363–368.
[34] SAS
Institute, SAS
/STAT User’s Guide, Version 6, Fourth edn., SAS
Insti-
tute Inc., Cary, NC, USA, 1989.
[35] SAS
Institute, Procedure Guide, Version 6, Third edn., SAS Institute Inc.,
Cary, NC, USA, 1990.
[36] Schat K.A., Davies C.J., Viral diseases, in: Axford R.F.E., Bishop S.C., Nicholas
F.W., Owen J.B. (Eds.), Breeding for disease resistance in farm animals, 2nd
edn., CAB International, 2000, pp. 271–300.
[37] Senseney H.L., Briles W.E., Abplanalp H., Taylor R.L. Jr, Allelic complemen-
tation between MHC haplotypes B(Q) and B17 increases regression of Rous
sarcomas, Poult. Sci. 79 (2000) 1736–1740.
[38] Schierman L.W., Collins W.M., Influence of the major histocompatibility com-
plex on tumor regression and immunity in chickens, Poult. Sci. 66 (1987) 812–
818.
[39] Schierman L.W., Watanabe D.H., McBride R.A., Genetic control of Rous sar-
coma regression in chickens: linkage with the major histocompatibility complex,
Immunogenetics 5 (1977) 325–332.
[40] Thoraval P., Afanassieff M., Bouret D., Luneau G., Esnault E., Goto R.M.,
Chauss´e A M., Zoorob R., Soubieux D., Miller M.M., Dambrine G., Role
of nonclassical class I genes of the chicken major histocompatibility complex
Rfp-Y locus in transplantation immunity, Immunogenetics, in press.
Selection for resistance to Rous sarcoma 81
[41] Urban W.E. Jr, Zervas N.P., Collins W.M., Buck R.W., Aeed P.A., Briles W.E.,
Estimates of heritability of response to Rous sarcomas of chickens, Poult. Sci.
64 (1985) 1405–1410.
[42] Vallejo R.L., Pharr G.T., Liu H.C., Cheng H.H., Witter R.L., Bacon L.D., Non-
association between Rfp-Y major histocompatibility complex-like genes and
susceptibility to Marek’s disease virus-induced tumors in 6(3)x7(2) intercross
chickens, Anim. Genet. 28 (1997) 331–337.
[43] Wakenell P.S., Miller M.M., Goto R.M., Gauderman W.J., Briles W.E., Asso-
ciation between the Rfp-Y haplotype and the incidence of Marek’s disease in
chickens, Immunogenetics 44 (1996) 242–245.
To access this journal online:
www.edpsciences.org