Báo cáo sinh học: "QTL detection and allelic effects for growth and fat traits in outbred pig populations" ppt
Bạn đang xem bản rút gọn của tài liệu. Xem và tải ngay bản đầy đủ của tài liệu tại đây (296.59 KB, 14 trang )
Genet. Sel. Evol. 36 (2004) 83–96 83
c
INRA, EDP Sciences, 2004
DOI: 10.1051/gse:2003052
Original article
QTL detection and allelic effects for growth
and fat traits in outbred pig populations
Yoshitaka N
a∗
, Peter M. V
b
,ChrisS.H
a
a
Roslin Institute (Edinburgh), Midlothian, EH25 9PS, UK
b
Institute of Cell, Animal and Population Biology, University of Edinburgh,
West Mains Road, Edinburgh, EH9 3JT, UK
(Received 17 February 2003; accepted 25 September 2003)
Abstract – Quantitative trait loci (QTL) for growth and fatness traits have previously been
identified on chromosomes 4 and 7 in several experimental pig populations. The segregation of
these QTL in commercial pigs was studied in a sample of 2713 animals from five different pop-
ulations. Variance component analysis (VCA) using a marker-based identity by descent (IBD)
matrix was applied. The IBD coefficient was estimated with simple deterministic (SMD) and
Markov chain Monte Carlo (MCMC) methods. Data for two growth traits, average daily gain on
test and whole life daily gain, and back fat thickness were analysed. With both methods, seven
out of 26 combinations of population, chromosome and trait, were significant. Additionally,
QTL genotypic and allelic effects were estimated when the QTL effect was significant. The
range of QTL genotypic effects in a population varied from 4.8% to 10.9% of the phenotypic
mean for growth traits and 7.9% to 19.5% for back fat trait. Heritabilities of the QTL genotypic
values ranged from 8.6% to 18.2% for growth traits, and 14.5% to 19.2% for back fat. Very
similar results were obtained with both SMD and MCMC. However, the MCMC method re-
quired a large number of iterations, and hence computation time, especially when the QTL test
position was close to the marker.
QTL mapping / IBD / variance component / heritability / pig
1. INTRODUCTION
Following the first genome scan for QTL in F
2
animals from a cross between
wild boar and domestic pig [2, 14], numerous studies were performed to locate
QTL in pigs [4, 18, 24]. However, almost all the studies to date have focused
on crosses (e.g., wild boar or Chinese breeds crossed with modern European
breeds) because the power of detection of segregating QTL using line cross
∗
Corresponding author: nagamine@affrc.go.jp
Present address: National Institute of Livestock and Grassland Science, 2 Ikenodai, Tsukuba,
305-0901, Japan
84 Y. Nagamine et al.
data is greater than that using within population data [13, 30]. In addition, it
was uncertain whether detectable QTL would be segregating within a modern
commercial pig population after their long selection history [29].
We previously reported significant QTL for growth and obesity detected us-
ing least squares (LS) analysis [17] on two chromosomes, 4 and 7, within five
modern commercial pig populations [22]. The LS method is a widely used pro-
cedure and is as powerful as variance component analysis (VCA) in a simple
pedigree structure [5]. However, the paternal half-sib LS method applied does
not use potential information from segregation on the maternal side. Further-
more, another drawback of LS is that it may be used to estimate the differences
between two allelic effects of QTL within a parent, but not the effect of each al-
lele. On the other hand, VCA, using a model with polygenic and QTL effects,
has some advantages for the detection of QTL. This procedure may be em-
ployed to estimate the polygenic and the QTL effect using information from
the complete pedigree and VCA also allows the simultaneous estimation of
heritabilities for both polygenic and QTL effects [1, 11, 21, 32]. Finally, each
allelic effect of a QTL may be obtained, which provides direct information for
marker-assisted selection [7].
George et al. [8] introduced a two-step approach for VCA. The first step
involved the construction of an IBD matrix, while the next step was variance
component estimation by restricted maximum likelihood to identify the QTL
position. They applied the Markov chain Monte Carlo (MCMC) method using
LOKI software [15] to estimate IBD coefficients. MCMC is a fairly flexible
method, since it can handle pedigrees of any structure and cope with missing
marker information. However, one major problem with this method is the com-
putational time required. Nagamine et al. [21] and several researchers [23, 25]
introduced the simple deterministic (SMD) method to estimate IBD coeffi-
cients for a population with a simple two-generation pedigree. This procedure
is faster than MCMC and also copes with missing marker information
Following the determination of QTL within populations by LS
analyses [22], we used the same dataset and applied both methods, SMD and
MCMC, in VCA to estimate the QTL position for growth and fat traits. Fur-
thermore, using the estimated QTL position, the QTL allelic effect and her-
itability were calculated. Using data from a separate study of different pig
populations, de Koning and colleagues [5] used an alternative variance com-
ponent approach for QTL detection. However, to our knowledge, this is the
first report on the estimation of QTL genotypic and allelic effects, and simulta-
neous determination of heritabilities, polygene and the QTL genotypic effects
within commercial pig populations.
QTL in outbred pig population 85
2. MATERIALS AND METHODS
2.1. Data
Within a total of 2713 animals, 576 Large White from population A, 580
Duroc-Large White from synthetic population B, 427 Yorkshire and Large
White from synthetic population C, 531 Large White from population D and
599 Landrace from population E were genotyped. The numbers of sires, dams
and progeny across the populations ranged from 10 to 12, 91 to 178, and 326
to 452, respectively. Two growth traits, average daily gain on test (DGT) and
average daily gain through whole life from birth to the end of test (DGW),
and back fat thickness (BFT), were measured in the progeny generation. Pop-
ulation A additionally had phenotypic values from the parental generation.
Standardized trait observations and weight, which was applied to adjust fat
measurements, were used for a subsequent joint analysis of data from all five
populations.
2.2. Markers
A maximum of eight and seven markers were genotyped on chromosomes
4 and 7, respectively. Specifically, the markers were S0001, SW45, SW35,
SW839, S0107, S0217, SW841 and S0073 on chromosome 4, and SW1354,
S0064, SWR1078, SW1344, TNFB, SW2019 and S0102 on chromosome 7. The
numbers of genotyped markers ranged from 5 to 8 on chromosome 4 and 5
to 7 on chromosome 7 across the populations. Parents and progeny of all the
populations were genotyped with both end markers, specifically, S0001 and
S0073 on chromosome 4 (except population A), and SW1354 and S0102 on
chromosome 7. Chromosome 4 from population A had 6 markers and S0001
and SW841 were used as the end markers. Selective genotyping was performed
by identifying the 20% best and 20% worst progeny with respect to growth
rate within the sire family. Data from all genotyped animals and the mapping
software CRI-MAP [10] were used to confirm that no alternative marker orders
were significantly better than the published consensus marker order (using the
FLIPS option) and to estimate the distances between markers.
2.3. Estimation of the IBD coefficient
Two methods, MCMC and SMD, were employed to estimate IBD coeffi-
cients. The software, LOKI [15], was applied to estimate IBD coefficients with
MCMC. SMD was developed by Nagamine et al. [21], based on the probabil-
ity of inheriting alleles from a parental gamete [17]. If p
k
and p
j
represent
the probability of inheriting the first paternal allele for animals j and k at a
given location, the paternal allelic IBD coefficient (PA-IBD) between them is
86 Y. Nagamine et al.
estimated with the following equation:
PA-IBD = [p
j
p
k
+ (1 − p
j
)(1 − p
k
)]/2.
This is the genotypic IBD coefficient between half-sibs. The maternal allelic
IBD (MA-IBD) coefficient is estimated similarly. The sum of PA-IBD and
MA-IBD coefficients is taken as the genotypic IBD for full-sibs.
2.4. Model and test statistics
The following animal model was used:
y = Xβ + Zu + Zw + e
where the vector y represents the phenotypic values, X is the design matrix for
fixed effect, and Z is the design matrix for random effects [16]. The remaining
vectors are the estimated values, u: polygenic effect, w: QTL genotypic effect,
e: error and β:fixedeffect. Sex was used as a fixed effect for growth traits and
both sex and regression on weight were employed as fixed effects for fat traits.
Variance components due to the random, polygenic and QTL genotypic effects
were estimated by restricted maximum likelihood using ASReml software [9].
To estimate the presence of a QTL against the null hypothesis of no QTL at a
test position, the likelihood ratio (LR) test statistic, Log LR = −2ln(L
0
− L
1
)
was calculated, where L
0
and L
1
represent the respective likelihood values with
the hypothesis, absence (H
0
) or presence (H
1
) of a QTL. The chi-square distri-
bution with one degree of freedom (χ
2
1
) was employed to provide approximate
threshold values [8,32]. In the context in which it is used here, the distribution
of LogLR for the test at a single point in the linkage group is a 50:50 mixture
where one component mixture is a peak at 0 and the other is χ
2
1
. Therefore, the
top 2% and 10% values from χ
2
1
distribution, which represent approximately
1% and 5% point-wise significant levels of the F test, were used as threshold
values.
2.5. Conversion of QTL genotypic effect into allelic effect
After estimating the QTL genotypic effect (w), we converted the values ob-
tained into QTL allelic effects (v) [21]. Here, G is for allelic IBD matrix (size
2n × 2n for n animals), and Q is for genotypic IBD matrix (size n × n). In case
of no interaction between QTL allelic effects:
w = Tv
where T is an incident matrix relating each animal to its two allelic
effects [20, 27]. This equation implies that the sum of two allelic effects from
QTL in outbred pig population 87
an animal, v
11
and v
12
, is equivalent to his genotypic effect w
1
(= v
11
+ v
12
).
However, the conversion from w to v is less straightforward:
v = (1/2)GT
Q
−1
w.
Hence, v can be calculated without the inverse of G (2n × 2n) and requires
only the inverse of Q (n × n). In fact, it is not necessary to calculate Q
−1
for
this conversion, since it is already obtained for use in mixed model equations
to estimate w.
3. RESULTS
3.1. Marker distances
The estimated marker distances (relative distance from the first marker: cM)
were S0001 (0.0), SW45 (11.9), SW35 (11.9), SW839 (15.6), S0107 (17.1),
S0217 (19.8), SW841 (23.9) and S0073 (28.4) on chromosome 4, and SW1354
(0.0), S0064 (6.4), SWR1078 (8.9), SW1344 (17.0), TNFB (27.5), SW2019
(29.3) and S0102 (39.3) on chromosome 7. These values are consistent with
other published results ( />3.2. Significant QTL effect
The MCMC method employs an iterative approach to estimate IBD coeffi-
cients. Initially, test positions were spaced at 3 to 5 cM intervals and 5000 iter-
ations were used for each test positions. After identifying the regions with the
higher test statistics, positions around these at 1 cM intervals were examined.
However, test positions within 1 cM of the markers required more than 20 000
iterations to produce an IBD matrix that was not singular.
With the LS method, five out of 26 combinations of trait, population and
chromosome were significant at the nominal 1% level. All these combinations
were also significant when estimated with both SMD and MCMC methods in
VCA (Tab. I). However, combinations that were significant at the nominal 5%
level with LS were not usually significant in VCA. Only in one case (back fat
depth on chromosome 4 in population C) were the VCA analyses significant
when the LS analysis was not. The test statistic from the two VCA methods,
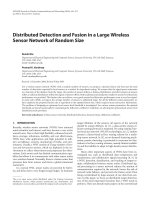
SMD and MCMC, exhibited a high correlation of 0.95 (Fig. 1). The correla-
tions of test statistic from LS and two VCA methods are 0.70 between LS and
SMD and 0.71 between LS and MCMC.
88 Y. Nagamine et al.
Figure 1. Test statistic
(LogLR) from simple deter-
ministic (SMD) and MCMC
methods.
Table I. QTL test statistics for least squares and variance component analyses.
Chromosome 4 Chromosome 7
Population Trait LS SMD MCMC LS SMD MCMC
A DGT 1.30 0.00 0.00 2.36** 6.44
++
6.00
++
BFT 1.25 1.11 1.52 2.01** 4.71
+
4.09
+
B DGT 1.99* 1.38 0.50 1.28 0.01 0.18
DGW 2.48** 4.98
+
2.80
+
1.00 0.00 0.10
BFT 1.99* 1.77 1.51 1.86* 2.30 3.40
+
C DGT 1.12 2.16 1.62 1.48 0.00 0.00
DGW 1.23 0.00 0.00 1.09 0.74 0.92
BFT 1.26 5.74
++
3.41
+
2.87** 4.15
+
4.56
+
D DGT 0.81 0.00 0.00 1.87* 2.08 1.74
DGW 0.47 0.00 0.00 2.64** 6.34
++
6.26
++
BFT 1.11 0.14 0.08 1.74 4.88
+
4.94
+
E DGT 1.79 0.30 0.26 0.82 0.00 0.00
BFT 0.63 0.12 0.02 2.02* 1.00 0.60
LS: least squares analysis; SMD: variance component analysis using simple deterministic
method; MCMC: variance component analysis using MCMC method.
DGT: average daily gain on test; DGW: average daily gain of whole life from birth to end of
test; BFT: back fat thickness.
** and *: significant with 1 and 5% level for F test in LS, respectively. ++ and +: significant
with 2 and 10% with one degree of freedom chi-square test, respectively. The threshold values
of 2 and 10% from chi-square test represent approximately 1 and 5% significant levels of F test,
respectively.
QTL in outbred pig population 89
3.3. QTL position and heritability
The QTL positions and heritabilities from five combinations of population,
trait and chromosome, which displayed significant levels using all methods,
are shown in Table II.
Two combinations showed slightly different peaks between the two meth-
ods. The peaks for DGW from population B were 25 and 28 cM on chromo-
some 4 and the peaks for BFT from population C were 35 and 39 cM on chro-
mosome 7. However, the peaks obtained from the two methods were always
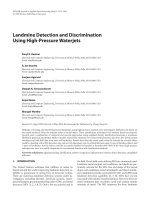
bracketed by the same pair of markers. The curves of the QTL test statistic on
test positions were shown in Figure 2 for three traits as examples.
The polygenic heritability, h
2
p
(=σ
2
p
/(σ
2
p
+ σ
2
q
+ σ
2
e
)), and the QTL geno-
typic heritability, h
2
q
(=σ
2
q
/(σ
2
p
+ σ
2
q
+ σ
2
e
)), were estimated at the estimated
QTL position. The largest difference between QTL heritabilities from SMD
and MCMC was for DGW on chromosome 4 from population B, where the
estimates were 14.0% and 8.6%, respectively.
3.4. QTL genotypic and allelic effect
Using IBD matrices obtained from the SMD method, the QTL genotypic ef-
fect at the peak position was converted into allelic effects. The genotypic and
allelic effects of sires for five combinations are shown in Table III. Some com-
binations had a large range of genotypic effects across sires. For example, the
ranges of genotypic effect for DGT and BFT from population A were 112.6 g
(=62.5 − (−50.1)) and 1.77 mm (=0.80 − (−0.97)), respectively. These values
are 10.9% and 19.5%, respectively, of the appropriate phenotypic mean. The
range of genotypic effects in a population varied from 4.8% to 10.9% of the
phenotypic mean for growth traits and 7.9% to 19.5% for BFT.
In a marker-assisted selection scheme, the differences between QTL allelic
effects within a sire are important, since a choice of one of the two QTL alle-
les related to the marker has a large effect on the genetic performance of the
progeny. Some sires had substantially different values for the estimates of the
two allelic effects. For example, for DGT from population A, sire 1 had two
allelic effects, −58.7 and 17.3 g, which conferred the largest difference, 76 g
(=17.3 − (−58.7)), across sires in population A. The two other sires, 2 and 10,
also displayed significantly divergent values of 56 g and 45 g, respectively.
LS analyses on these three sires revealed the most significant t-values [22].
Across the populations, sires with a significant QTL effect estimated with LS
generally displayed considerably divergent estimates of allelic effects in VCA.
A joint dataset comprising data from all five populations were analysed us-
ing the SMD and MCMC VCA methods. Only BFT on chromosome 7, anal-
ysed by the MCMC method reached the significance level (10%). In this case,
90 Y. Nagamine et al.
Table II. QTL positions and heritabilities by VCA using simple deterministic (upper line) and MCMC (lower line) methods.
Chromosome Bracket Peak Bracket Variance and h
2
Population Trait Marker1 (cM) Position Marker2 (cM) σ
2
p
(h
2
p
) σ
2
q
(h
2
q
) σ
2
e
Chromosome 4
B DGW (g) SW841 (23.9) 25 S0073 (28.4) 1134 (9.4) 1694 (14.0) 9298
28 1380 (11.4) 1036 (8.6) 9703
Chromosome 7
A DGT (g) SW2019 (29.3) 30 S0102 (39.3) 0 (0.0) 2171 (18.2) 9742
30 233 (1.9) 1895 (15.9) 9758
D DGW (g) SW1354 (0.0) 6 S0064 (6.4) 780 (20.0) 522 (13.1) 2681
6 822 (20.6) 494 (12.4) 2669
A BFT (mm) SWR0178 (8.9) 18 TNFB (27.5) 0.465 (18.0) 0.437 (16.9) 1.682
18 0.522 (20.2) 0.375 (14.5) 1.682
C BFT (mm) SW2019 (29.3) 39 S0102 (39.3) 1.149 (36.5) 0.605 (19.2) 1.391
35 1.266 (40.0) 0.549 (17.3) 1.353
DGT: average daily gain on test; DGW: average daily gain of whole life from birth to end of test; BFT: back fat thickness. σ
2
p
and h
2
p
: polygenic
variance and its heritability; σ
2
q
and h
2
q
: QTL genotypic variance and its heritability; σ
2
e
: error variance. Bracket marker1 and 2: nearest left and right
side markers to the peak position. The upper line is from SMD and the lower line is from MCMC for each trait.
QTL in outbred pig population 91
Figure 2. (a) QTL position for DGT, daily gain on test, using chromosome 7 from
population A. (b) QTL position for DGW, whole life time daily gain, using chromo-
some 7 from population D. (c) QTL position for BFT, back fat thickness, using chro-
mosome 7 from population A. Seven markers SW1354, S0064, SWR1078, SW1344,
TNFB, SW2019 and S0102 (from left to right) were used for population D and 5 mark-
ers, excluding S0064 and SW1344, were used for population A.
92 Y. Nagamine et al.
Table III. QTL genotypic and allelic effect of sires by VCA using simple determin-
istic (SMD) method.
Chromosome Phenotypic Genotypic effect (SE) Allelic effect
Population Trait mean Min Max Min Max MaxDiff
Chromosome 4
B DGW(g) 640 −26.8 (33.2) 41.2 (33.1) −31.4 51.0 60.7
Chromosome 7
A DGT(g) 1034 −50.1 (25.3) 62.5 (34.2) −58.7 53.9 76.0
D DGW(g) 642 −15.9 (19.7) 15.1 (19.7) −17.6 26.3 38.3
A BFT(mm) 9.05 −0.97 (0.52) 0.80 (0.52) −0.56 0.78 0.97
C BFT(mm) 8.64 −0.25 (0.62) 0.43 (0.62) −0.49 0.55 0.78
DGT: average daily gain on test; DGW: average daily gain of whole life from birth to end of test;
BFT: back fat thickness. Min and Max: maximum and minimum estimated values across sires
within each population. MaxDiff of allelic effects: the maximum difference between two allelic
effects in the sire. For example, Sire 1 for DGT in population A had two allelic effects, −58.7
and 17.3 g, and it gave the largest range, 76 g (=17.3 − (−58.7)), across sires in population A.
the test statistic surface was relatively flat and the peak for BFT was not very
clear. The minimum test statistic was 2.2 between 20 cM and 38 cM and, the
maximum value was only 3.0 at 26 and 27 cM.
4. DISCUSSION
In this study we have detected QTL segregating in several outbred commer-
cial pig populations and estimated the QTL heritabilities and the associated
genotypic effects. Following studies by Fernando and Grossman [7], showing
how information on a single marker-linked QTL could be incorporated into
the mixed model equations, several simulation studies of marker-assisted se-
lection were reported [20, 26]. The efficiency of using marker information is
dependent on several factors, such as QTL allelic effect and recombination
rates between QTL and markers. These parameters have not been reported
within outbred pig populations. In fact, prior to reports on QTLs within closed
populations [5,22], the issue of whether QTL would be found within a modern
pig population was a matter of debate. Studies such as the one reported here
will help to resolve this debate.
Meuwissen and Goddard [20] showed that a change in the recombination
rate from 0.05 to 0.2 was accompanied by a decrease in genetic gain from
marker-assisted selection of 7.7% in simulation. Recombination rates of 0.05
and 0.2 correspond to 5.3 cM and 25.5 cM in a Haldane map distance [12].
In our study, the average distances between markers were 4.1 cM and 6.6 cM
QTL in outbred pig population 93
for chromosome 4 and 7, respectively. Such small distances between markers
can increase the genetic gain in practice. Spelman and Bovenhuis [26] as-
sumed QTL heritabilities of 5 and 10%. These values are moderate, compared
with our results. In our study, there is a possibility of overestimation of her-
itability for growth traits [19], since the best and worst progeny groups with
respect to growth rate within the sire family were genotyped. However, BFT
was not expected to be significantly influenced by selective genotyping [22].
The minimum heritability for BFT was 14.5% (Tab. II). The results reported
here are thus within the range used in simulation studies and suggest some
optimism for the eventual application of marker-assisted selection. However,
since all estimated variance components from our data set are prone to large
standard errors, a larger number of animals and a more complicated model,
e.g., including QTL dominance effect, may be required to estimate more reli-
able parameters for breeding plans.
The confidence interval for QTL position is also important in practice to
determine the breeding strategy [30]. However, bootstrapping cannot be easily
applied to variance component analysis with general pedigrees and the LOD
drop-off method is likely to be biased in real data sets [19, 28, 30]. The further
study is required to develop good estimates of confidence intervals for VCA.
There are a few reports on QTL within a closed pig population [5,22]. How-
ever, several studies have focused on the detection of QTL on chromosome 4
and 7 using breed crosses [2, 4, 18]. Bidanel et al. [3] studied a Meishan and
Large White cross and reported highly significant QTL effects for growth traits
between markers, SLA and S0102, on chromosome 7. This position is very
close to our detected position from population A. Wang and colleagues [31]
also determined the QTL for growth rate on chromosome 7, using Chinese and
European crosses. de Koning et al. [4] reported a highly significant QTL for
back fat around the marker, S0102, where the QTL was identified in population
C in our study. It is not surprising that large-effect genes for growth trait are
located on the same chromosome across the breeds. However, the main issue
that requires clarification is how QTL alleles that have large effects between
lines or breeds, are maintained within modern pig populations. A number of
hypotheses have been put forward to explain this phenomenon. For example,
pleiotropy, i.e., a gene having more than one phenotypic effect [6], may aid
in the maintenance of QTL alleles with effects in different directions on two
traits.
VCA had some additional advantages compared with LS analysis, as the
QTL genotypic and allelic effects could be determined with this method when
the QTL effect was significant. The heritabilities of polygenic effects and of
QTL effects were also estimated simultaneously. These advantages can be ob-
tained from both the SMD and MCMC approaches, and the results from the
94 Y. Nagamine et al.
two approaches correlated well. However, the MCMC approach is computa-
tionally intensive, as it required a large number of iterations, especially when
the QTL test position was close to the marker. These results, showing the
detection of QTL within commercial populations and the estimation of their
effects with a computationally tractable approach is encouraging for the use of
marker-assisted selection. However, more data are required to estimate reliable
parameters across a range of traits and hence to help elucidate the reason for
the presence of a QTL with large effects within a heavily selected population
before marker-assisted selection can be applied in the confident knowledge that
there will be no unforeseen side effects.
ACKNOWLEDGEMENTS
We thank the commercial partners, Cotswold, JSR Healthbred, PIC Inter-
national, Rattlerow Ltd and Newsham Ltd for generous support in supplying
blood or tissue samples and phenotypic information. This project was funded
by the Biotechnology and Biological Sciences Research Council under the
Sustainable Livestock Production LINK program.
REFERENCES
[1] Almasy L., Blangero J., Multipoint quantitative-traits linkage analysis in general
pedigrees, Am. J. Hum. Genet. 62 (1998) 1198–1211.
[2] Andersson L., Haley C.S., Ellegren H., Knott S.A., Johansson M., Andersson K.,
Andersson-Eklund L., Edfors-Lilja I., Fredholm M., Hasson I., Hakansson J.,
Lundstr¨om K., Genetic mapping of quantitative trait loci for growth and fatness
in pigs, Science 263 (1994) 1771–1774.
[3] Bidanel J.P., Milan D., Iannuccelli N., Amigues Y., Boscher M.Y., Bourgeois F.,
Caritez J.C., Gruand J., Le Roy P., Lagant H., Quintanilla R., Renard C., Gellin
J., Ollivier L., Chevalet C., Detection of quantitative trait loci for growth and
fatness in pigs, Genet. Sel. Evol. 33 (2001) 289–309.
[4] de Koning D.J., Janss L.L.G., Rattink A.P., Van Oers P.A.M., De Vries B.J.,
Groenen M.A.M., Van Der Poel J.J., De Groot P.N., Brascamp E.W., Van Aren-
donk J.A.M., Detection of quantitative traits loci for back fat thickness and in-
tramuscular fat content in pigs (Sus scrofa), Genetics 152 (1999) 1679–1690.
[5] de Koning D.J., Nagamine Y., Evans G., Haley C.S., QTL detection in outbred
populations, in: Proceedings of the 7th World Congress on Genetics Applied
to Livestock Production, Montpellier, August 19–23, 2002, INRA, Castanet-
Tolosan, pp. 657–660.
[6] Falconer D.S., Mackay T.F.C., Introduction of quantitative genetics, 4th edn.,
Longman limited, London, 1996.
QTL in outbred pig population 95
[7] Fernando R.L., Grossman M., Marker assisted selection using best linear unbi-
ased prediction, Genet. Sel. Evol. 21 (1989) 467–477.
[8] George A.W., Visscher P.M., Haley C.S., Mapping quantitative trait loci in com-
plex pedigrees, Genetics 156 (2000) 2081–2092.
[9] Gilmour A.R., Cullis B.R., Welham S.J., Thompson R., ASREML. Program user
manual. Orange agricultural Institute, NSW, 1999.
[10] Green P., Falls K., Crooks S., Documentation for CRIMAP version 2.4, Wash-
ington University School of Medicine, Saint Louis, 1990.
[11] Grignola F.E., Hoeschele I., Tier B., Mapping quantitative trait loci in outcross
populations via residual maximum likelihood. I. Methodology, Genet. Sel. Evol.
28 (1996) 479–490.
[12] Haldane J.B.S., The combination of linkage values, and the calculation of dis-
tances between the loci of linked factors, J. Genet. 8 (1919) 299–309.
[13] Haley C.S., Knott S.A., A simple method for mapping quantitative trait loci in
line crosses using flanking markers, Heredity 69 (1992) 315–324.
[14] Haley C.S., Knott S.A., Elsen J.M., Mapping quantitative trait loci in crosses
between outbred lines using least squares, Genetics 136 (1994) 1195–1207.
[15] Heath S.C., Markov chain Monte Carlo segregation and linkage analysis for oli-
gogenic models, Am. J. Hum. Genet. 61 (1997) 748–760.
[16] Henderson C.R., Application of linear models in animal breeding, 1st edn., Uni-
versity of Guelph, Ontario, 1984.
[17] Knott S.A., Elsen J.M., Haley C.S., Method for multiple-marker mapping of
quantitative trait loci in half-sib populations, Theor. Appl. Genet. 93 (1996)
71–80.
[18] Knott S.A., Marklund L., Haley C.S., Andersson K., Davies W., Ellegren H.,
Fredholm M., Hansson I., Hoyhem B., Lundstr¨om K., Moller M., Andersson L.,
Multiple marker mapping of quantitative trait loci in a cross between outbred
wild boar and large white pigs, Genetics 149 (1998) 1069–1080.
[19] Martinez M.L., Vukasinovic N., Freeman A.E., Fernando R.L., Mapping QTL
in outbred populations using selected samples, Genet. Sel. Evol. 30 (1998)
453–468.
[20] Meuwissen T.H.E., Goddard M.E., The use of marker haplotypes in animal
breeding schemes, Genet. Sel. Evol. 28 (1996) 161–176.
[21] Nagamine Y., Knott S.A., Visscher P.M., Haley C.S., Simple deterministic
identity-by-descents coefficients and estimation of QTL allelic effects in full and
half sibs, Genet. Res. 80 (2002) 237–243.
[22] Nagamine Y., Haley C.S., Sewalem A., Visscher P.M., Quantitative trait loci
variation for growth and obesity between and within lines of pigs (Sus scrofa),
Genetics 164 (2003) 629–635.
[23] Pong-Wong R., George A.W., Woolliams J.A., Haley C.S., A simple and rapid
method for calculating identity-by-descent matrices using multiple markers,
Genet. Sel. Evol. 33 (2001) 453–471.
[24] Rohrer G.A., Keele J.W., Identification of quantitative trait loci affecting carcass
composition in swine. I. Fat deposition traits, J. Anim. Sci. 76 (1998) 2247–2254.
96 Y. Nagamine et al.
[25] Sorensen A.C., Pong-Wong R., Windig J., Woolliams J.A., Precision of methods
for calculating identity-by-descent matrices using multiple markers, Genet. Sel.
Evol. 34 (2002) 557–579.
[26] Spelman R.J., Bovenhuis H., Genetic response from marker assisted selection in
an outbred population for differing marker bracket sizes and with two identified
quantitative trait loci, Genetics 148 (1998) 1389–1396.
[27] Van Arendonk J.A.M., Tier B., Kinghorn B.P., Use of multiple genetic markers
in prediction of breeding values, Genetics 137 (1994) 319–329.
[28] van Ooijen J.W., Accuracy of mapping quantitative trait loci in autogamous
species, Theor. Appl. Genet. 84 (1992) 803–811.
[29] Visscher P.M., Haley C.S., Utilizing genetic markers in pig breeding pro-
grammes, Anim. Breed. Abstr. 63 (1995) 1–8.
[30] Visscher P.M., Haley C.S., Detection of putative quantitative trait loci in crosses
under infinitesimal genetic models, Theor. Appl. Genet. 93 (1996) 691–702.
[31] Wang L., Yu T.P., Tuggle C.K., Liu H.C., Rothschild M.F., A directed search for
quantitative trait loci on chromosome 4 and 7 in pigs, J. Anim. Sci. 76 (1998)
2560–2567.
[32] Xu S., Atchley W.R., A random model approach to interval mapping of quanti-
tative trait loci, Genetics 141 (1995) 1189–1197.
To access this journal online:
www.edpsciences.org