Báo cáo sinh học: " Linkage disequilibrium and the genetic distance in livestock populations: the impact of inbreeding" pptx
Bạn đang xem bản rút gọn của tài liệu. Xem và tải ngay bản đầy đủ của tài liệu tại đây (830.11 KB, 16 trang )
Genet. Sel. Evol. 36 (2004) 281–296 281
c
INRA, EDP Sciences, 2004
DOI: 10.1051/gse:2004002
Original article
Linkage disequilibrium and the genetic
distance in livestock populations: the impact
of inbreeding
Jérémie N
∗
, Philippe V. B
∗∗
Unité de génétique, Faculté d’ingénierie biologique, agronomique et environnementale,
Université catholique de Louvain, Croix du sud 2 box 14, 1348 Louvain-la-Neuve, Belgium
(Received 21 March 2003; accepted 22 January 2004)
Abstract – Genome-wide linkage disequilibrium (LD) is subject to intensive investigation in
human and livestock populations since it can potentially reveal aspects of a population history,
permit to date them and help in fine-gene mapping. The most commonly used measure of LD
between multiallelic loci is the coefficient D
. Data based on D
were recently published in
humans, livestock and model animals. However, the properties of this coefficient are not well
understood. Its sampling distribution and variance has received recent attention, but its expected
behaviour with respect to genetic or physical distance remains unknown. Using stochastic sim-
ulations of populations having a finite size, we show that D
fits an exponential function having
two parameters of simple biological interpretation: the residual value (rs)towardswhichD
tends as the genetic distance increases and the distance R at which this value is reached. Proper-
ties of this model are evaluated as a function of the inbreeding coefficient (F). It was found that R
and rs increase when F increases. The proposed model offers opportunities to better understand
the patterns and the origins of LD in different populations and along different chromosomes.
Linkage disequilibrium / livestock / inbreeding / genetic distance / exponential function
1. INTRODUCTION
Linkage (or gametic) disequilibrium is useful in revealing past genetically
important events, in dating them and in fine-gene mapping [1,2,4,8]. However,
the relationship between linkage disequilibrium (LD) and the genetic distance
in different population structures is not well understood. For biallelic loci in a
finite population and when LD is measured with ∆
2
, the squared correlation of
allele frequencies (Eq. (1), where p
i
, q
j
and p
ij
are respectively frequencies of
∗
Present address: Centre International de recherche sur le Cancer (CIRC), 150 cours Albert
Thomas, 69008, Lyon, France
∗∗
Corresponding author:
282 J. Nsengimana, P.V. Baret
alleles i and j, and of the haplotype ij, see [10]), the expected value of LD at
equilibrium drift-recombination is a function of the recombination rate θ and
of the effective population size N
e
(Eq. (2), see [20]).
∆
2
=
p
ij
− p
i
q
j
2
p
i
q
j
(
1 − p
i
)
1 − q
j
(1)
E
∆
2
=
1
1 + 4N
e
θ
· (2)
Although the original symbol used to represent the correlation of allelic fre-
quencies is r
2
[10], the symbol ∆
2
is also commonly used (see e.g. [6]) and
we chose this notation because r
2
will be used to measure the determination
coefficient of a model fitting.
If the population size can be inferred and the equilibrium drift-
recombination assumed, equation (2) expresses the LD as a function of the ge-
netic distance. However, this model is expected to hold if LD results only from
genetic drift (the initial linkage equilibrium is assumed) and if 4N
e
θ>20 [11].
In animal breeding, there may be a high initial level of LD resulting from the
selection of a few breeding stocks that are crossed in half-sib designs by the
way of artificial insemination or resulting from admixture. Due to this initial
LD, equation (2) does not hold in most livestock populations. In addition, the
validity of equation (2) is hampered by the fact that we do not have any in-
formation on whether there is equilibrium between drift and recombination in
livestock populations.
Another limitation of equation (2) is that the interval of variation for the co-
efficient ∆
2
depends on allelic frequencies. According to Lewontin [13], there
is no measure of LD completely independent from allelic frequencies due to
the nature of LD itself (i.e. the non-random allelic association). However, an
appropriate standardisation can provide a measure of LD that has an inter-
val of variation independent from allelic frequencies. Zapata and Visedo [23]
demonstrated that, although the coefficient ∆
2
is standardised, it varies from
−1to+1 if and only if allelic frequencies are similar at both loci, otherwise
this interval is smaller. Evidence was given that, due to this fact, measuring LD
with ∆
2
can suggest a wrong relationship between LD and the genetic distance
while making a true relationship undetectable [23]. Consequently, Zapata and
Visedo [23] recommended to preferably use the coefficient D
, whose interval
of variation is allelic frequencies independent.
The coefficient D
ij
between two alleles i and j on two loci was defined by
Lewontin [12] equations (4) to (6) where symbols have the same meaning as in
LD and the genetic distance in livestock 283
equation (1) and extended to pairs of multiallelic loci by Hedrick [9] (Eq. (3)
where N
A
and N
B
are numbers of alleles on loci A and B).
D
= D
AB
=
N
A
i
N
B
j
p
i
q
j
D
ij
(3)
with
D
ij
=
D
ij
D
max
(4)
D
ij
= p
ij
− p
i
q
j
(5)
and
D
max
= min
p
i
q
j
,
(
1 − p
i
)
1 − q
j
if D
ij
< 0
D
max
= min
(
1 − p
i
)
q
j
, p
i
1 − q
j
if D
ij
> 0.
(6)
Coefficients D
ij
and D
ij
(Eqs. (4) and (5)) can take positive and negative val-
ues, indicating that alleles are in a coupling or a repulsive state while D
AB
(Eq. (3)) takes only positive values. In the following sections, we use the nota-
tion D
for LD between pairs of multiallelic loci (D
AB
).
There is an increasing interest in the use of this coefficient in LD analyses at
the chromosome or the whole genome level as well as in model animals such as
Drosophila [19, 26], in livestock [7, 15,21] and in human populations [18,25].
The assessment of properties of this coefficient is requiring considerable atten-
tion (e.g. sampling distribution and variance, see [24]). However, the behaviour
of D
against the genetic or physical distance has not been implicitly investi-
gated and, as a consequence, estimates of D
between large sets of markers
are difficult to interpret. It is not clear in which circumstance this coefficient
is expected to correlate with the distance between markers. We describe here-
under a few empirical studies that dealt with this issue although no consensual
conclusion has so far emerged.
McRae et al. [15] reported a significant negative correlation between D
and the genetic distance in domesticated sheep in New Zealand (r = −0.34,
P < 0.001) whereas, using a similar marker density (∼1 per 10 cM), Tenesa
et al. [21] did not find any such correlation in domesticated cattle in the United
Kingdom. At a much finer scale (1 marker per 60 bp), Riley et al. [19] also
failed to find a significant correlation between D
and the physical distance in
Drosophila pseudoobscura (r = −0.009, P > 0.9).
Zapata et al. [25] found a weak but significant correlation between D
and the genetic distance on the human chromosome 11p15 (r = −0.226,
284 J. Nsengimana, P.V. Baret
P = 0.037) while the correlation between D
and the physical distance was not
significant (r = −0.151, P = 0.079). With only pairs of coupling alleles (posi-
tive D
ij
), this correlation was dependent on the allelic frequencies (r = −0.192,
P = 0.019 for alleles at frequency >6% and r = −0.284, P = 0.017 for alle-
les at frequency >9%). In the Holstein-Friesian dairy cattle, Farnir et al. [7]
observed a decline of D
with the genetic distance but the significance of this
correlation was not tested.
The objective of this study is to investigate the relationship between the co-
efficient of disequilibrium D
and the genetic distance and to assess the impact
of inbreeding. The choice of D
is justified for several reasons: (1) it is a stan-
dardised measure of LD; (2) its interval of variation does not depend on allelic
frequencies; (3) D
easily handles highly polymorphic loci such as microsatel-
lites; and (4) data based on this parameter are increasingly available. The study
makes extensive use of simulations. Hereafter, the material section describes
the algorithm used to simulate various structures of populations and the meth-
ods section describes the approach used to estimate and fit LD as a function of
the genetic distance. Then the obtained results are presented and discussed.
2. MATERIALS AND METHODS
2.1. Material: simulated data
We simulated four populations that mimic recently founded livestock pop-
ulations (Tab. I). One male individual (the founder) was used to inseminate a
large number of females (generation 1) and two hundred of these crosses gave
one offspring each constituting then a second generation of 200 half sibs, with
a sex ration of 1:1. In subsequent generations, a limited number of random
crosses are simulated with a constant population size of 200 individuals per
generation (Tab. I) and a sex ratio of 1:1.
In generation 1 of each population, fifty microsatellite markers were con-
sidered with six alleles each. They were evenly spaced on a 49 cM chromo-
some. On each marker, the founder allele was drawn randomly from the set of
six with a uniform distribution. The founder haplotype given to each offspring
was drawn randomly from a Bernouilli distribution with a frequency of 0.5 and
a recombination rate assuming the absence of interference (Haldane mapping
function). Since an infinite number of dams was assumed and each dam had
one offspring, the haplotypes of the dams were not constructed. The maternal
allele given to the offspring at each marker was drawn randomly from a set of
six with a uniform distribution. The simulated designs corresponded then to
LD and the genetic distance in livestock 285
Table I. Structures of simulated populations.
Generation 1 to 2 Generation 2 to 10
Population Population size
Founder Offspring Crosses Offspring
Pop4 1 200 4 50 200
Pop10 1 200 10 20 200
Pop25 1 200 25 8 200
Pop100 1 200 100 2 200
linkage equilibrium in the founding generation and strong linkage disequilib-
rium in the following generation of half sibs.
Starting at the generation of half sibs (generation 2), paternal and maternal
haplotypes transmitted to offspring were drawn randomly from a Bernouilli
distribution with a frequency of 0.5 and a recombination rate based on the
Haldane mapping function (assuming the absence of interference). For each
population, 10 generations were simulated with 1000 replicates.
2.2. Methods
The inbreeding coefficient and kinship coefficients were computed iter-
atively using the records of pedigree information, according to Lynch and
Walsh [14]. The mean inbreeding coefficient (F) was computed at each gen-
eration for each population. From the rate of inbreeding (∆F) between gen-
eration 9 and 10, we estimated the population effective sizes (N
e
) with the
relationship
∆F =
1
2N
e
+ 1
· (7)
At generation 10, equations (3) to (6) were used to estimate D
between all
possible pairs of markers (1225 pairs) with 400 haplotypes, for each of the
1000 simulations within each of the four populations. It was assumed that the
linkage phase of different alleles is known in the analysed generation. In prac-
tice, linkage phases are constructed from genotypes of progeny, their parents
and their grandparents if available (see e.g. [7, 15]).
For each of the 1000 simulations, estimates of D
were plotted against the
genetic distance and a least squares approach was applied to fit an exponential
function (Eq. (8)) to this spatial pattern
D
(
x
)
= rs +
(
1 − rs
)
exp
−3x
R
· (8)
286 J. Nsengimana, P.V. Baret
This spatial model stipulates that the highest value of D
is 1 and it corresponds
to the genetic distance (x) zero. As the distance increases, D
decreases until
a residual value (rs) is reached. The parameter R should correspond to the
distance at which D
drops to rs. However, since equation (8) is an asymptotic
function, we follow a convention of spatial data modelling (see e.g. [5]): we
estimate R as the distance at which the spatially correlated part of D
drops to
5% [i.e. D
= rs + 0.05(1 − rs)]. In fact, the exponential function is one of
the models used in spatial data analysis [5] and we used it to fit LD owing to
the known exponential relationship between the genetic recombination and the
genetic distance (the Haldane mapping function was used in data simulation).
3. RESULTS
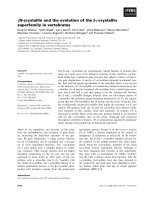
3.1. Inbreeding coefficient
In the base population, all individuals were assumed to be unrelated. In the
second generation, offspring of the founder were half sibs and the inbreeding
coefficient between any two of them was equal to zero. In generation 3, all in-
dividuals had at least one common grandparent (the founder) so that the mean
inbreeding coefficient (F) is equal to 0.125 in all four populations. From gener-
ation 4 to 10, the rate of increase in F depends on the mating structure (Fig. 1).
The effective population sizes at generation 10 were 13.0, 24.5, 49.5 and 166.2
in pop4, pop10, pop25 and pop100, respectively.
3.2. Allele frequencies in generation 10
Amongst the six alleles simulated per marker in the base generation, on
average 2.61 to 5.90 remain 10 generations later according to the population
(Tab. II). As expected, the proportion of these mean alleles per marker de-
creases with the increase of the inbreeding coefficient (F
10
).
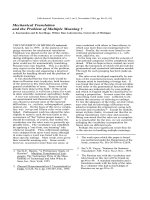
The frequency distribution of these alleles is also a function of inbreeding:
while there are no alleles with a frequency greater than 0.80 in pop100 (F
10
=
0.15), they appear progressively at the expense of low and medium frequencies
as the inbreeding increases (Fig. 2). The allelic fixation is observed in the most
inbred populations (up to 3% in pop4, F
10
= 0.43).
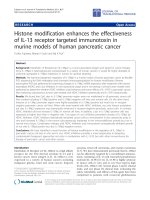
3.3. Estimates of D
and their spatial pattern
Ten generations after populations were founded, the distribution of D
be-
tween all pairs of markers depends on the inbreeding. In the less inbred
LD and the genetic distance in livestock 287
Figure 1. Mean inbreeding coefficient across generations in the four simulated popu-
lations. From top to bottom: pop4, pop10, pop25 and pop100.
Table II. Mean number of alleles per marker (N
A
) in generations 10.
Population F
10
N
A
± σ
Pop100 0.15 5.90 ± 0.03
Pop25 0.20 5.42 ± 0.19
Pop10 0.27 4.01 ± 0.41
Pop4 0.43 2.61 ± 0.41
populations (pop100 with F
10
= 0.15 and pop25 with F
10
= 0.20), the dis-
tribution is unimodal and asymmetric with the highest frequency of D
in the
interval 0.20−0.30 (Fig. 3). As inbreeding increases, this distribution is flat-
tened and extreme values of D
appear progressively (down to 0 and up 1).
These tail values represent ∼30% of the distribution in pop4 (F
10
= 0.43).
Equation (8) was applied to D
in each of the 1000 simulations of every
population. The adequacy of the model (indicated by the determination coef-
ficient, r
2
) depends on the inbreeding: r
2
decreases when the inbreeding coef-
ficient increases (Tab. III). In the less inbred populations (pop100 and pop25
with F
10
= 0.15 and 0.20 respectively), r
2
is greater than 0.50 in all simula-
tions (Tab. III). On the contrary, r
2
is lower than 0.50 in 33% of simulations of
pop10 (F
10
= 0.27) and in 95% of the simulations of pop4 (F
10
= 0.43).
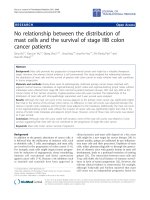
A poor fitting of the spatial model to D
in highly inbred conditions is caused
by extreme values of D
= 1andD
= 0 observed between loci separated
by various genetic distances. Figure 4 illustrates two examples of simulations
from pop4 with a poor fitting. The parameters were respectively R = 31 cM,
288 J. Nsengimana, P.V. Baret
Figure 2. Frequency distribution of remaining alleles at generation 10 for 1000 simu-
lations. The inbreeding coefficient (F
10
) is respectively 0.15 in pop100, 0.20 in pop25,
0.27 in pop10 and 0.43 in pop4.
Figure 3. Distribution of D
in 1000 simulations at generation 10. F
10
is respectively
0.15 in pop100, 0.20 in pop25, 0.27 in pop10 and 0.43 in pop4.
LD and the genetic distance in livestock 289
Figure 4. Example of simulations of pop4 with a poor fitting of the model. For A,
159 pairs of markers over 1225 (13%) have D
= 1 and parameters of the exponential
function are R = 31 cM and rs = 0.72 with r
2
= 0.10. In B, 97 pairs on 1225 (8%)
have D
= 0 and parameters of the exponential model are R = 24 cM and rs = 0.15
with r
2
= 0.19.
Table III. Mean determination coefficient (r
2
) in generation 10.
Population F
10
r
2
± σ r
2
< 0.50
§
Pop100 0.15 0.77 ± 0.04 0%
Pop25 0.20 0.69 ± 0.06 0%
Pop10 0.27 0.53 ± 0.11 33%
Pop4 0.43 0.24 ± 0.14 95%
§
Proportion of simulations with r
2
lower than 0.50.
rs = 0.72 with r
2
= 0.10 in Figure 4A and R = 24 cM, rs = 0.15 with r
2
= 0.19
in Figure 5B.
In simulations without extreme values of D
(0 or 1) at large genetic dis-
tance, the model adequately fitted data in all four populations. Figure 5 illus-
trates two examples of simulations where the model fitted data with r
2
> 0.50.
The simulation of Figure 5A is from pop4 and the corresponding r
2
is 0.58
while Figure 5B is from pop100 and the corresponding r
2
is 0.84.
In many simulations, the poor fitting was caused by a small proportion of
observations: in Figure 4A and 4B there are only 13% and 8% extreme values
of D
= 1 and 0, respectively. Therefore, the model may not be considered
as inappropriate. It may be preferable to exclude these tail values and fit the
overall pattern of remaining observations. In this prospective, we observed a
290 J. Nsengimana, P.V. Baret
Figure 5. Example of simulations of pop4 (A) and pop100 (B) with adequate fitting.
In A, the parameters of the model used are R = 44 cM and rs = 0.30 with r
2
= 0.58;
andinB,theseparametersareR = 19.5cM,rs = 0.18 and r
2
= 0.84.
Figure 6. Determination coefficient (r
2
) as a function of the mean number of alleles
per locus in generation 10.
positive correlation between r
2
and the mean number of alleles per marker
within and between populations (Fig. 6). Since the reduction of the number of
alleles is caused by the high level of inbreeding, we expected this relationship.
Therefore, to reduce the proportion and the impact of extreme values of
D
, we considered two criteria based on the number of alleles segregating per
marker. As the first criterium, we retained simulations in which there are at
least 3 alleles segregating on a minimum number of 5 markers covering a
minimum length of 25 cM. The second criterium was more stringent in that
LD and the genetic distance in livestock 291
Table IV. Parameters of the exponential function applied to D
with criteria based on
marker polymorphism (generation 10).
Population Pop100 Pop25 Pop10 Pop4
F
10
0.15 0.20 0.27 0.43
R ± σ (cM) 17.6 ± 2.321.3 ± 3.730.5 ± 8.445.8 ± 18.2
Criterium rs ± σ 0.22 ± 0.02 0.28 ± 0.03 0.34 ± 0.06 0.37 ± 0.11
1(≥3r
2
± σ 0.78 ± 0.04 0.70 ± 0.05 0.59 ± 0.07 0.62 ± 0.12
alleles per r
2
< 0.50
§
0% 0% 11% 16%
marker) Number of 1000 1000 936 567
simulations
Mean number of 49.6 49.6 47.8 30.8
markers
R ± σ (cM) 17.1 ± 2.321.3 ± 3.732.7 ± 10.957.7 ± 28.6
Criterium rs ± σ 0.22 ± 0.02 0.28 ± 0.03 0.36 ± 0.08 0.43 ± 0.16
2(≥4r
2
± σ 0.78 ± 0.04 0.72 ± 0.05 0.73 ± 0.10 0.73 ± 0.12
alleles per r
2
< 0.50
§
0% 0% 0% 0%
marker) Number of 1000 1000 836 10
simulations
Mean number of 48.8 45.4 18.3 5.2
markers
§
Proportion of simulations with r
2
lower than 0.50.
a minimum number of 4 alleles per marker are required, all other conditions
remaining unchanged (≥5 markers covering ≥25 cM).
With the first criterium, the proportion of simulations having r
2
< 0.50 de-
creased from 95% to 16% in pop4 and from 33% to 11% in pop10 (Tabs. III
and IV) while the mean r
2
was higher than 0.59 in all four populations
(Tab. IV). However, the number of markers per chromosome fulfilling this
criterium decreased with the increase of inbreeding. In the two more inbred
populations (pop4 and pop25), the number of simulations also decreased but
remained higher than 560. When the second criteria was applied, the model
fitted data with r
2
> 0.50 in all simulations, with an average always higher
than 0.70 (Tab. IV).
In the two less inbred populations (pop25 and pop100), the results ob-
tained (R, rs, their standard deviation and r
2
) were similar under both crite-
ria (Tab. IV). This was not surprising since the two criteria can be taken as
equivalent in these two populations given the average number of alleles >5per
marker (Tab. II). In pop10, the average number of alleles was 4 per marker
292 J. Nsengimana, P.V. Baret
Figure 7. Parameters R and rs obtained with criterion 1 (more than 2 alleles per
marker) as a function of the inbreeding coefficient at generation 10.
(see Tab. II) and the second criterium dramatically reduced the number of
markers (only 18/50 were remaining), yet the estimates of parameters R and rs
were similar to those obtained with criterium 1 (see Tab. IV). In pop4, there
was a discrepancy between the results of the two criteria (R, rs, their standard
deviations and r
2
), which can be attributed to the low numbers of simulations
and markers per chromosome fulfilling the second criterium (10 simulations
with 5.2 markers per chromosome).
3.4. Effect of inbreeding on R and rs
The results of our analyses suggest a positive correlation between R and rs
on the one hand and the inbreeding coefficient on the other hand (Tab. IV).
With data obtained under the first criterion (≥3 alleles/marker), the correlation
between R and F is high and significant (r = 0.98 and P < 0.01, Fig. 7). The
correlation between rs and F is also high but it is not significant (r = 0.91,
P = 0.08).
The variance of parameters R and rs also depends on the inbreeding: with
the first criterion, the coefficient of variation (CV) is the lowest in pop100 (13%
for R and 9% for rs,F
10
= 0.15) and it is the highest in pop4 (40% for R and
30% for rs,F
10
= 0.43).
4. DISCUSSION
Linkage disequilibrium is a useful characteristic of populations. However,
its properties are not fully known in diverse population structures. Though it
LD and the genetic distance in livestock 293
is feasible to estimate LD at the whole genome scale, it has not yet been pos-
sible to systematically characterise populations according to this parameter. A
major issue around the quantification of LD is the choice of which measure
to use from the large panoply of existing coefficients and approaches (see re-
views of [6] and [9]). Since D
is the most common measure of LD between
multiallelic markers, it is worth investigating its properties. In this study, we
used an exponential function of the genetic distance (Eq. (8)) to fit D
and we
assessed the properties of this function in inbred populations. These properties
are parameters of the model (R and rs) and the determination coefficient (r
2
)
as an indicator of the goodness-of-fit.
The two parameters of the exponential function that we used (Eq. (8)) have
a simple biological interpretation: rs is the residual LD and R is the distance at
which D
drops to rs. These parameters may give an indication on the popula-
tion demographic history: when LD is maintained in populations by a genetic
drift, both R and rs are correlated to the inbreeding coefficient (Fig. 7). As a
high inbreeding coefficient (F) is caused by a small population effective size
(N
e
), the positive correlation between R and rs on the one hand and F on the
other hand means that R and rs are negatively correlated to N
e
. We choose
to characterise linkage disequilibrium with respect to F because it is close to
other parameters such as identity by descent that are used in QTL mapping.
However, the accuracy of estimates of R and rs also depends on inbreeding:
with an inbreeding coefficient varying from 0.15 to 0.43, the coefficient of vari-
ation (CV) varies between 13% and 40% for R and between 9% and 30% for
rs when criterion 1 was used, i.e. at least 3 alleles segregating per marker.
In the four simulated populations, we considered a high level of LD at the
time they were founded and the model used to fit LD (Eq. (8)) does not as-
sume a final equilibrium between drift and recombination, on the contrary to
the model of Hill and Robertson ([10], see Eq. (2)). Pop25 and pop100 may
correspond to realistic livestock populations, since effective sizes were 49.5
and 166.2. Boichard et al. [3], Moureaux et al. [16] and Nagamine et al. [17]
reported values of the same order in domesticated cattle and pigs. Pop4 and
pop10 were simulated in order to assess the behaviour of the model used
in particular conditions of very small populations (N
e
was respectively 13.0
and 24.5).
In ideal populations, LD should only be influenced by genetic recombina-
tion. Given the exponential relationship between genetic recombination and
genetic distance (the Haldane or Kosambi mapping function), it is expected
that LD be related to recombination (or genetic distance) through an expo-
nential relationship. In inbred populations, genetic recombinations can happen
294 J. Nsengimana, P.V. Baret
between chromosome segments that are homozygous; giving therefore recom-
bined haplotypes that are identical to the non-recombined ones. As a result,
inbreeding makes the relationship between LD and genetic distance more dif-
ficult to predict. The model that we used is appropriate in realistic settings since
r
2
was greater than 50% in all 1000 simulations of pop25 and pop100 when
all markers were analysed (Tab. III). In more inbred conditions, the model was
sensitive to extreme values of D
(0 or 1) even when they represented a small
proportion of observations (see Fig. 4). In such conditions, the real pattern of
D
was adequately fitted when such values were excluded.
Between two alleles, extreme values of D
ij
can be caused by very small al-
lelic frequencies and it is common to exclude these rare alleles from analyses
in order to reduce their impact (i.e. arbitrary fixation of a lower bound of allelic
frequencies to analyse, see e.g. [18, 25]). However, in the multiallelic D
,the
impact of rare alleles is limited by using weights in the summation (Eq. (3)).
This explains why we did not observe high values of D
in pop100 (where
there are many rare alleles) and we observed them in pop4 (where there are
fewer rare alleles). The distributions of allelic frequencies and of D
(Figs. 2
and 3) suggest that extreme values of D
in our populations were obtained be-
tween pairs of loci; one of which (at least) had an extremely frequent allele
(fixed or nearby fixation). Since this also implies a reduction of the number of
segregating alleles per marker (see Tab. II and Fig. 6), we found that an appro-
priate strategy to reduce the impact of extreme values of D
is to sufficiently
analyse polymorphic markers. In fact, our study was primarily concerned with
multiallelic loci for which LD is the most difficult to interpret.
The approach used in this study can be applied to large sets of microsatellite
data that are available, from the experiments of QTL mapping. In fact, most
LD studies exploit data that were generated in a purpose of linkage analysis,
e.g. [7, 15, 21]. Taking profit of these data and using parameters R and rs can
provide more insight in our understanding of sources of LD by comparing for
example populations or chromosomes. Since there is an increasing interest in
the use of single nucleotide polymorphisms (SNP) [22], it will be of interest
to evaluate properties of equation (8) with these biallelic data in various pop-
ulation structures. We performed this analysis for the case of pop100 and we
obtained the same result as with microsatellite data: for 1000 simulations, the
model fitted D
between SNPs at generation 10 with average parameters of
R = 16.2 + 2.7cM,rs = 0.24 + 0.03 and r
2
= 0.72 + 0.04. This result is an
indication that in pop4 and pop10, a low accuracy in estimating R and rs was
caused by inbreeding rather than by marker polymorphism.
LD and the genetic distance in livestock 295
ACKNOWLEDGEMENTS
We are grateful for the support of the Belgian Fund for Research in Agricul-
ture and Industry (FRIA), the National Fund for Scientific Research (FNRS)
and the FSR program of the Université Catholique de Louvain (UCL). We
thank Patrick Bogaert, Eric Le Boulengé, Xavier Draye, Fréderic Farnir and
the referees for their comments on the manuscript.
REFERENCES
[1] Ardlie K., Liu-Cordero N.S., Eberle M.A., Daly M., Barrett J., Winchestcer
E., Lander E.S., Kruglyack L., Lower-than-expected linkage disequilibrium be-
tween tightly linked markers in humans suggests a role for gene conversion, Am.
J. Hum. Genet. 69 (2001) 582–589.
[2] Baret P.V., Hill W.G., Gametic disequilibrium mapping: potential applications in
livestock, Anim. Breed. Abstr. 65 (1997) 309–319.
[3] Boichard D., Maignel L., Verrier E., Analyse généalogique des races bovines
laitières françaises, INRA Prod. Anim. 9 (1996) 323–335.
[4] Cardon L.R., Bell J.I., Association study desigs for complex diseases, Nat. Rev.
Genet. 2 (2001) 91–99.
[5] Christakos G., Random field models in earth sciences, Academic Press, San
Diego, CA, USA, 1992.
[6] Devlin B., Risch N., A comparison of linkage disequilibrium measures for fine-
scale mapping, Genomics 29 (1995) 311–322.
[7] Farnir F., Coppieters W., Arranz J.J., Berzi P., Cambisano N., Grisart B., Karim
L., Marcq F., Moreau L., Mni M., Nezer C., Simon P., Vanmanshoven P.,
Wagenaar D., Georges M., Extensive genome-wide linkage disequilibrium in
cattle, Genome Res. 10 (2000) 220–227.
[8] Haley C.S., Advances in QTL mapping, in: Dekkers et al. (Eds.), Proceedings
of the conference “From Lush to Genomics. Visions for animal breeding and
genetics”, Iowa State University, 1999.
[9] Hedrick P.W., Gametic disequilibrium measures: proceed with caution, Genetics
117 (1987) 331–341.
[10] Hill W.G., Robertson A., Linkage disequilibrium in finite populations, Theor.
Appl. Genet. 38 (1968) 226–231.
[11] Jorde L.B., Watkins W.S., Carlson M., Groden J., Albertsen A., Thliveris
A., Leppert M., Linkage disequilibrium predicts physical distance in the
Adenomatous polyposis coli region, Am. J. Hum. Genet. 54 (1994) 884–898.
[12] Lewontin R.C., The interaction between selection and linkage. I. General con-
siderations; heterotic models, Genetics 49 (1964) 49–67.
[13] Lewontin R.C., On the measures of gametic disequilibrium, Genetics 120 (1988)
849–852.
[14] Lynch M., Walsh B., Genetics and analysis of quantitative traits, Sinauer
Associates, Inc., Sunderland, MA, USA, 1998.
296 J. Nsengimana, P.V. Baret
[15] McRae A.F., McEwan J.C., Dodds K.G., Wilson T., Crawford A.M., Slate J.,
Linkage disequilibrium in domestic sheep, Genetics 160 (2002) 1113–1122.
[16] Moureaux S., Boichard D., Verrier E., Utilisation de l’information généalogique
pour l’estimation de la variabilité génétique de huit races bovines laitières
françaises d’extension nationale ou régionale, 7
e
Rencontre Recherche
Ruminants, Paris, France (2000).
[17] Nagamine Y., Haley C.S., Sewalem A., Visscher P.M., Quantitative trait loci
variation for growth and obesity between and within lines of pigs (Sus scrofa),
Genetics 164 (2003) 629–635.
[18] Reich D.E., Cargili M., Molk S., Ireland J., Sabti P.C., Richter D.J., Lavery T.,
Douyoumjian R., Farhadian S.F., Ward R., Lander E.S., Linkage disequilibrium
in the human genome, Nature 411 (2001) 199–204.
[19] Riley A.M., Hallas M.E., Lewontin R.C., Distinguishing the forces controlling
genetic variation at the Xdh locus in Drosophila pseudoobscura, Genetics 123
(1989) 359–369.
[20] Sved J.A., Linkage disequilibrium and homozygosity of chromosome segments
in finite populations, Theor. Pop. Biol. 2 (1971) 125–141.
[21] Tenesa A., Knott S.A., Ward D., Smith D., Williams J.L., Visscher P.M.,
Estimation of linkage disequilibrium in a sample of the United Kingdom dairy
cattle population using unphased genotypes, J. Anim. Sci. 81 (2003) 617–623.
[22] Vignal A., Milan D., SanCristobal M., Eggen A., A review on SNP and other
types of molecular markers and their use in animal genetics, Genet. Sel. Evol.
34 (2002) 275–305.
[23] Zapata C., Visedo G., Gametic disequilibrium and physical distance, Am. J.
Hum. Genet. 57 (1995) 190–191.
[24] Zapata C., Carollo C., Rodriguez S., Sampling variance and distribution of the
D
measure of overall gametic disequilibrium between multiallelic loci, Ann.
Hum. Genet. 65 (2001) 395–406.
[25] Zapata C., Rodriguez S., Visedo G., Sacristan F., Spectrum of non-random as-
sociations between microsatellite loci on human chromosome 11p15, Genetics
158 (2001) 1235–1251.
[26] Zapata C., Nurez C., Velasco T., Distribution of non-random associations
between pairs of protein loci along the third chromosome of Drosophila
melanogaster, Genetics 161 (2002) 1539–1550.