Báo cáo sinh học: " Optimizing purebred selection for crossbred performance using QTL with different degrees of dominance" pptx
Bạn đang xem bản rút gọn của tài liệu. Xem và tải ngay bản đầy đủ của tài liệu tại đây (440.64 KB, 28 trang )
Genet. Sel. Evol. 36 (2004) 297–324 297
c
INRA, EDP Sciences, 2004
DOI: 10.1051/gse:2004003
Original article
Optimizing purebred selection for crossbred
performance using QTL with different
degrees of dominance
Jack C.M. D
∗
, Reena C
Department of Animal Science, 225C Kildee Hall, Iowa State University, Ames,
IA, 50011, USA
(Received 9 April 2003; accepted 17 December 2003)
Abstract – A method was developed to optimize simultaneous selection for a quantitative trait
with a known QTL within a male and a female line to maximize crossbred performance from
a two-way cross. Strategies to maximize cumulative discounted response in crossbred perfor-
mance over ten generations were derived by optimizing weights in an index of a QTL and phe-
notype. Strategies were compared to selection on purebred phenotype. Extra responses were
limited for QTL with additive and partial dominance effects, but substantial for QTL with
over-dominance, for which optimal QTL selection resulted in differential selection in male and
female lines to increase the frequency of heterozygotes and polygenic responses. For over-
dominant QTL, maximization of crossbred performance one generation at a time resulted in
similar responses as optimization across all generations and simultaneous optimal selection in
a male and female line resulted in greater response than optimal selection within a single line
without crossbreeding. Results show that strategic use of information on over-dominant QTL
can enhance crossbred performance without crossbred testing.
crossbreeding / selection / quantitative trait loci / marker assisted selection
1. INTRODUCTION
In most livestock production systems, crossbreds are used for commercial
production to capitalize on heterosis and complementarity and the aim of se-
lection within pure-lines is to maximize crossbred performance. Selection is,
however, within pure-lines and primarily based on purebred data, which may
not maximize genetic progress in crossbred performance [21]. Several theoret-
ical studies have shown that selection on a combination of crossbred and pure-
bred performance can result in greater responses in crossbred performance, in
particular if genes with complete or over-dominance affect the trait [1,20,22].
∗
Corresponding author:
298 J.C.M. Dekkers, R. Chakraborty
Collection of crossbred data, however, requires separate testing and recording
strategies.
Molecular genetics has enabled the identification of quantitative trait loci
(QTL) for many traits of interest in livestock. The strategic use of non-additive
QTL in pure-line selection allows selection for crossbred performance without
crossbred data. For non-additive QTL, Dekkers [4] showed that the breeding
value of the QTL that maximizes the genetic level of progeny depends on the
frequency of the QTL among mates and that extra gains of up to 9% could be
obtained over a single generation for overdominant QTL at intermediate fre-
quency by optimizing QTL breeding values. In practice, however, the goal is to
maximize gains in current and future generations. Several studies have shown
that with selection on QTL, maximization of response in the short term can
result in lower cumulative responses in the longer term [10, 12, 19]. Methods
to optimize selection on QTL to maximize a combination of short and longer-
term responses have been derived [3, 5, 16]. Results showed that optimizing
selection on QTL can result in greater response to selection within a pure line,
although extra responses were limited, except for QTL with over-dominance.
The objectives of this study were to extend these methods for simultaneous se-
lection in two pure lines to maximize a combination of short and longer-term
responses in crossbred performance, and to evaluate extra responses that can
be achieved.
2. METHODS
2.1. Population structure and genetic model
A deterministic model was developed for a two-breed crossbreeding pro-
gram consisting of purebred nucleus and multiplier populations for a male (M)
and a female (F) line, along with a commercial crossbred population. Popula-
tions of infinite size with discrete generations were considered. All selection
was within the purebred nucleus populations and based on data recorded in the
nucleus only. Fractions of sires and dams selected each generation to produce
nucleus replacements were Q
Ms
and Q
Md
for the male line and Q
Fs
and Q
Fd
for the female line. Nucleus animals used as parents for the multiplier were a
random sample of animals produced in the nucleus. All males from the male
line multiplier and all females from the female line multiplier were used to
produce commercial animals. Mating of sires and dams was at random at all
levels.
Crossbred selection on QTL 299
Table I. Summary of notation used for the model of selection on a QTL with two
alleles (B and b) in generation t in the male nucleus
1
.
Geno- Frequency
2
Mean polygenic value
3
Mean genetic Mean breeding value,
type value deviated from
genotype Bb
4
BB p
M,s,t
p
M,d,t
¯u
M,BB,t
= A
M,s,B,t
+ A
M,d,B,t
a + ¯u
M,BB,t
α
t
+ ¯u
M,BB,t
− ¯u
M,Bb,t
Bb p
M,s,t
(1 − p
M,d,t
)¯u
M,Bb,t
= A
M,s,B,t
+ A
M,d,b,t
d + ¯u
M,Bb,t
0
bB (1 − p
M,s,t
)p
M,d,t
¯u
M,bB,t
= A
M,s,b,t
+ A
M,d,B,t
d + ¯u
M,bB,t
¯u
M,bB,t
− ¯u
M,Bb,t
bb (1 − p
M,s,t
)(1 − p
M,d,t
)¯u
M,bb,t
= A
M,s,b,t
+ A
M,d,b,t
−a + ¯u
M,bb,t
−α
t
+ ¯u
M,bb,t
− ¯u
M,Bb,t
1
For parameters for the female nucleus, replace subscript M by F.
2
p
M,s,t
and p
M,d,t
are frequencies of allele B among selected sires and dams that are used to pro-
duce generation t in the male nucleus.
3
¯u
M,m,t
is the mean polygenic breeding value of individuals of genotype m in generation t in the
male nucleus, A
M,j,B,t
and A
M,j,b,t
are the mean polygenic values of gametes from sex j that carry
allele B or b and are used to produce generation t in the male nucleus.
4
α
t
is the QTL allele substitution effect in generation t, derived for the different selection strate-
gies as described in the text.
Selection was for a trait controlled by a known QTL and additive infinites-
imal polygenic effects [9]. The QTL had two alleles, B and b, with genotypic
values equal to a, d, d,and−a for genotypes BB, Bb, bB, and bb (it was as-
sumed that genotypes Bb and bB, where the first letter refers to the paternal
allele, could be distinguished). The variance of polygenic effects was assumed
constant over generation, i.e. gametic phase disequilibrium among polygenes
was ignored. All nucleus animals were genotyped for the QTL and phenotyped
for the trait under selection. Effects at the QTL were assumed known without
error.
Selection in each nucleus population was modeled as described in Dekkers
and Chakraborty [6] for a single purebred population, by truncation selec-
tion across four distributions, one for each genotype (Fig. 1 of Dekkers and
Chakraborty [6]). Further details and extension of this model to multiple alle-
les and multiple QTL are in Chakraborty et al. [3], but the notation of Dekkers
and Chakraborty [6] for one QTL with two-alleles was used here for simplic-
ity and presented in Table I. Given fractions selected from each distribution,
equations (5), (6), and (7) of Dekkers and Chakraborty [6] were used to model
changes in allele frequencies and polygenic means in each nucleus popula-
tion from generation to generation. Polygenic variance was assumed to re-
main constant over generation, i.e. no Bulmer effect [2], but gametic phase
300 J.C.M. Dekkers, R. Chakraborty
disequilibrium between the QTL and polygenes was modeled, as described by
Dekkers and Chakraborty [6].
2.2. Selection objective and selection criteria
Under random mating, and following the notation of Table I, the genetic
level of crossbred progeny that originate from nucleus generation t is:
G
Ct
=
1
/
2
[p
M,s,t
+ p
M,d,t
+ p
F,s,t
+ p
F,d,t
− 2]a
+
1
/
2
[p
M,s,t
+ p
M,d,t
+ p
F,s,t
+ p
F,d,t
− (p
M,s,t
+ p
M,d,t
)(p
F,s,t
+ p
F,d,t
)]d}
+
1
/
2
[p
M,s,t
A
M,s,B,t
+ (1 − p
M,s,t
)A
M,s,B,t
+ p
M,d,t
A
M,d,B,t
+ (1 − p
M,d,t
)A
M,d,B,t
]
+
1
/
2
[p
F,s,t
A
F,s,B,t
+ (1 − p
F,s,t
)A
F,s,B,t
+ p
F,d,t
A
F,d,B,t
+ (1 − p
F,d,t
)A
F,d,B,t
].
The general selection objective considered was to maximize cumulative
discounted response (CDR) in crossbred performance over T generations:
CDR
T
=
T
t=1
w
t
G
t
with w
t
= 1/(1 + r)
t
,wherer is the rate of interest per
generation.
Five selection strategies were evaluated for their ability to increase CDR
T
over 5 or 10 generations based on purebred data in the male and female lines.
Following Dekkers and Chakraborty [6], all strategies, including selection on
phenotype, involved selection on a combination of the QTL and a polygenic
estimated breeding value. Letting ˆu
i, j,k,m,t
denote the polygenic breeding value
estimate for individual i of line j (= M, F)ofsexk (= s,d) with genotype m
(= BB, Bb, bB, or bb) in generation t, the general selection criterion can be
written as: I
i, j,k,m,t
= θ
j,k,m,t
+ (ˆu
i, j,k,m,t,
− ¯u
j,m,t
)whereθ
j,k,m,t
is a QTL value
assigned to individuals of line j of sex k with genotype m in generation t and
¯u
j,m,t
is the mean polygenic breeding value of individuals in line j that have
genotype m in generation t. Based on this index, the following five selection
criteria were defined for simultaneous selection within the male and female
lines:
PHEN = selection on own phenotype. Implicit index values for the QTL,
θ
j,k,m,t
, were derived as described in Dekkers and Chakraborty [6];
STD = standard QTL selection [6], with θ
j,k,m,t
equal to the standard breeding
values for the QTL for within-line selection (see below);
ALTSTD = alternate line standard QTL selection, with θ
j,k,m,t
equal to stan-
dard breeding values for the QTL for crossbred selection;
Crossbred selection on QTL 301
STEPOPT = stepwise optimal QTL selection, using QTL breeding values that
maximize crossbred performance in the next generation, one generation at
a time;
FULLOPT = optimal QTL selection, maximizing CDR
T
over the planning
horizon.
Breeding values for the QTL for strategies STD, ALTSTD, and STEPOPT
were derived based on a QTL allele substitution effect (α) and polygenic
means (¯u), using the following equation, after Dekkers and Chakraborty [6]:
θ
j,k,m,t
= n
m
α
j,k,t
+ ¯u
j,m,t
− ¯u
j,Bb,t
, where indicator variable n
m
is equal to +1,
0, 0, and −1form equal to BB, Bb, bB, and bb, respectively (see Tab. I)
and where ¯u
j,m,t
− ¯u
j,Bb,t
quantifies gametic phase disequilibrium based on
the mean polygenic difference of individuals of genotype m (¯u
j,m,t
) from the
reference genotype Bb (¯u
j,Bb,t
) [6]. For all three strategies, allele substitution
effects were derived using the basic equation of Falconer and MacKay [9],
i.e. α = a + (1 − 2p)d,wherep is the frequency of allele B, but differed in
the reference group for which the allele frequency was derived: the frequency
among selection candidates from the same line was used for STD; the fre-
quency among selection candidates of the opposite line for ALTSTD; and the
frequency among selected parents in the opposite line for STEPOPT. The ref-
erence group for derivation of gametic phase disequilibrium was always based
on selection candidates within the line for which the breeding values were de-
rived. Thus, for selection in generation t in the male line, noting that p
j,k,t
is
defined as the frequency of B among individuals of sex k in line j that are used
to produce generation t for line j (Tab. I) and, therefore, (p
j,s,t
+ p
j,d,t
)/2isthe
frequency among selection candidates in line j, allele substitution effects were
derived as follows:
for STD: α
M,s,,t
= α
M,d,t
= a + (1 − p
M,s,t
− p
M,d,t
)d
for ALTSTD: α
M,s,,t
= α
M,d,t
= a + (1 − p
F,s,t
− p
F,d,t
)d
for STEPOPT: α
M,s,,t
= α
M,d,t
= a + (1 − p
F,s,t+1
− p
F,d,t+1
)d.
Allele substitution effects for selection in the female line were similarly de-
rived, by substituting F for M and M for F.
The allele substitution effect for STEPOPT was based on an extension of
Dekkers [4], who showed that QTL breeding values for selection of sires
(dams) that maximize genetic progress from generation t-1 to t within a pure-
bred population can be derived from allele substitution effects that are based
on allele frequencies among gametes produced by the selected group of dams
(sires), rather than frequencies among selection candidates. In other words,
302 J.C.M. Dekkers, R. Chakraborty
the effect of a given QTL allele depends on the frequency of alleles that it will
be combined with, rather than frequencies in the population from which it was
selected. Extending this to maximizing performance of crossbred progeny, the
frequency of B among alleles that combine with male nucleus alleles in the
crossbred progeny that are derived from generation t is equal to the frequency
of B in the female nucleus in generation t + 1, i.e.
1
/
2
(p
F,s,t+1
+ p
F,d,t+1
). Since
QTL breeding values for the male line depend on allele frequencies among
parents selected in the female line, which in turn, depend on allele frequencies
among parents selected in the male line, solutions cannot be obtained analyti-
cally. An iterative procedure similar to that of Dekkers [4] was used, based on
the appropriate sets of allele frequencies.
For full optimal QTL selection (FULLOPT), QTL breeding values θ
j,k,m,t
were derived that maximized CDR
T
by extending the optimal control proce-
dures of Dekkers and van Arendonk [5] and Chakraborty et al. [3] to simul-
taneous optimization of selection in male and female lines. Compared to the
single-line problem of Chakraborty et al. [3], the crossbreeding problem re-
quired a separate set of variables for each line, including allele frequencies,
mean polygenic breeding values, and Lagrange multipliers. This resulted in
separate sets of equations of partial derivatives for each line (Eqs. (23) through
(35) of Chakraborty et al. [3]). Partial derivatives were derived taking into ac-
count the altered objective function for CDR
T
. This resulted in two sets of
equations, similar to those represented in Figure 3 of Chakraborty et al. [3],
which were solved simultaneously by a duplication of the iterative strategy of
Chakraborty et al. [3]. Implementation of the extension was limited to the case
of one QTL with two alleles.
Note that, in reference to equation (4) of Dekkers and Chakraborty [6],
θ
j,k,m,t
can also be written as the product of an index weight and the standard
breeding value for the QTL, θ
j,k,m,t
= b
j,k,m,t
g
k,m,t
,whereg
k,m,t
is the standard
breeding value for the QTL, as is used for the STD selection strategy.
2.3. Choice of parameters
In the base situation, proportions selected in both nucleus populations were
0.1 for sires (Q
Ms
= Q
Fs
= 0.1) and 0.25 for dams (Q
Md
= Q
Fd
= 0.25). Initial
frequencies of allele B were 0.3 and 0.2 in the male and female line and starting
populations were in gametic phase and Hardy Weinberg equilibrium. A range
of additive and dominance effects at the QTL was evaluated for a trait with
heritability 0.3: small (a = 0.5σ
pol
), medium (a = 1σ
pol
), or large (a = 2σ
pol
)
additive effects, where σ
pol
is the polygenic standard deviation, and no (d = 0),
Crossbred selection on QTL 303
partial (d =
1
/
2
a), complete (d = a), or over-dominance (d = 1
1
/
2
a). Response
in crossbred performance over ten generations with a discount rate of 10% per
generation was evaluated.
Several parameters were changed from the base situation to further evalu-
ate selection strategies. To evaluate the impact of equal starting frequencies
in the two lines, starting frequencies were changed to 0.51 and 0.49 in the
male and female lines (equal frequencies resulted in lack of convergence for
FULLOPT). To evaluate the impact of differential selection intensities in the
two lines, selected proportions were doubled for the male line to Q
Ms
= 0.2
and Q
Md
= 0.5. And to evaluate the impact of length of the planning horizon,
CDR
T
over 10 generations at a 0% discount rate and over 5 generations at a
30% discount rate were evaluated.
In all cases, responses were also compared to response from optimized se-
lection in a single line (SLOPT), following Dekkers and Chakraborty [6]. To
allow comparison to crossbreeding cases with different starting frequencies in
the male and female lines, the base population was generated as a synthetic by
crossing the two lines, which was followed by selection and random mating
within the synthetic line.
3. RESULTS
3.1. Base situation
Table II shows CDR
T
for alternative QTL selection strategies relative to
phenotypic selection for the base situation. For additive QTL and for QTL
with partial dominance, all strategies, except FULLOPT, had lower CDR
T
than phenotypic selection, although differences were less than 3.6%, and less
than 2% for most cases. The advantage of FULLOPT over phenotypic se-
lection was also small, less than 1% greater CDR
T
, and implementing FUL-
LOPT in the two-line program had no advantage over full optimal selection
within a single line. Differences between programs were, however, greater for
QTL with complete or over-dominance. With complete dominance, both STD
and ALTSTD selection had lower response than phenotypic selection, up to
4% (Tab. II). For an over-dominant QTL, response was 0.8% lower for ALT-
STD than for PHEN for a QTL of small effect, but 12.7% greater for a QTL
with large effect. Response for STD was within 3% of response to pheno-
typic selection for overdominant QTL. Full optimal selection had up to 3.3%
greater response than phenotypic selection for complete dominance and up to
21% greater response for overdominance. The difference in response between
304 J.C.M. Dekkers, R. Chakraborty
Table II. Extra (%) cumulative discounted response (10 generations, 10% interest) of
QTL selection strategies over phenotypic selection for different degrees of dominance
(d)andQTLeffects (a in polygenic s.d.) for the base situation.
Degree of dominance
Selection strategy d = 0 d =
1
/
2
ad= ad= 1
1
/
2
a
a = 0.5
Standard –0.4 –1.7 –2.3 –2.4
Alternate standard –0.4 –1.6 –2.0 –0.8
Stepwise optimal –0.4 –0.7 –0.1 2.3
Full optimal 1.1 0.5 1.1 3.7
Full optimal single line 1.1 0.5 0.6 1.3
a = 1
Standard –1.6 –3.6 –3.9 –2.6
Alternate standard –1.6 –3.5 –3.6 1.4
Stepwise optimal –1.6 –1.8 0.3 8.0
Full optimal 1.0 0.3 2.2 9.8
Full optimal single line 1.1 0.4 1.1 3.6
a = 2
Standard –1.3 –3.2 –3.1 1.5
Alternate standard –1.3 –3.1 –2.4 12.7
Stepwise optimal –1.3 –2.3 1.1 20.9
Full optimal 0.8 0.1 3.3 21.0
Full optimal single line 0.9 0.2 1.8 9.7
FULLOPT and STEPOPT was less than 2.2% for such QTL and both were
substantially better than implementing optimal selection within a single line
(up to 11.3% greater response for a large overdominant QTL). Results for com-
plete and over-dominance are presented in further detail below.
3.1.1. Complete dominance
Trends in frequencies of the favorable QTL allele in the male and female
lines for the six selection strategies are given in Figure 1 for QTL with com-
plete dominance and a large additive effect of 2σ
pol
. Trends were similar for
Crossbred selection on QTL 305
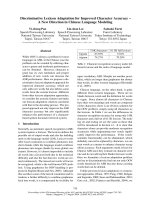
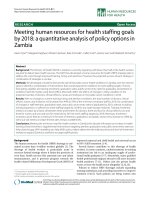
Figure 1. Frequency of the favorable allele in the (a) male line and (b) female line for
different selection strategies for a QTL with complete dominance and a large additive
effect (2 polygenic standard deviations), for the base situation parameters. Frequencies
for single line optimal selection are among male (A) and female (B) gametes that
contribute to a given generation.
the medium-sized QTL. For complete dominance, frequencies in the male line
increased rapidly for all strategies, except for PHEN and SLOPT selection
(Fig. 1a). Initial increases in frequency were slightly lower for FULLOPT than
for STD, ALTSTD, and STEPOPT. Complete fixation was not reached for
PHEN, STD, and SLOPT. Trends in female line frequencies (Fig. 1b) were
similar to those for the male line for PHEN, STD, and SLOPT. For ALTSTD,
306 J.C.M. Dekkers, R. Chakraborty
frequency in the female line reached a constant value by generation 3. This
was caused by fixation in the male line by generation 2 (Fig. 1a), which
resulted in a zero allele substitution effect for the QTL in the female line
(α
F,s,,t
= α
F,d,t
= a + (1 − p
M,s,t
− p
M,d,t
)d = 0whenp
M,s,t
= p
M,d,t
= 1
and d = a). Note that female line frequencies declined in the first generation
following fixation in the male line (from generation 2 to 3, Fig. 1b). This was
caused by the negative gametic phase disequilibrium between the QTL and
polygenes in the female line in generation 2, which resulted in a negative em-
phasis on B alleles.
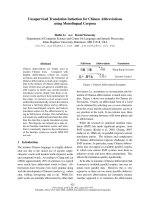
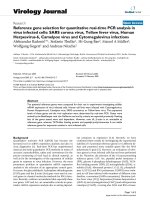
For the optimal selection strategies STEPOPT and FULLOPT, frequencies
in the female line stabilized to 0.41 and 0.38 by generation 2 (Fig. 1b). By
generation 2 the frequency of crossbred progeny with desirable QTL geno-
types (BB, Bb, and bB) was close to 100% for STEPOPT and FULLOPT (see
Fig. 2a) and, as a result, there was no need to further select on the QTL in
the female line, allowing all selection pressure to be applied to polygenes. De-
viations from the stable frequency in the female line in generations 9 and 10
for FULLOPT (Fig. 1b) were caused by gametic phase disequilibrium. Simi-
lar trends were observed for a QTL of medium effect, except that female line
frequencies stabilized at a lower level of 0.33 for both strategies. As demon-
strated in Figure 2a, the frequency of crossbred progeny with desirable QTL
genotypes increased to fixation for all strategies, but most rapidly for STD,
ALTSTD, and STEPOPT.
Cumulative polygenic and total genetic gains in crossbreds for the large
QTL are in Figure 3. Gains are expressed as a deviation from cumulative gains
for phenotypic selection. Strategies that did not optimize selection over the
entire planning horizon lost polygenic gain relative to phenotypic selection
(Fig. 3a). Lost polygenic gains were greatest for STD and ALTSTD, and inter-
mediated for STEPOPT. Polygenic gain was lost in initial generations because
of the heavy emphasis on the QTL and could not be recovered in later gen-
erations, similar to what was observed by Dekkers and van Arendonk [5] for
single line selection. Both strategies that optimized selection over the plan-
ning horizon (FULLOPT and SLOPT) achieved greater polygenic response
than phenotypic selection. Extra polygenic response was greater for optimal
selection in two lines than for optimal selection in a single line; FULLOPT
was able to relax selection on the QTL in the female line after two genera-
tions (Fig. 1b), allowing it to maximize emphasis placed on polygenes. Similar
trends were observed for the medium sized QTL, although differences between
the six strategies were smaller.
Crossbred selection on QTL 307
Figure 2. Frequency of desirable genotypes for different selection strategies for a
QTL with (a) complete dominance (frequency of favorable homozygote plus heterozy-
gotes) and (b) overdominance (frequency of heterozygotes) and a large additive effect
(2 polygenic standard deviations), for the base situation parameters.
Lost polygenic responses for STD, ALTSTD, and STEPOPT were off-
set by greater gains in the QTL during the initial generations, resulting in
greater total genetic gain after one generation (Fig. 3b). Strategy STEPOPT
achieved the greatest total genetic response in generation 1, as expected, but
was closely followed by STD and ALTSTD. Cumulative total response for
STD and ATLSTD, however, dropped below response to phenotypic selection
after a few generations, as the frequency of desirable genotypes for phenotypic
308 J.C.M. Dekkers, R. Chakraborty
Figure 3. Cumulative polygenic (a) and total genetic (b) response to different selection
strategies for a QTL with complete dominance and a large additive effect (2 polygenic
standard deviations), as a deviation from phenotypic selection, for the base situation
parameters.
selection moved toward fixation (Fig. 2a). Cumulative response from
STEPOPT dropped below response from phenotypic selection by generation
five. Strategy FULLOPT had the greatest cumulative response by generation 2
and thereafter (Fig. 3b), demonstrating its ability to balance response in the
QTL and polygenes. Optimal selection in two lines resulted in greater cumu-
lative responses than optimal selection in a single line in generations 2 and
later.
Crossbred selection on QTL 309
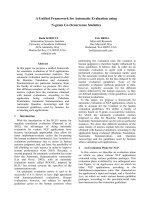
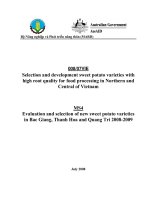
Figure 4. Frequency of the favorable allele in the (a) male line and (b) female line
for different selection strategies for a QTL with overdominance and a large additive
effect (2 polygenic standard deviations), for the base situation parameters. Frequencies
for single line optimal selection are among male (A) and female (B) gametes that
contribute to a given generation.
3.1.2. Overdominance
Trends in allele frequencies in the male and female lines for a large
over-dominant QTL are in Figure 4. The optimal strategies STEPOPT and
FULLOPT resulted in fixation of alternate QTL alleles in the male and the fe-
male line, which led to a rapid increase in the frequency of the most desirable
310 J.C.M. Dekkers, R. Chakraborty
genotype, heterozygotes (Fig. 2b). Fixation of alleles was more rapid for
STEPOPT than for FULLOPT. Strategy ALTOPT also resulted in ultimate fix-
ation of alternate alleles but the frequency of allele B initially increased in
both lines (Fig. 4). Allele substitution effects with ALTSTD are determined
by frequencies in the opposite line and change from positive to negative at a
frequency of 0.83, which is were the substitution effect is zero for an overdom-
inant QTL with d = 1
1
/
2
a. Thus, once the frequency in the male line rose to
above 0.83 in generation 1, the QTL allele substitution effect became negative
for the female line and the frequency in the female line decreased.
For STD, allele frequencies in the two lines oscillated around the equilib-
rium frequency of 0.83 (Fig. 4). Frequencies among male and female gametes
also approached the equilibrium frequency under optimal selection in a sin-
gle line but diverged in the final two generations to increase the frequency
of heterozygotes (Fig. 2b). Frequencies for PHEN asymptoted to a frequency
of 0.65.
Frequencies of the desired QTL genotype, heterozygotes, rapidly increased
to 100% for STEPOPT (Fig. 2b) and, with a 2-generation delay, also for
ALTSTD. The increase in frequency of heterozygotes was more gradual for
FULLOPT. Frequency of heterozygotes was less than 50% for phenotypic,
STD, and SLOPT, but increased for the latter in the final generations.
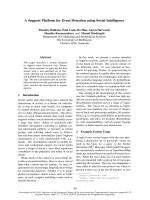
Cumulative polygenic responses for the overdominant QTL are in Figure 5.
In contrast to the QTL with complete dominance, the advantage of most strate-
gies over phenotypic selection increased over generations. This was caused by
the continuous implicit selection on heterozygotes with phenotypic selection
because of their greater phenotypic value, but with no effect on QTL frequen-
cies (Figs. 2b and 4). In contrast, strategies that used QTL information seized
to select on the QTL once it was fixed or when the equilibrium frequency was
reached. An exception was STD, which oscillated around the equilibrium fre-
quency (Fig. 4) and, therefore, also continued to put emphasis on the QTL.
Among the optimal strategies, SLOPT obtained the greatest cumulative
polygenic gains (Fig. 5a), followed by FULLOPT. The ability for FULLOPT to
increase the number of heterozygotes by divergent selection on the QTL, how-
ever, resulted in a substantially greater cumulative total response than SLOPT
(Fig. 5b). The difference in total response between FULLOPT and STEPOPT
was small (Fig. 5b), despite a substantially greater polygenic response for
FULLOPT (Fig. 5a). This was, however, partially offset by a slightly greater
frequency of heterozygotes for STEPOPT (Fig. 2b).
Crossbred selection on QTL 311
Figure 5. Cumulative polygenic (a) and total genetic (b) response to different selec-
tion strategies for a QTL with overdominance and a large additive effect (2 polygenic
standard deviations), as a deviation from phenotypic selection, for the base situation
parameters.
3.2. Alternative parameters
3.2.1. Initial frequencies
Intermediate starting frequencies for the favorable QTL allele (0.51 and
0.49 in the male and female line) had limited impact on differences in CDR
T
between selection strategies (Tab. III). The main difference was that relative
312 J.C.M. Dekkers, R. Chakraborty
Table III. Extra (%) cumulative discounted response (10 generations, 10% interest) of
QTL selection strategies over phenotypic selection for different degrees of dominance
(d)andQTLeffects (a in polygenic s.d.) for alternative sets of parameters.
Starting frequencies Male line selected Long planning Short planning
0.51 and 0.49 in proportions horizon horizon
male and female doubled to 0.2 (10 generations (5 generations
line and 0.5 0% interest) 30% interest)
Selection strategy d = ad= 1
1
/
2
ad= ad= 1
1
/
2
ad= ad= 1
1
/
2
ad= ad= 1
1
/
2
a
a = 0.5
Standard –0.9 –0.4 –2.3 –2.3 –2.4 –2.2 –1.9 –3.1
Alternate standard –1.0 –0.2 –2.2 –2.0 –2.0 –0.6 –1.4 –1.4
Stepwise optimal 0.1 1.9 –0.5 1.3 –0.4 1.9 1.6 4.1
Full optimal 0.5 2.6 0.8 3.2 1.0 3.6 2.5 5.4
Full optimal single line 0.5 1.3 0.5 1.3 1.6 2.0
a = 1
Standard –2.8 –2.2 –3.9 –2.5 –3.9 –2.4 –3.6 –3.6
Alternate standard –2.8 –0.5 –3.9 –1.9 –3.6 1.6 –3.2 0.2
Stepwise optimal 0.4 6.6 –0.7 4.5 –0.1 7.4 2.8 11.9
Full optimal 1.2 8.7 1.6 8.4 2.0 9.4 4.4 13.2
Full optimal single line 1.1 3.9 1.0 3.6 2.5 4.6
a = 2
Standard –4.2 –2.2 –3.0 0.5 –3.4 1.3 –1.1 2.9
Alternate standard –4.2 6.3 –3.0 3.9 –2.8 12.6 –0.3 13.1
Stepwise optimal –1.0 24.0 0.2 16.1 0.5 19.9 4.4 26.1
Full optimal 2.3 24.0 2.8 17.5 2.9 20.9 6.1 26.4
Full optimal single line 1.9 12.5 1.6 9.8 3.9 12.2
responses to ALTSTD tended to be reduced relative to the base situation, in
particular for the large QTL with over-dominance. Although alternate QTL al-
leles were ultimately fixed in both lines under this strategy, frequencies of the
favorable allele increased to 0.99 and 0.98 in the male and female line in gen-
eration 1. This required much additional selection pressure on the QTL over
generations, which resulted in lower polygenic response. Frequencies for STD
again oscillated around the equilibrium frequency of 0.83 (results not shown).
Crossbred selection on QTL 313
3.2.2. Differential selection intensities
Doubling selected proportions in the male line had limited impact on differ-
ences in CDR
T
between selection strategies for a QTL with complete domi-
nance (Tab. III) but reduced the benefit of stepwise and full optimal selection
strategies over phenotypic selection for the over-dominant QTL, compared to
the base situation (Tab. II). Strategy ALTSTD also had lower CDR
T
relative to
phenotypic selection when selection intensities in the male line were reduced.
For these parameters, the favorable allele tended to be fixed in the female
rather than in the male line for the optimal selection strategies and for ALTSTD
for both complete and over-dominance (Tab. IV). For FULLOPT, the reason
for this is that the greater selection intensities in the female line allowed for
more opportunities for large changes in allele frequencies than were present in
the male line. For complete dominance and overdominant QTL of small effect,
however, the favorable allele tended to be fixed in the male line (Tab. IV).
The same occurred for STEPOPT for the medium-sized QTL. For ALTSTD,
selection on a small overdominant QTL resulted in ultimate divergence of the
QTL but at a very slow rate (Tab. IV).
3.2.3. Planning horizon
Increasing the length of the planning horizon by reducing the discount rate
to zero had limited impact on responses between strategies (Tabs. II and III).
For a short planning horizon (five generations and a 30% discount rate), how-
ever, the benefit of the optimal selection strategies was greater than for the
long time horizon (Tab. III). Extra CDR
T
over phenotypic selection was up
to 6% for complete dominance and up to 27% for over-dominance for FUL-
LOPT. Extra responses for STEPOPT were within 2% of those for FULLOPT.
Strategy FULLOPT resulted in a rapid increase in the frequency of desirable
genotypes without sacrificing much polygenic response relative to phenotypic
selection (Tab. V). For complete dominance, no selection pressure was placed
on the QTL in the female line, except for the first generation, which allowed
increased polygenic gain in that line.
4. DISCUSSION AND CONCLUSIONS
4.1. Selection on QTL for crossbred performance
This study demonstrates that strategic use of non-additive QTL enables
selection for crossbred performance based on purebred data. Compared to
314 J.C.M. Dekkers, R. Chakraborty
Table IV. Frequencies of the favorable QTL allele in the male and female line
(male/female) for alternate standard (ALTSTD), stepwise optimal (STEPOPT), and
full optimal (FULLOPT) selection for cumulative discounted response (10 genera-
tions, 10% interest) on a QTL with complete or over-dominance and different additive
effects, with doubled selected proportions of sires and dams of 0.2 and 0.5 in the male
line.
Selection Complete dominance Over-dominance
strategy 2 5 10 2 5 10
a = 0.5
ALTSTD 0.71/0.68 0.84/0.83 0.91/0.92 0.72/0.66 0.83/0.70 0.98/0.46
STEPOPT 0.65/0.56 0.84/0.73 0.95/0.82 0.73/0.42 1.00/0.15 1.00/0.02
FULLOPT 0.60/0.35 0.86/0.42 0.99/0.44 0.68/0.22 0.96/0.12 1.00/0.02
a = 1
ALTSTD 0.85/0.89 0.88/0.95 0.90/0.99 0.83/0.85 0.77/0.84 0.31/1.00
STEPOPT 0.71/0.79 0.70/0.99 0.70/1.00 0.91/0.39 1.00/0.03 1.00/0.00
FULLOPT 0.45/0.71 0.45/0.98 0.45/1.00 0.27/0.80 0.09/1.00 0.01/1.00
a = 2
ALTSTD 0.95/0.99 0.92/0.99 0.93/0.99 0.93/0.96 0.69/0.90 0.00/1.00
STEPOPT 0.58/1.00 0.56/1.00 0.56/1.00 0.31/1.00 0.00/1.00 0.00/1.00
FULLOPT 0.44/0.89 0.42/1.00 0.42/1.00 0.50/0.80 0.19/1.00 0.00/1.00
phenotypic selection, limited benefits were obtained for QTL with partial dom-
inance. Extra responses, evaluated as cumulative discounted response, com-
bining short- and long-term responses, were slightly greater for complete
dominance but still less than 3.5% (Tabs. II and III). For overdominant QTL
(d = 1
1
/
2
a), extra responses over phenotypic selection that were obtained with
optimal QTL selection increased nearly linear with the magnitude of the ad-
ditive effect of the QTL and were up to 6, 13, and 26% greater for QTL with
additive effects of 1/2, 1, and 2σ
pol
. At a frequency of 0.25 and polygenic
EBV based on phenotype for a trait with heritability 0.3, this represents QTL
that explain 27, 59, and 85% of the purebred genetic variance. Although these
QTL effects may be unrealistic, similar results may be obtained from selection
on multiple QTL that jointly explain such a proportion of genetic variance.
While differences in response of QTL selection strategies with phenotypic
selection depend on heritability, relative differences among QTL selection
strategies depend only on the magnitude of the QTL relative to the stan-
dard deviation of polygenic EBV (σ
EBV
= accuracy ∗ σ
pol
), as demonstrated
Crossbred selection on QTL 315
Table V. QTL allele and desirable genotype frequencies, and polygenic and genetic
means for crossbred progenyfor phenotypic selection and for full optimal selection for
cumulative discounted response (5 generations, 30% interest) on a large effect QTL
(a = 2 polygenic standard deviations) with complete or over-dominance.
Complete dominance Over-dominance
Gene- Male/female BB+Bb Polygenic Genetic Male/female Bb Polygenic Genetic
ration frequency
1
frequency mean mean frequency frequency mean mean
Phenotypic selection
00.30/0.20 0.44 0 0 0.30/0.20 0.38 0 0
10.58/0.53 0.80 0.59 2.03 0.55/0.52 0.50 0.55 2.04
20.70/0.67 0.90 1.34 3.19 0.61/0.60 0.48 1.28 2.99
30.77/0.75 0.94 2.14 4.15 0.63/0.63 0.47 2.04 3.82
40.81/0.80 0.96 2.95 5.04 0.64/0.64 0.46 2.80 4.61
50.84/0.83 0.97 3.77 5.90 0.65/0.65 0.46 3.57 5.39
Full optimal selection
00.30/0.20 0.44 0 0 0.30/0.20 0.38 0 0
10.75/0.41 0.85 0.59 2.23 0.79/0.25 0.65 0.58 2.44
21.00/0.32 1.00 1.29 3.53 1.00/0.05 0.95 1.25 4.06
31.00/0.31 1.00 2.12 4.36 1.00/0.01 0.99 2.06 4.91
41.00/0.31 1.00 2.95 5.19 1.00/0.01 0.99 2.89 5.74
51.00/0.31 1.00 3.78 6.02 1.00/0.00 1.00 3.72 6.57
1
Frequency of the favorable QTL allele among male line and female line individuals that con-
tribute to generation t of crossbreds.
by Dekkers and van Arendonk [5]. Thus, differences between QTL selec-
tion strategies for the small, medium, and large QTL with a =
1
/
2
,1,and
2σ
pol
for EBV based on own phenotype for a trait with heritability 0.3 (thus
accuracy =
√
0.3) apply to QTL with additive effects on the EBV scale of
a = 0.91, 1.83, and 3.65σ
EBV
.
Results presented herein apply to an identified, rather than a marked, QTL
with known effects. Similar results will, however, hold for selection on markers
that are in strong and persistent population-wide gametic phase disequilibrium
with the QTL.
4.1.1. Nature of extra responses from optimal selection
The majority of the extra crossbred response obtained by optimizing selec-
tion across the planning horizon (FULLOPT) were also obtained by optimizing
316 J.C.M. Dekkers, R. Chakraborty
one generation at a time (STEPOPT); extra responses from STEPOPT were
within 2% of those from FULLOPT for nearly all scenarios evaluated (Tabs. II
and III). Strategy STEPOPT uses QTL allele substitution effects that are based
on allele frequencies among selected individuals in the opposite line, which are
the expected frequencies among potential mates in the crossbreeding phase.
In concept, this is equivalent to the allele substitution effects that are used to
derive single generation optimal breeding values derived by Dekkers [4] for
genetic improvement within a population. For maximization of crossbred per-
formance, however, selected mates originate from the opposite line, rather than
from the same population. Because selection in one line depends on selection
in the other line, allele substitution effects under STEPOPT must be derived
numerically, similar to Dekkers [4].
Greater crossbred performance from FULLOPT and STEPOPT resulted not
only from greater QTL response, but also from greater polygenic responses
(Figs. 3, 5 and Tab. IV). This is most clearly demonstrated for QTL with com-
plete dominance, where emphasis on the QTL was relaxed in one of the lines,
as the favorable allele was moved to fixation in the other line (Fig. 1b). This
allowed rapid increases in the frequency of desirable genotypes while maxi-
mizing polygenic response. Which line was chosen for fixation of the favor-
able allele depended on starting frequencies and selection intensities in the two
lines, and on the effect of the QTL. For example, with equal selection inten-
sities in both lines, the QTL was fixed in the line with the highest starting
frequency (Figs. 1 and 4). However, when selection intensities were reduced
in the line with the higher starting frequency, fixation in the other line was
more beneficial, except when the QTL effect was small (Tab. IV). The reason
for the latter is that with small QTL, rapid changes in QTL frequencies are
less important than maximizing polygenic response. The same three factors
determined in which line the favorable allele was fixed for a QTL with over-
dominance (Fig. 4 and Tab. IV). Choice of the correct line to fix the favorable
allele in may not have a large impact on results, however, except when starting
frequencies differ widely. In practice, other factors, including marketing, costs
of genotyping, and direct and pleiotropic QTL effects, which may make a cer-
tain genotype more or less suitable for a male than a female line, will play a
role in determining which line to fix the favorable allele in.
Full optimal selection generally minimized the extra effort required to move
QTL to their optimal frequencies by gradual and unidirectional increases or
decreases in frequencies in each of the two lines, such that polygenic response
was maximized. There were, however, some exceptions. For example, with a
large overdominant QTL, the frequency in the female line initially increased
Crossbred selection on QTL 317
from 0.2 to 0.35 in generation 1, followed by a gradual decrease (Fig. 2b). No-
tice that STEPOPT also had a slight increase in frequency in generation 1 in the
female line, but only to 0.25. Although these increases resulted in some loss in
polygenic response, both in generation 1 and in later generations because the
increase in frequency had to be reversed, these losses were more than offset
by greater responses obtained from the QTL. To illustrate the latter, with the
allele frequency in generation 1 for FULLOPT being 0.7, an increase in the
frequency in the female line to 0.35 resulted in a 0.12σ
pol
greater mean QTL
genotype value than maintaining the frequency at 0.2. Although this resulted in
some lost polygenic response, these losses were only 0.03σ
pol
in generation 1,
with no additional loss in generation 2 because the negative disequilibrium
that was established between the QTL and polygenes in generation 1 led to an
automatic decline in frequency in generation 2. Even accumulated over gen-
erations, the short-term gain in QTL response more than offset the permanent
loss of polygenic response.
4.1.2. Standard selection strategies on QTL
Both standard strategies of selection on the QTL, STD and ALTSTD, re-
sulted in substantially lower responses than the optimal strategies (Tabs. II
and III) and often had lower responses than phenotypic selection. Both STD
and ALTSTD use QTL allele substitution effects derived from QTL frequen-
cies among selection candidates, rather than frequencies among selected indi-
viduals, which are used for STEPOPT.For STD selection, which uses frequen-
cies from the individual’s own line, this results in selection toward the same
frequency in both lines; fixation of the favorable allele for QTL with partial
or complete dominance and toward the equilibrium frequency for overdom-
inant QTL. For overdominant QTL, the path to fixation tended to be erratic
for STD, with frequencies oscillating around the equilibrium because of the
change in sign of the allele substitution effect across the point of equilibrium
(Fig. 4). Strategy ALTSTD uses frequencies in the opposite line to compute
allele substitution effects. This is similar to STEPOPT, which also uses fre-
quencies from the opposite line, except frequencies used for STEPOPT are
among selected individuals, rather than based on all selection candidates. Use
of frequencies from the opposite line, as in ALTSTD, instead of frequencies
from the same line, as in STD, has limited impact for QTL with partial or
complete dominance; the QTL is moved toward fixation in both lines for both
STD and ALTSTD, although the rate of fixation may differ between the two
strategies. For overdominant QTL, however, ALTSTD resulted in divergence
318 J.C.M. Dekkers, R. Chakraborty
of allele frequencies in the two lines, as illustrated in Figure 4 and Table IV.
When the two lines diverge for this strategy, however, depends on simultane-
ous changes in frequencies for each line relative to the equilibrium frequency
point and is not driven by maximizing response to selection. For example, for
the small and medium-sized QTL in Table IV, frequencies in both lines ulti-
mately diverged but at a rate determined by the combination of frequencies in
the two lines relative to the equilibrium frequency of 0.83.
The lower responses for STD and ALTSTD compared to FULLOPT are the
result of a combination of factors, depending on the level of dominance at the
QTL. In all cases, STD and ALTSTD resulted in lower polygenic response
in the initial generations because of greater emphasis on the QTL. Similar to
what has been observed for single line selection [5], polygenic response lost
in early generations was not completely recovered in later generations because
of the non-linear relationship between selection emphasis and response to se-
lection. This explains the main portion of the lower responses for STD and
ALTSTD compared to phenotypic selection. For QTL with complete domi-
nance and overdominance, two additional factors led to lower responses for
STD and ALTSTD relative to optimal selection strategies, in particular for
over-dominant QTL: (1) lower frequencies of the desirable genotype because
of lack of (for STD) or delayed (for ALTSTD) divergence of the two lines,
and (2) changes in the direction of selection on the QTL, which wasted selec-
tion effort that could have been placed on the polygenes, i.e. initial increases
in frequency of the QTL followed by a decline for ALTSTD (Fig. 4b), and the
oscillating behavior of frequencies for STD (Fig. 4).
4.2. Degree of dominance at QTL
Results showed limited benefits from optimizing selection for QTL with
partial or even complete dominance (Tabs. II and III). With partial dominance
the optimal strategy is to maximize the favorable QTL allele in both the male
and the female line, although the rate at which fixation occurs may still benefit
from optimization, similar to single line selection [6]. This may be of particular
importance with simultaneous selection on multiple QTL. Thus, opportunities
for optimal selection to capitalize on selection for increased heterosis will be
limited unless QTL with overdominance exist.
Several theories exist to explain the nature of heterotic effects that are ob-
served for quantitative traits, including the dominance and over-dominance
models of heterosis [14]. Whereas heterosis results from heterozygote supe-
riority under the overdominance model, under the dominance model, heterotic
Crossbred selection on QTL 319
effects are due to multiple genes with partial or complete dominance for which
favorable alleles are in higher frequency in one line for some genes and for
other genes in the other line. The ability to distinguish between these two
modesofactionisdifficult by conventional quantitative genetic means and
requires adequate population designs, even for the study of dominance at the
individual gene level based on molecular information. For example, many re-
cent QTL studies, in particular in breed crosses, have found overdominant
QTL [8, 15]. Most of these may, however, represent pseudo overdominance
effects that are caused by linked QTL in repulsion phase rather real overdomi-
nance at a single QTL [14]. If their linkage and linkage disequilibrium is tight,
however, pseudo overdominance effects are expected to persist for some time
in the population and there would be benefit to divergent selection to cap-
italize on short-term benefits. Sufficient emphasis would need to be put on
identification of and subsequent selection on recombinants that break the re-
pulsion phase as they occur. Methods for optimization of selection on multiple
linked QTL developed by Chakraborty et al. [3] and implemented by Dekkers
et al. [7] could be used to optimize such selection.
4.3. Separate male and female lines versus single line selection
Simultaneous optimal selection within two lines led to greater responses
than optimal selection within a single line (Tabs. II and III). Benefits of FUL-
LOPT over SLOPT were less than 2% for additive QTL but up to 14% with
overdominance. The main reason for these differences is that single line selec-
tion limits increases in the frequency of heterozygotes (Fig. 4); although sires
and dams can be differentially selected for the QTL within a single line, their
joint contributions determine the frequency of the QTL in next generation. As
a result, QTL frequencies diverged little between sires and dams with SLOPT,
except for the final generations (Fig. 4).
Although optimal selection in two lines resulted in greater responses than
optimal selection within a single line, the magnitude of these differences may
not justify the extra expenses of maintaining two instead of one line. There
are, however, other reasons for having separate male and female lines, includ-
ing dominance for genes other than those that have been identified, comple-
mentarity, and marketing. Even when all QTL that contribute to heterosis have
been identified and the majority of the benefit of heterosis can be obtained by
optimal selection within a line, especially with limited overdominance, there
would still be merit to maintaining separate male and female lines to capitalize
on complementarity. Thus, the results presented here provide insight into the
320 J.C.M. Dekkers, R. Chakraborty
benefit of and optimal strategies for the use of identified QTL in systems where
crossbreeding is the predetermined breeding system.
4.4. Selective mating on QTL genotype
In this study, parents for the multiplier and commercial level were randomly
selected and mated. Random mating allowed genotype frequencies at the com-
mercial level to be determined entirely by allele frequencies in the nucleus pop-
ulations, which simplified the model. Selection of multiplier and commercial
parents would reduce the polygenic lag between the nucleus and the commer-
cial population. It could also increase the benefit of optimal selection strategies
because some changes in QTL frequencies could be accomplished by selection
of multiplier parents, which would increase the emphasis placed on polygenic
response at the nucleus level. Note that selection of multiplier parents based on
the QTL would not require extra genotyping. Additional selection on the QTL
among commercial parents would require additional genotyping, although se-
lection at this level could be based on probabilities of QTL genotypes, as de-
termined by genotypes of their nucleus-level parents.
The use of QTL genotype information could be further enhanced by ar-
ranging specific matings based on QTL genotype. For QTL with complete
and over-dominance, genotyping at the multiplier level would allow mating
of opposite homozygotes to maximize the frequency of heterozygotes at the
commercial level. This, however, would require extensive genotyping. An al-
ternative is to mate based on probabilities of QTL genotype, as determined
by genotypes of nucleus-level parents. Mating at the nucleus level could be
arranged to maximize the informativeness of such probabilities. Methods of
total genetic resource management described by Kinghorn et al. [11] could be
used to develop such strategies.
Note that separate male and female lines would not be required for max-
imizing the frequency of heterozygotes at the commercial level if mating of
commercial parents based on QTL genotype is possible. Instead, much of the
advantage of QTL information could be achieved by selection within a sin-
gle population. Thus, optimal use of QTL information may not require the use
of crossbreeding programs, but such programs are often desirable for comple-
mentarity and other factor, as discussed previously. In addition, opportunities
for selective mating based on observed genotypes or genotype probabilities
determined from (grand-)parents are reduced when multiple QTL are selected
on simultaneously.
Crossbred selection on QTL 321
Li et al. [13] considered a similar population structure as evaluated here but
optimized selection and mating of parents for both pure- and cross-breeding. A
trait affected by a single gene was considered (no polygenes), which may affect
the applicability of their conclusions. Optimization of cumulative discounted
response was by differential evolution, which is more flexible in accommo-
dating constraints than the optimal control theory that was used in the present
study. Similar to what was observed in the present study, QTL frequencies in
the male and female lines diverged for optimal selection, but in a more rapid
manner because all emphasis was on the QTL (no polygenes). Li et al. [13]
found substantially greater extra cumulative discounted responses in crossbred
performance over five generations over a strategy similar to ALTSTD with se-
lective mating than what was observed in the present study: from 5 to 28%
for complete dominance, depending on starting QTL frequencies, and from 11
to 81% for an over-dominant QTL (d = 2a). For the over-dominant QTL, the
benefit was greatest (81%) when starting QTL frequencies were equal to 0.5
in both populations. The greater responses can be explained by several fac-
tors: not considering polygenes, selection of parents for cross-breeding, and
optimization of mating as well as selection. It is unclear to what extent each
of these contributed to the extra response. Not considering polygenes results
in a large amount of heterosis, especially with overdominance, and does not
require simultaneous improvement of polygenes, which increases the benefit
that can be obtained from the QTL.
4.5. Selection on QTL in crossbreeding systems
Selection on QTL genotype at the nucleus level reduces the need for cross-
bred testing that is required for combined crossbred and purebred selection
(CCPS), thereby saving important test resources and enabling the short gener-
ation intervals of purebred selection. Although a two-breed terminal cross was
modeled here, results in principle apply to any crossbreeding system.
The results presented here assumed additive polygenic effects, which is un-
likely if dominance is observed at identified QTL. Purebred selection based on
breeding values derived from phenotype does, however, only act on the addi-
tive portion of genetic variance. Thus, presence on non-additive polygenic ef-
fects will not change the results of the comparison of QTL versus phenotypic
selection when based on purebred data. Non-additive polygenic effects will,
however, increase the benefit of using crossbred data in combined crossbred
and purebred selection [21].