Tài liệu Báo cáo khoa học: "A Unified Framework for Automatic Evaluation using N-gram Co-Occurrence Statistics" pptx
Bạn đang xem bản rút gọn của tài liệu. Xem và tải ngay bản đầy đủ của tài liệu tại đây (182.22 KB, 8 trang )
A Unified Framework for Automatic Evaluation using
N-gram Co-Occurrence Statistics
Radu SORICUT
Information Sciences Institute
University of Southern California
4676 Admiralty Way
Marina del Rey, CA 90292, USA
Eric BRILL
Microsoft Research
One Microsoft Way
Redmond, WA 98052, USA
Abstract
In this paper we propose a unified framework
for automatic evaluation of NLP applications
using N-gram co-occurrence statistics. The
automatic evaluation metrics proposed to date
for Machine Translation and Automatic
Summarization are particular instances from
the family of metrics we propose. We show
that different members of the same family of
metrics explain best the variations obtained
with human evaluations, according to the
application being evaluated (Machine
Translation, Automatic Summarization, and
Automatic Question Answering) and the
evaluation guidelines used by humans for
evaluating such applications.
1 Introduction
With the introduction of the BLEU metric for
machine translation evaluation (Papineni et al,
2002), the advantages of doing automatic
evaluation for various NLP applications have
become increasingly appreciated: they allow for
faster implement-evaluate cycles (by by-passing
the human evaluation bottleneck), less variation in
evaluation performance due to errors in human
assessor judgment, and, not least, the possibility of
hill-climbing on such metrics in order to improve
system performance (Och 2003). Recently, a
second proposal for automatic evaluation has come
from the Automatic Summarization community
(Lin and Hovy, 2003), with an automatic
evaluation metric called ROUGE, inspired by
BLEU but twisted towards the specifics of the
summarization task.
An automatic evaluation metric is said to be
successful if it is shown to have high agreement
with human-performed evaluations. Human
evaluations, however, are subject to specific
guidelines given to the human assessors when
performing the evaluation task; the variation in
human judgment is therefore highly influenced by
these guidelines. It follows that, in order for an
automatic evaluation to agree with a human-
performed evaluation, the evaluation metric used
by the automatic method must be able to account,
at least to some degree, for the bias induced by the
human evaluation guidelines. None of the
automatic evaluation methods proposed to date,
however, explicitly accounts for the different
criteria followed by the human assessors, as they
are defined independently of the guidelines used in
the human evaluations.
In this paper, we propose a framework for
automatic evaluation of NLP applications which is
able to account for the variation in the human
evaluation guidelines. We define a family of
metrics based on N-gram co-occurrence statistics,
for which the automatic evaluation metrics
proposed to date for Machine Translation and
Automatic Summarization can be seen as particular
instances. We show that different members of the
same family of metrics explain best the variations
obtained with human evaluations, according to the
application being evaluated (Machine Translation,
Automatic Summarization, and Question
Answering) and the guidelines used by humans
when evaluating such applications.
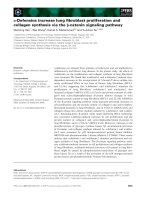
2 An Evaluation Plane for NLP
In this section we describe an evaluation plane
on which we place various NLP applications
evaluated using various guideline packages. This
evaluation plane is defined by two orthogonal axes
(see Figure 1): an Application Axis, on which we
order NLP applications according to the
faithfulness/compactness ratio that characterizes
the application’s input and output; and a Guideline
Axis, on which we order various human guideline
packages, according to the precision/recall ratio
that characterizes the evaluation guidelines.
2.1 An Application Axis for Evaluation
When trying to define what translating and
summarizing means, one can arguably suggest that
a translation is some “as-faithful-as-possible”
rendering of some given input, whereas a summary
is some “as-compact-as-possible” rendering of
some given input. As such, Machine Translation
(MT) and Automatic Summarization (AS) are on
the extremes of a faithfulness/compactness (f/c)
ratio between inputs and outputs. In between these
two extremes lie various other NLP applications: a
high f/c ratio, although lower than MT’s,
characterizes Automatic Paraphrasing (paraphrase:
To express, interpret, or translate with latitude);
close to the other extreme, a low f/c ratio, although
higher than AS’s, characterizes Automatic
Summarization with view-points (summarization
which needs to focus on a given point of view,
extern to the document(s) to be summarized).
Another NLP application, Automatic Question
Answering (QA), has arguably a close-to-1 f/c
ratio: the task is to render an answer about the
thing(s) inquired for in a question (the faithfulness
side), in a manner that is concise enough to be
regarded as a useful answer (the compactness
side).
2.2 An Guideline Axis for Evaluation
Formal human evaluations make use of various
guidelines that specify what particular aspects of
the output being evaluated are considered
important, for the particular application being
evaluated. For example, human evaluations of MT
(e.g., TIDES 2002 evaluation, performed by NIST)
have traditionally looked at two different aspects
of a translation: adequacy (how much of the
content of the original sentence is captured by the
proposed translation) and fluency (how correct is
the proposed translation sentence in the target
language). In many instances, evaluation
guidelines can be linearly ordered according to the
precision/recall (p/r) ratio they specify. For
example, evaluation guidelines for adequacy
evaluation of MT have a low p/r ratio, because of
the high emphasis on recall (i.e., content is
rewarded) and low emphasis on precision (i.e.,
verbosity is not penalized); on the other hand,
evaluation guidelines for fluency of MT have a
high p/r ratio, because of the low emphasis on
recall (i.e., content is not rewarded) and high
emphasis on wording (i.e., extraneous words are
penalized). Another evaluation we consider in this
paper, the DUC 2001 evaluation for Automatic
Summarization (also performed by NIST), had
specific guidelines for coverage evaluation, which
means a low p/r ratio, because of the high
emphasis on recall (i.e., content is rewarded). Last
but not least, the QA evaluation for correctness we
discuss in Section 4 has a close-to-1 p/r ratio for
evaluation guidelines (i.e., both correct content and
precise answer wording are rewarded).
When combined, the application axis and the
guideline axis define a plane in which particular
evaluations are placed according to their
application/guideline coordinates. In Figure 1 we
illustrate this evaluation plane, and the evaluation
examples mentioned above are placed in this plane
according to their coordinates.
3 A Unified Framework for Automatic
Evaluation
In this section we propose a family of evaluation
metrics based on N-gram co-occurrence statistics.
Such a family of evaluation metrics provides
flexibility in terms of accommodating both various
NLP applications and various values of
precision/recall ratio in the human guideline
packages used to evaluate such applications.
3.1 A Precision-focused Family of Metrics
Inspired by the work of Papineni et al. (2002) on
BLEU, we define a precision-focused family of
metrics, using as parameter a non-negative integer
N. Part of the definition includes a list of stop-
words (SW) and a function for extracting the stem
of a given word (ST).
Suppose we have a given NLP application for
which we want to evaluate the candidate answer
set Candidates for some input sequences, given a
Figure 1: Evaluation plane for NLP applications
adequacy evaluation
TIDES−MT(2002)
precision
recall
precision
recall
faithfulness
compactness
l
ow
faithfulness
compactness
AS
MT
fluency evaluation
TIDES−MT(2002)
QA(2004)
correctness evaluatio
n
coverageevaluation
DUC−AS (2001)
Guideline Axis
QA
low high
high
A
pplication
A
xis
reference answer set References. For each
individual candidate answer C, we define S(C,n)
as the multi-set of n-grams obtained from the
candidate answer C after stemming the unigrams
using ST and eliminating the unigrams found in
SW. We therefore define a precision score:
∑∑
∑∑
∈∈
∈∈
=
}{),(
}{),(
)(
)(
)(
CandidatesCnCSngram
CandidatesCnCSngram
clip
ngramCount
ngramCount
nP
where Count(ngram) is the number of n-gram
counts, and Count
clip
(ngram) is the maximum
number of co-occurrences of ngram in the
candidate answer and its reference answer.
Because the denominator in the P(n) formula
consists of a sum over the proposed candidate
answers, this formula is a precision-oriented
formula, penalizing verbose candidates. This
precision score, however, can be made artificially
higher when proposing shorter and shorter
candidate answers. This is offset by adding a
brevity penalty, BP:
<⋅
≥⋅
=
−
||||,
||||,1
|)|/||1(
rcBife
rcBif
BP
cBr
where |c| equals the sum of the lengths of the
proposed answers, |r| equals the sum of the lengths
of the reference answers, and B is a brevity
constant.
We define now a precision-focused family of
metrics, parameterized by a non-negative integer
N, as:
)))(log(exp()(
1
nPwBPNPS
N
n
n
∑
=
⋅=
This family of metrics can be interpreted as a
weighted linear average of precision scores for
increasingly longer n-grams. As the values of the
precision scores decrease roughly exponentially
with the increase of N, the logarithm is needed to
obtain a linear average. Note that the metrics of
this family are well-defined only for N’s small
enough to yield non-zero P(n) scores. For test
corpora of reasonable size, the metrics are usually
well-defined for N≤4.
The BLEU proposed by Papineni et al. (2002)
for automatic evaluation of machine translation is
part of the family of metrics PS(N), as the
particular metric obtained when N=4, w
n
–s are 1/N,
the brevity constant B=1, the list of stop-words SW
is empty, and the stemming function ST is the
identity function.
3.2 A Recall-focused Family of Metrics
As proposed by Lin and Hovy (2003), a
precision-focused metric such as BLEU can be
twisted such that it yields a recall-focused metric.
In a similar manner, we define a recall-focused
family of metrics, using as parameter a non-
negative integer N, with a list of stop-words (SW)
and a function for extracting the stem of a given
word (ST) as part of the definition.
As before, suppose we have a given NLP
application for which we want to evaluate the
candidate answer set Candidates for some input
sequences, given a reference answer set
References. For each individual reference answer
R, we define S(R,n) as the multi-set of n-grams
obtained from the reference answer R after
stemming the unigrams using ST and eliminating
the unigrams found in SW. We therefore define a
recall score as:
∑∑
∑
∑
∈∈
∈∈
=
}{Re ),(
}{Re ),(
)(
)(
)(
ferencesRnRSngram
ferencesRnRSngram
clip
ngramCount
ngramCount
nR
where, as before, Count(ngram) is the number of
n-gram counts, and Count
clip
(ngram) is the
maximum number of co-occurrences of ngram in
the reference answer and its corresponding
candidate answer. Because the denominator in the
R(n) formula consists of a sum over the reference
answers, this formula is essentially a recall-
oriented formula, which penalizes incomplete
candidates. This recall score, however, can be
made artificially higher when proposing longer and
longer candidate answers. This is offset by adding
a wordiness penalty, WP:
>⋅
≤⋅
=
−
||||,
||||,1
|)|/||1(
rcWife
rcWif
WP
rcW
where |c| and |r| are defined as before, and W is a
wordiness constant.
We define now a recall-focused family of
metrics, parameterized by a non-negative integer
N, as:
)))(log(exp()(
1
nRwWPNRS
N
n
n
∑
=
⋅=
This family of metrics can be interpreted as a
weighted linear average of recall scores for
increasingly longer n-grams. For test corpora of
reasonable size, the metrics are usually well-
defined for N≤4.
The ROUGE metric proposed by Lin and Hovy
(2003) for automatic evaluation of machine-
produced summaries is part of the family of
metrics RS(N), as the particular metric obtained
when N=1, w
n
–s are 1/N, the wordiness constant
W=∞, the list of stop-words SW is their own , and
the stemming function ST is the one defined by the
Porter stemmer (Porter 1980).
3.3 A Unified Framework for Automatic
Evaluation
The precision-focused metric family PS(N) and
the recall-focused metric family RS(N) defined in
the previous sections are unified under the metric
family AEv(α,N), defined as:
)()1()(
)()(
),(
NPSNRS
NPSNRS
NAEv
⋅−+⋅
=
αα
α
This formula extends the well-known F-measure
that combines recall and precision numbers into a
single number (van Rijsbergen, 1979), by
combining recall and precision metric families into
a single metric family. For α=0, AEv(α,N) is the
same as the recall-focused family of metrics
RS(N); for α=1, AEv(α,N) is the same as the
precision-focused family of metrics PS(N). For α
in between 0 and 1, AEv(α,N) are metrics that
balance recall and precision according to α. For the
rest of the paper, we restrict the parameters of the
AEv(α,N) family as follows: α varies continuously
in [0,1], N varies discretely in {1,2,3,4}, the linear
weights w
n
are 1/N, the brevity constant is 1, the
wordiness constant is 2, the list of stop-words SW
is our own 626 stop-word list, and the stemming
function ST is the one defined by the Porter
stemmer (Porter 1980).
We establish a correspondence between the
parameters of the family of metrics AEv(α,N) and
the evaluation plane in Figure 1 as follows: α
parameterizes the guideline axis (x-axis) of the
plane, such that α=0 corresponds to a low
precision/recall (p/r) ratio, and α=1 corresponds to
a high p/r ratio; N parameterizes the application
axis (y-axis) of the plane, such that N=1
corresponds to a low faithfulness/compactness (f/c)
ratio (unigram statistics allow for a low
representation of faithfulness, but a high
representation of compactness), and N=4
corresponds to a high f/c ratio (n-gram statistics up
to 4-grams allow for a high representation of
faithfulness, but a low representation of
compactness).
This framework enables us to predict that a
human-performed evaluation is best approximated
by metrics that have similar f/c ratio as the
application being evaluated and similar p/r ratio as
the evaluation package used by the human
assessors. For example, an application with a high
f/c ratio, evaluated using a low p/r ratio evaluation
guideline package (an example of this is the
adequacy evaluation for MT in TIDES 2002), is
best approximated by the automatic evaluation
metric defined by a low α and a high N; an
application with a close-to-1 f/c ratio, evaluated
using an evaluation guideline package
characterized by a close-to-1 p/r ratio (such as the
correctness evaluation for Question Answering in
Section 4.3) is best approximated by an automatic
metric defined by a median α and a median N.
4 Evaluating the Evaluation Framework
In this section, we present empirical results
regarding the ability of our family of metrics to
approximate human evaluations of various
applications under various evaluation guidelines.
We measure the amount of approximation of a
human evaluation by an automatic evaluation as
the value of the coefficient of determination R
2
between the human evaluation scores and the
automatic evaluation scores for various systems
implementing Machine Translation,
Summarization, and Question Answering
applications. In this framework, the coefficient of
determination R
2
is to be interpreted as the
percentage from the total variation of the human
evaluation (that is, why some system’s output is
better than some other system’s output, from the
human evaluator’s perspective) that is captured by
the automatic evaluation (that is, why some
system’s output is better than some other system’s
output, from the automatic evaluation perspective).
The values of R
2
vary between 0 and 1, with a
value of 1 indicating that the automatic evaluation
explains perfectly the human evaluation variation,
and a value of 0 indicating that the automatic
evaluation explains nothing from the human
evaluation variation. All the results for the values
of R
2
for the family of metrics AEv(α,N) are
reported with α varying from 0 to 1 in 0.1
increments, and N varying from 1 to 4.
4.1 Machine Translation Evaluation
The Machine Translation evaluation carried out
by NIST in 2002 for DARPA’s TIDES programme
involved 7 systems that participated in the
Chinese-English track. Each system was evaluated
by a human judge, using one reference extracted
from a list of 4 available reference translations.
Each of the 878 test sentences was evaluated both
for adequacy (how much of the content of the
original sentence is captured by the proposed
translation) and fluency (how correct is the
proposed translation sentence in the target
language). From the publicly available data for this
evaluation (TIDES 2002), we compute the values
of R
2
for 7 data points (corresponding to the 7
systems participating in the Chinese-English
track), using as a reference set one of the 4 sets of
reference translations available.
In Table 1, we present the values of the
coefficient of determination R
2
for the family of
metrics AEv(α,N), when considering only the
fluency scores from the human evaluation. As
mentioned in Section 2, the evaluation guidelines
for fluency have a high precision/recall ratio,
whereas MT is an application with a high
faithfulness/compactness ratio. In this case, our
evaluation framework predicts that the automatic
evaluation metrics that explain most of the
variation in the human evaluation must have a high
α and a high N. As seen in Table 1, our evaluation
framework correctly predicts the automatic
evaluation metrics that explain most of the
variation in the human evaluation: metrics
AEv(1,3), AEv(0.9,3), and AEv(1,4) capture most
of the variation: 79.04%, 78.94%, and 78.87%,
respectively. Since metric AEv(1,4) is almost the
same as the BLEU metric (modulo stemming and
stop word elimination for unigrams), our results
confirm the current practice in the Machine
Translation community, which commonly uses
BLEU for automatic evaluation. For comparison
purposes, we also computed the value of R
2
for
fluency using the BLEU score formula given in
(Papineni et al., 2002), for the 7 systems using the
same one reference, and we obtained a similar
value, 78.52%; computing the value of R
2
for
fluency using the BLEU scores computed with all 4
references available yielded a lower value for R
2
,
64.96%, although BLEU scores obtained with
multiple references are usually considered more
reliable.
In Table 2, we present the values of the
coefficient of determination R
2
for the family of
metrics AEv(α,N), when considering only the
adequacy scores from the human evaluation. As
mentioned in Section 2, the evaluation guidelines
for adequacy have a low precision/recall ratio,
whereas MT is an application with high
faithfulness/compactness ratio. In this case, our
evaluation framework predicts that the automatic
evaluation metrics that explain most of the
variation in the human evaluation must have a low
α and a high N. As seen in Table 2, our evaluation
framework correctly predicts the automatic
evaluation metric that explains most of the
variation in the human evaluation: metric AEv(0,4)
captures most of the variation, 83.04%. For
comparison purposes, we also computed the value
of R
2
for adequacy using the BLEU score formula
given in (Papineni et al., 2002), for the 7 systems
using the same one reference, and we obtain a
similar value, 83.91%; computing the value of R
2
for adequacy using the BLEU scores computed
with all 4 references available also yielded a lower
value for R
2
, 62.21%.
4.2 Automatic Summarization Evaluation
The Automatic Summarization evaluation
carried out by NIST for the DUC 2001 conference
involved 15 participating systems. We focus here
on the multi-document summarization task, in
which 4 generic summaries (of 50, 100, 200, and
400 words) were required for a given set of
documents on a single subject. For this evaluation
30 test sets were used, and each system was
evaluated by a human judge using one reference
extracted from a list of 2 reference summaries.
One of the evaluations required the assessors to
judge the coverage of the summaries. The
coverage of a summary was measured by
comparing a system’s units versus the units of a
reference summary, and assessing whether each
system unit expresses all, most, some, hardly any,
or none of the current reference unit. A final
evaluation score for coverage was obtained using a
coverage score computed as a weighted recall
score (see (Lin and Hovy 2003) for more
information on the human summary evaluation).
From the publicly available data for this evaluation
(DUC 2001), we compute the values of R
2
for 15
data points available (corresponding to the 15
participating systems).
In Tables 3-4 we present the values of the
coefficient of determination R
2
for the family of
metrics AEv(α,N), when considering the coverage
4 76.10 76.45 76.78 77.10 77.40 77.69 77.96 78.21 78.45 78.67
78.87
3 76.11 76.6 77.04 77.44 77.80 78.11 78.38 78.61 78.80
78.94 79.04
2 73.19 74.21 75.07 75.78 76.32 76.72 76.96 77.06 77.03 76.87 76.58
1 31.71 38.22 44.82 51.09 56.59 60.99 64.10 65.90 66.50 66.12 64.99
N/α
0 0.1 0.2 0.3 0.4 0.5 0.6 0.7 0.8 0.9 1
Table 1: R
2
values for the family of metrics AEv(α,N), for fluency scores in MT evaluation
4
83.04
82.58 82.11 81.61 81.10 80.56 80.01 79.44 78.86 78.26 77.64
3 81.80 81.00 80.16 79.27 78.35 77.39 76.40 75.37 74.31 73.23 72.11
2 80.84 79.46 77.94 76.28 74.51 72.63 70.67 68.64 66.55 64.42 62.26
1 62.16 66.26 69.18 70.59 70.35 68.48 65.24 60.98 56.11 50.98 45.88
N/α
0 0.1 0.2 0.3 0.4 0.5 0.6 0.7 0.8 0.9 1
Table 2: R
2
values for the family of metrics AEv(α,N), for adequacy scores in MT evaluation
scores from the human evaluation, for summaries
of 200 and 400 words, respectively (the values of
R
2
for summaries of 50 and 100 words show
similar patterns). As mentioned in Section 2, the
evaluation guidelines for coverage have a low
precision/recall ratio, whereas AS is an application
with low faithfulness/compactness ratio. In this
case, our evaluation framework predicts that the
automatic evaluation metrics that explain most of
the variation in the human evaluation must have a
low α and a low N. As seen in Tables 3-4, our
evaluation framework correctly predicts the
automatic evaluation metric that explain most of
the variation in the human evaluation: metric
AEv(0,1) explains 90.77% and 92.28% of the
variation in the human evaluation of summaries of
length 200 and 400, respectively. Since metric
AEv(0, 1) is almost the same as the ROUGE metric
proposed by Lin and Hovy (2003) (they only differ
in the stop-word list they use), our results also
confirm the proposal for such metrics to be used
for automatic evaluation by the Automatic
Summarization community.
4.3 Question Answering Evaluation
One of the most common approaches to
automatic question answering (QA) restricts the
domain of questions to be handled to so-called
factoid questions. Automatic evaluation of factoid
QA is often straightforward, as the number of
correct answers is most of the time limited, and
exhaustive lists of correct answers are available.
When removing the factoid constraint, however,
the set of possible answer to a (complex, beyond-
factoid) question becomes unfeasibly large, and
consequently automatic evaluation becomes a
challenge.
In this section, we focus on an evaluation carried
out in order to assess the performance of a QA
system for answering questions from the
Frequently-Asked-Question (FAQ) domain
(Soricut and Brill, 2004). These are generally
questions requiring a more elaborated answer than
a simple factoid (e.g., questions such as: “How
does a film qualify for an Academy Award?”).
In order to evaluate such a system a human-
performed evaluation was performed, in which 11
versions of the QA system (various modules were
implemented using various algorithms) were
separately evaluated. Each version was evaluated
by a human evaluator, with no reference answer
available. For this evaluation 115 test questions
were used, and the human evaluator was asked to
assess whether the proposed answer was correct,
somehow related, or wrong. A unique ranking
number was achieved using a weighted average of
the scored answers. (See (Soricut and Brill, 2004)
for more details concerning the QA task and the
evaluation procedure.)
One important aspect in the evaluation procedure
was devising criteria for assigning a rating to an
answer which was not neither correct nor wrong.
One of such cases involved so-called flooded
answers: answers which contain the correct
information, along with several other unrelated
pieces of information. A first evaluation has been
carried with a guideline package asking the human
assessor to assign the rating correct to flooded
answers. In Table 5, we present the values of the
coefficient of determination R
2
for the family of
metrics AEv(α,N) for this first QA evaluation. On
the guideline side, the guideline package used in
this first QA evaluation has a low precision/recall
ratio, because the human judge is asked to evaluate
based on the content provided by a given answer
(high recall), but is asked to disregard the
conciseness (or lack thereof) of the answer (low
precision); consequently, systems that focus on
4 67.10 66.51 65.91 65.29 64.65 64.00 63.34 62.67 61.99 61.30 60.61
3 69.55 68.81 68.04 67.24 66.42 65.57 64.69 63.79 62.88 61.95 61.00
2 74.43 73.29 72.06 70.74 69.35 67.87 66.33 64.71 63.03 61.30 59.51
1
90.77 90.77
90.66 90.42 90.03 89.48 88.74 87.77 86.55 85.05 83.21
N/α
0 0.1 0.2 0.3 0.4 0.5 0.6 0.7 0.8 0.9 1
Table 3: R
2
for the family of metrics AEv(α,N), for coverage scores in AS evaluation (200 words)
4 81.24 81.04 80.78 80.47 80.12 79.73 79.30 78.84 78.35 77.84 77.31
3 84.72 84.33 83.86 83.33 82.73 82.08 81.39 80.65 79.88 79.07 78.24
2 89.54 88.56 87.47 86.26 84.96 83.59 82.14 80.65 79.10 77.53 75.92
1
92.28
91.11 89.70 88.07 86.24 84.22 82.05 79.74 77.30 74.77 72.15
N/α
0 0.1 0.2 0.3 0.4 0.5 0.6 0.7 0.8 0.9 1
Table 4: R
2
for the family of metrics AEv(α,N), for coverage scores in AS evaluation (400 words)
giving correct and concise answers are not
distinguished from systems that give correct
answers, but have no regard for concision. On the
application side, as mentioned in Section 2, QA is
arguably an application characterized by a close-
to-1 faithfulness/compactness ratio. In this case,
our evaluation framework predicts that the
automatic evaluation metrics that explain most of
the variation in the human evaluation must have a
low α and a median N. As seen in Table 5, our
evaluation framework correctly predicts the
automatic evaluation metric that explain most of
the variation in the human evaluation: metric
AEv(0,2) explains most of the human variation,
91.72%. Note that other members of the AEv(α,N)
family do not explain nearly as well the variation
in the human evaluation. For example, the
ROUGE-like metric AEv(0,1) explains only
61.61% of the human variation, while the BLEU-
like metric AEv(1,4) explains a mere 17.7% of the
human variation (to use such a metric in order to
automatically emulate the human QA evaluation is
close to performing an evaluation assigning
random ratings to the output answers).
In order to further test the prediction power of
our evaluation framework, we carried out a second
QA evaluation, using a different evaluation
guideline package: a flooded answer was rated
only somehow-related. In Table 6, we present the
values of the coefficient of determination R
2
for
the family of metrics AEv(α,N) for this second QA
evaluation. Instead of performing this second
evaluation from scratch, we actually simulated it
using the following methodology: 2/3 of the output
answers rated correct of the systems ranked 1
st
, 2
nd
,
3
rd
, and 6
th
by the previous human evaluation have
been intentionally over-flooded using two long and
out-of-context sentences, while their ratings were
changed from correct to somehow-related. Such a
change simulated precisely the change in the
guideline package, by downgrading flooded
answers. This means that, on the guideline side, the
guideline package used in this second QA
evaluation has a close-to-1 precision/recall ratio,
because the human judge evaluates now based both
on the content and the conciseness of a given
answer. At the same time, the application remains
unchanged, which means that on the application
side we still have a close-to-1
faithfulness/compactness ratio. In this case, our
evaluation framework predicts that the automatic
evaluation metrics that explain most of the
variation in the human evaluation must have a
median α and a median N. As seen in Table 6, our
evaluation framework correctly predicts the
automatic evaluation metric that explain most of
the variation in the human evaluation: metric
AEv(0.3,2) explains most of the variation in the
human evaluation, 86.26%. Also note that, while
the R
2
values around AEv(0.3,2) are still
reasonable, evaluation metrics that are further and
further away from it have increasingly lower R
2
values, meaning that they are more and more
unreliable for this task. The high correlation of
metric AEv(0.3,2) with human judgment, however,
suggests that such a metric is a good candidate for
performing automatic evaluation of QA systems
that go beyond answering factoid questions.
5 Conclusions
In this paper, we propose a unified framework
for automatic evaluation based on N-gram co-
occurrence statistics, for NLP applications for
which a correct answer is usually an unfeasibly
large set (e.g., Machine Translation, Paraphrasing,
Question Answering, Summarization, etc.). The
success of BLEU in doing automatic evaluation of
machine translation output has often led
researchers to blindly try to use this metric for
evaluation tasks for which it was more or less
4 63.40 57.62 51.86 46.26 40.96 36.02 31.51 27.43 23.78 20.54 17.70
3 81.39 76.38 70.76 64.76 58.61 52.51 46.63 41.09 35.97 31.33 27.15
2
91.72
89.21 85.54 80.78 75.14 68.87 62.25 55.56 49.04 42.88 37.20
1 61.61 58.83 55.25 51.04 46.39 41.55 36.74 32.12 27.85 23.97 20.54
N/α
0 0.1 0.2 0.3 0.4 0.5 0.6 0.7 0.8 0.9 1
Table 5: R
2
for the family of metrics AEv(α,N), for correctness scores, first QA evaluation
4 79.94 79.18 75.80 70.63 64.58 58.35 52.39 46.95 42.11 37.87 34.19
3 76.15 80.44 81.19 78.45 73.07 66.27 59.11 52.26 46.08 40.68 36.04
2 67.76 77.48 84.34
86.26
82.75 75.24 65.94 56.65 48.32 41.25 35.42
1 56.55 60.81 59.60 53.56 45.38 37.40 30.68 25.36 21.26 18.12 15.69
N/α
0 0.1 0.2 0.3 0.4 0.5 0.6 0.7 0.8 0.9 1
Table 6: R
2
for the family of metrics AEv(α,N), for correctness scores, second QA evaluation
appropriate (see, e.g., the paper of Lin and Hovy
(2003), in which the authors start with the
assumption that BLEU might work for
summarization evaluation, and discover after
several trials a better candidate).
Our unifying framework facilitates the
understanding of when various automatic
evaluation metrics are able to closely approximate
human evaluations for various applications. Given
an application app and an evaluation guideline
package eval, the faithfulness/compactness ratio of
the application and the precision/recall ratio of the
evaluation guidelines determine a restricted area in
the evaluation plane in Figure 1 which best
characterizes the (app, eval) pair. We have
empirically demonstrated that the metrics from the
AEv(α,N) family that best approximate human
judgment are those that have the α and N
parameters in the determined restricted area. To
our knowledge, this is the first proposal regarding
automatic evaluation in which the automatic
evaluation metrics are able to account for the
variation in human judgment due to specific
evaluation guidelines.
References
DUC. 2001. The Document Understanding
Conference. .
C.Y. Lin and E. H. Hovy. 2003. Automatic
Evaluation of Summaries Using N-gram Co-
Occurrence Statistics. In Proceedings of the
HLT/NAACL 2003: Main Conference, 150-156.
K. Papineni, S. Roukos, T. Ward, and W.J. Zhu.
2002. BLEU: a Method for Automatic
Evaluation of Machine Translation. In
Proceedings of the ACL 2002, 311-318.
M. F. Porter. 1980. An algorithm for Suffix
Stripping. Program, 14: 130-137.
F. J. Och. 2003. Minimum Error Rate Training for
Statistical Machine Translation. In Proceedings
of the ACL 2003, 160-167.
R. Soricut and E. Brill. 2004. Automatic Question
Answering: Beyond the Factoid. In Proceedings
of the HLT/NAACL 2004: Main Conference, 57-
64.
TIDES. 2002. The Translingual Information
Detection, Extraction, and Summarization
programme. .
C. J. van Rijsbergen. 1979. Information Retrieval.
London: Butterworths. Second Edition.