Báo cáo sinh học: "Breeding salmonids for feed efficiency in current fishmeal and future plant-based diet environments" docx
Bạn đang xem bản rút gọn của tài liệu. Xem và tải ngay bản đầy đủ của tài liệu tại đây (142.53 KB, 16 trang )
Genet. Sel. Evol. 39 (2007) 431–446 Available online at:
c
INRA, EDP Sciences, 2007 www.gse-journal.org
DOI: 10.1051/gse:2007013
Original article
Breeding salmonids for feed efficiency
in current fishmeal and future plant-based
diet envi ronments
Cheryl D. Q
a∗
, Antti K
a
, Juha K
b
,
Ossi R
c
a
MTT Agrifood Research Finland, Biotechnology and Food Research, Biometrical Genetics,
31600 Jokioinen, Finland
b
Finnish Game and Fisheries Research Institute Jyväskylä, Survontie 9, 40500 Jyväskylä,
Finland
c
Finnish Game and Fisheries Research Institute, Tervo Fisheries Research and Aquaculture,
72210 Tervo, Finland
(Received 9 November 2006; accepted 20 January 2007)
Abstract – The aquaculture industry is increasingly replacing fishmeal in feeds for carnivorous
fish with soybean meal (SBM). This diet change presents a potential for genotype-environment
(G × E) interactions. We tested whether current salmonid breeding programmes that evaluate
and select within fishmeal diets also improve growth and efficiency on potential future SBM
diets. A total of 1680 European whitefish from 70 families were reared with either fishmeal- or
SBM-based diets in a split-family design. Individual daily gain (DG), daily feed intake (DFI)
and feed efficiency (FE) were recorded. Traits displayed only weak G × E interactions as vari-
ances and heritabilities did not differ substantially between the diets, and cross-diet genetic
correlations were near unity. In both diets, DFI exhibited moderate heritability and had very
high genetic correlation with DG whereas FE had low heritability. Predicted genetic responses
demonstrated that selection to increase DG and FE on the fishmeal diet lead to favourable re-
sponses on the SBM diet. Selection for FE based on an index including DG and DFI achieved
at least double FE gain versus selection on DG alone. Therefore, current breeding programmes
are improving the biological ability of salmonids to use novel plant-based diets, and aiding the
aquaculture industry to reduce fishmeal use.
feed efficiency / genotype-environment interaction / selection / aquaculture / Coregonus
lavaretus
∗
Corresponding author: cheryl.quinton@mtt.fi
Article published by EDP Sciences and available at
or />432 C.D. Quinton et al.
1. INTRODUCTION
The use of fishmeal in aquaculture feeds has become a major issue as the
global industry continues to grow [10]. Fishmeal is mostly produced from
wild-caught small pelagic fish species, and is considered to be the superior
protein source for teleost fishes [18]. It is currently the major component of
diets for farmed carnivorous salmonids such as rainbow trout (Oncorhynchus
mykiss) and Atlantic salmon (Salmo salar) whose grower diets typically con-
tain 30–50% fishmeal (2000 statistics [35,45]). However, several environmen-
tal and economic reasons exist for reducing fishmeal use. These include the
decline and fluctuation of wild stocks harvested for fishmeal production due
to overfishing and natural environmental factors, instability and predicted in-
creases in fishmeal prices, and negative consumer perception of the safety of
fishmeal-fed products [10,34]. Accordingly, feed manufacturers aim to replace
fishmeal with alternatives such as plant products. Soybean meal is one source
of protein that can be successfully substituted in part for fishmeal in carnivo-
rous fishes’ feeds [18,23,36,41,43]. Some major feed companies have pledged
to reduce fishmeal use by at least 50% by 2010, and it has been predicted that
within 10 years, fish diets will be close to 100% vegetarian [39].
Aquaculture genetic improvement programmes aim to complement such
production system changes. Breeding programmes exist for all major farmed
carnivorous fish species, and have achieved improvements in growth, feed ef-
ficiency, disease resistance and product quality traits [12]. Improved feed effi-
ciency in particular is a goal of most fish breeding programmes, but genetic pa-
rameter estimates for feed consumption and efficiency are rare [21, 22, 24, 42].
This is because recording methods for individual fish feed intake have only
recently been implemented in large-scale genetics research [21, 22, 42]; thus
no current breeding programmes select directly for feed efficiency. Further-
more, all breeding programmes evaluate and select broodstock based on per-
formance with current fishmeal-based diets. Future plant-based diets may im-
pact fish breeding programmes if genotype-environment (G × E) interactions
occur. G × E interactions may occur in the form of genotype re-ranking across
environments, or scaling effects as indicated by environmental differences in
trait genetic variation [9, 30]. In a worst-case scenario, superior genotypes on
a fishmeal diet would actually be inferior on a plant-based diet. This would be
shown by a negative genetic correlation between diets [8]. In this case, current
selection on fishmeal diets would compromise performance on future plant-
based diets.
In this study, the impact of a novel soybean protein-based diet on selective
improvement of growth, feed intake and feed efficiency was investigated in
Breeding fish for novel diet efficiency 433
European whitefish (Coregonus lavaretus L.), a salmonid now farmed com-
mercially in Finland. A breeding programme has recently been established to
improve growth and feed efficiency in this species. To assess the degree to
which these traits are affected by G × E interactions when reared with either
a traditional fishmeal diet or a potential future soybean meal-based diet, we
tested whether these traits express diet-specific phenotypic and genetic vari-
ation, and estimated trait genetic correlations between the diets. To quantify
the impact of G × E interaction on selection response, we predicted genetic
changes occurring on both diets in response to alternative strategies of selec-
tion for growth or feed efficiency on either fishmeal or soybean meal-based
diets.
2. MATERIALS AND METHODS
2.1. Diet formulations
Two practical isonitrogenous and isocaloric diets were formulated (Tab. I).
In the fishmeal (FM) diet, fishmeal supplied 100% of the dietary protein. This
diet represents a typical commercial diet used in whitefish farming. In the soy-
bean meal (SBM) diet, 50% of the dietary protein was replaced with SBM-
derived protein. This diet represents a realistic future diet. Methionine, lysine
and phosphorus supplements were added to the SBM diet to balance these lev-
els with the FM diet. Ingredients were mixed in a Hobart-type mixer, extruded
(Clextral BC 45, FR) to 3.5 mm pellets, re-dried at 40–45
◦
C, top dressed with
fish oil and stored in a freezer until use.
2.2. Population and experimental design
Whitefish in the experiment originated from the breeding programme based
at the Tervo station of the Finnish Game and Fisheries Research Institute
(FGFRI). The original broodstock was established in 1998 by mating 50 wild
males and 150 wild females originating from the Kokemäki River, Finland.
In October 2003, the generation for the current experiment was established:
45 sires were mated with 52 dams in a partial factorial design to create 70 full-
and half-sib families. Each sire was mated to an average of 1.6 dams and each
dam to an average of 1.3 sires (both ranges 1–2). Genetic relationships among
sires and dams are unknown.
Families were kept separate during incubation and early rearing. At the
eyed-egg stage (January 2004), the families were transported to the FGFRI
434 C.D. Quinton et al.
Table I. Formulation and analysed nutrient composition of the experimental fishmeal
and soybean meal diets.
Fishmeal (g·kg
−1
) Soybean meal (g·kg
−1
)
Ingredient
Fishmeal, capelin
a
480 255
Soybean meal, defatted, hulls 0 411
removed by sieve
a
Fish oil, sandeel
a
160 180
Wheat gluten
a
20 20
Wheat meal
a
267.5 34.0
Wheat starch, pregelatinized
a
52.5 52.5
Mono calcium phosphate
b
016
L-lysine
c
07
DL-methionine
d
0.0 4.5
Vitamin and mineral mix
e
20 20
Analysed co mposition
Water 23 27
Crude protein 398 404
Crude lipid 210 210
Crude fibre 10 22
N-free extracts
f
359 337
Gross energy (MJ·kg
−1
) 22.6 22.3
Sources:
a
Raisio, FI;
b
Kemira, FI;
c
BASF, DE;
d
Welding GmbH, DE.
e
Added to supply (per kg diet): retinol acetate 8000 IU, cholecalciferol 3000 IU, all-
race-α-tocopheryl acetate 300 IU, menadione sodium bisulfite 10 mg, thiamine HCl
21 mg, riboflavin 30 mg, calcium d-pantothenate 92 mg, biotin 0.3 mg, folic acid
6 mg, vitamin B
12
0.04 mg, niacin 120 mg, pyridoxineHCl 20 mg, ascorbic acid (35%
Stay C) 900 mg, inositol 200 mg, manganese oxide (62% Mn) 100 mg, zinc oxide
(74% Zn) 200 mg, potassium iodide (76% I) 6 mg.
f
Calculated as 1000 – (water + protein + lipid + fibre).
Laukaa Research Station and incubated (water 4–6
◦
C). After hatching (Febru-
ary 2004), 100 to 150 fish per family were held in indoor 150 L fibreglass tanks
(water 13–15
◦
C) and fed commercial dry diets (larvae: AgloNorse, EWOS
Ltd., NO; juveniles: Nutra Parr and Royal Silver, Raisio Ltd., FI). In June
2004, approximately 40 random individuals from each family were tagged by
injecting a passive integrated transponder into the body cavity. To give all the
fish the same initial nutritional environment and to identify if tagging harmed
Breeding fish for novel diet efficiency 435
any fish, all fish were fed with a 1:1 mixture of the two experimental diets for
four weeks prior to the trial.
Twenty-four tagged fish per family were randomly sampled for the diet trial.
To construct a split-family design, each family was first randomly split into
two groups to be reared with the alternative diets. Each group was evenly dis-
tributed over 6 round 0.6 m
3
replicate tanks (12 experimental tanks in total).
Consequently, the diet trial began with a total of 1680 fish, each tank contain-
ing 140 fish (two fish from each family).
The trial was conducted from July 29 to October 21, 2004, during which fish
tripled in weight. Fish were fed 6 h·d
−1
using belt feeders. Fish were counted
and bulk-weighed biweekly and feeding was adjusted according to average
weight and tank biomass. To ensure excess feeding, the feed amounts supplied
were adjusted to be 1.3 times higher than predicted by Koskela [27]. Tanks
were supplied with fresh water (14.8–15.1
◦
C; flow rate 8–16 L·min
−1
; out-
let water O
2
level > 80% saturation) and 24 h light was provided with ceiling
fluorescent tubes. The experimental conditions were standardized to permit ac-
curate comparison of families across diets. This test environment deviates from
commercial circumstances where fish are reared in large outdoor net cages un-
der naturally varying environmental conditions.
2.3. Traits recorded
Individual body weights were recorded to the nearest g at the beginning and
end of the trial (Tab. II). Daily feed intake was measured by X-radiography [17]
5 times per individual, with 2-week intervals between measurements. On feed
intake measurement days, fish were fed with the same methods and quantity as
during normal days, but feed pellets included lead glass beads (Ballotini size
8.5; Jencons Ltd., UK) visible in X-ray. Afterward, fish were anaesthetized,
identified, and X-rayed (Bennett HFQ 3000P X-ray machine, US).
To transform the number of glass beads fed to the amount of feed ingested,
predictive regression models were established in a separate study. For each
diet, 16 samples of known weights were taken from the bead-labelled pel-
lets and X-rayed. The number of beads present in each sample was counted,
and diet-specific regression equations were obtained (R
2
= 0.97−0.98). Feed
intake (g) for each individual was predicted using these equations from the
number of beads observed under X-ray [17].
Traits analysed were individual daily weight gain (DG), average daily feed
intake (DFI) and feed efficiency (FE). Daily gain was calculated as the dif-
ference between the initial and the final body weights, divided by the number
436 C.D. Quinton et al.
of days in the trial (77–80 d, depending on the tank). Individual DFI was cal-
culated by fitting repeated measures analysis of variance with measurement
time (1–5) as the random repeated factor, and then calculating least squares
means for each individual (MIXED procedure, SAS
9.1; SAS
Inst. Inc.,
US). This was done separately within each experimental tank. Feed efficiency
was calculated as the ratio of DG to DFI.
2.4. Statistical analysis of diet effects
Diet effects on the means of body weights, DG, DFI and FE were tested with
analysis of variance (MIXED procedure). Statistical models included diet as a
fixed effect, and replicate tank nested within diet, family, and diet-family in-
teraction as random effects. For all traits, variance due to random experimental
tank-family interaction was zero and thus was excluded. Standard errors and
degrees of freedom for the F-tests of the fixed effects were calculated using
the Kenward and Roger option. Additional analyses were performed to stan-
dardize DG and DFI to a common body weight by adding initial weight as a
regression covariate to the above model.
2.5. Genetic analysis
In order to examine G × E interactions, observations recorded under each
diet treatment were treated as separate traits. For instance, DG recorded on FM
(DG
FM
) and SBM diets (DG
SBM
) were defined as different traits.
Phenotypic and genetic parameters of DG, DFI and FE were estimated us-
ing multiple-trait animal models with DMU software, applying restricted max-
imum likelihood and average information methods [31]. Models contained ex-
perimental tank as a fixed effect, and full-sib family, individual genetic and
residual error as random effects. The individual genetic effect included additive
genetic effects and parts of potential dominance effects. The random full-sib
family effect contained (co)variance due to common incubation and early rear-
ing of full sibs, as well as parts of potential dominance (co)variances. Residual
covariances between traits measured in different diets were set to zero. Stan-
dard errors of (co)variances were obtained by a first-order Taylor series expan-
sion of the average information matrix of the estimated (co)variances. Heri-
tability (h
2
) was calculated as the ratio of genetic variance to total phenotypic
variance. Full-sib family effect (c
2
) was calculated as the ratio of full-sib fam-
ily variance to total phenotypic variance. When calculating trait correlations
within diets, we did not estimate correlations between FE and its component
Breeding fish for novel diet efficiency 437
traits because this practice can be considered statistically vague due to auto-
correlation effects. To aid the reader in perceiving the results, we do however
present diet means, variances and heritabilities for FE.
Daily gain and feed intake are commonly expressed relative to body weight.
Thus, the analysis for DG and DFI was also carried out using a model that
included initial body weight as a covariate. For this study, we use the terms
“absolute” and “relative” to refer to traits analysed without and with initial
body weight as a covariate, respectively.
2.6. Prediction of genetic responses to selection
Selection index calculations were used to predict responses in DG, DFI and
FE on both FM and SBM diets to phenotypic selection [15]. Selection was not
practiced directly for FE because when selecting on a ratio, genetic changes
in the individual component traits are very difficult to control [14]. Four se-
lection strategies were compared: (a) selection for DG
FM
; (b) selection for
maximum FE
FM
where increased DG
FM
and decreased DFI
FM
were selected
for simultaneously and selection index weights were set to obtain maximum
genetic change in FE
FM
; (c) selection for DG
SBM
; and (d) selection for maxi-
mum FE
SBM
where increased DG
SBM
and decreased DFI
SBM
were selected to
obtain maximum genetic change in FE
SBM
. Strategy (a) is comparable to cur-
rent aquaculture breeding programmes that only select for growth rate. Strate-
gies (c) and (d) predict the effects of selection performed on the potential future
soybean diets.
Direct and correlated genetic responses to one generation of selection were
calculated by R = i
(
b
G
)(
b
Pb
)
−
1
2
,whereR is the vector of responses, i is
intensity of selection (set to 1), b is the vector of relative index weights which
sum to 1, G is the genetic covariance matrix and P is the phenotypic covari-
ance matrix. G and P were results from the 4-trait genetic parameter estimation
model for DG
FM
,DFI
FM
,DG
SBM
and DFI
SBM
described above. The parame-
ters for FE were not needed because all results for this ratio can be predicted
from its component traits DG and DFI [14].
To generate the alternative selection strategies, relative index weights were
modified as follows. To obtain strategy (a), the index weight for DG
FM
was
set to 1, while the weights for the three remaining traits were zero. Similarly,
for strategy (c), the index weight for DG
SBM
was set to one. For the selection
strategies to maximise FE (b and d), the maximum genetic response in FE on
both diets was obtained when half of the index weight was on DG and half
against DFI.
438 C.D. Quinton et al.
Table II. Least squares means (± s.e.), and statistical tests for the diet effect for traits
recorded on fishmeal and soybean meal diets. Denominator degrees of freedom (ddf)
shown; all numerator df = 1.
Fishmeal Soybean meal Test statistics
Trait n mean ± s.e. n mean ± s.e. ddf FP
Initial body weight (g) 818 40.9 ± 0.85 829 40.6 ± 0.87 10.0 0.78 0.3984
Final body weight (g) 765 131.2 ± 2.38 768 125.8 ± 2.24 9.7 9.36 0.0125
Daily gain (g·d
−1
) 765 1.145 ± 0.0212 768 1.091 ± 0.0201 9.5 20.0 0.0014
Daily feed intake (g·d
−1
) 817 0.948 ± 0.0236 829 1.027 ± 0.0285 9.6 7.23 0.0235
Feed efficiency 765 1.208 ± 0.0150 768 1.078 ± 0.0240 8.5 23.2 0.0011
To calculate genetic response in FE, mean FE was first calculated for each
diet from the data, i.e., before selection. Then, genetic responses to selection
were calculated for DG and DFI, and the new mean FE was calculated from
these [22].
3. RESULTS
3.1. Diet differences
As expected, whitefish performed better on the FM diet. Fish fed the FM diet
had significantly higher final body weight and DG, lower DFI, and better FE
than those fed the SBM diet (Tab. II). These diet differences remained (results
not shown) when DG and DFI were standardised by including initial body
weight as a covariate (P < 0.0001) in the statistical models.
3.2. Phenotypic and genetic (co)variation
There was no evidence for diet differences in trait phenotypic or genetic
variation. In both diets, DG and DFI showed moderate heritability whereas
FE showed very low heritability that did not differ from zero (Tab. III). For a
given trait recorded on both diets, the differences in heritabilities between diets
were relatively small (mean absolute difference = 0.07) and confidence inter-
vals overlapped considerably. Because heritabilities may remain constant even
if the underlying genetic and residual variations change, diet-specific coeffi-
cients of variation were also calculated for each trait. Diet differences between
coefficients of phenotypic variation for pairs of traits were small (mean abso-
lute difference = 1.1%) as well. Coefficients of genetic variation for absolute
and relative DG, DFI and FE were only slightly higher on the FM diet (mean
difference = 2.9%).
Breeding fish for novel diet efficiency 439
Table III. Phenotypic variance (V
P
), coefficients of genetic (CV
G
) and phenotypic
variation (CV
P
), heritability (h
2
± s.e.) and full-sib family effect (c
2
± s.e.) for absolute
and relative (Rel.) traits measured on fish reared with fishmeal and soybean meal diets.
Diet,Trait V
P
CV
G
CV
P
h
2
± s.e. c
2
± s.e.
Fishmeal
Daily gain 0.134 16.2 31.9 0.26 ± 0.18 0.13 ± 0.09
Daily feed intake 0.095 15.6 32.5 0.23 ± 0.15 0.08 ± 0.07
Feed efficiency 0.044 4.3 17.4 0.06 ± 0.10 0.04 ± 0.05
Rel. daily gain 0.090 17.0 26.1 0.42 ± 0.17 0.04 ± 0.07
Rel. daily feed intake 0.068 15.6 27.6 0.32 ± 0.14 0.03 ± 0.06
Soybean meal
Daily gain 0.100 13.1 29.0 0.20 ± 0.15 0.08 ± 0.08
Daily feed intake 0.104 12.8 31.3 0.17 ± 0.15 0.09 ± 0.08
Feed efficiency 0.033 4.3 16.9 0.07 ± 0.11 0.07 ± 0.06
Rel. daily gain 0.076 14.3 25.2 0.32 ± 0.14 0.04 ± 0.06
Rel. daily feed intake 0.081 12.6 27.8 0.21 ± 0.15 0.10 ± 0.08
Genetic correlations between the same traits recorded in each diet indicated
very little re-ranking of families across the diets. Genetic correlations (± s.e.)
between the diets for DG (0.97 ± 0.21), DFI (0.93 ± 0.28) and FE (1.00 ± 0.95)
were all close to unity. The large standard error of the FE correlation was
likely caused by the low heritability of this trait. Genetic correlations between
the diets for relative DG (0.99 ± 0.13) and relative DFI (0.97 ± 0.22) were also
very high.
Within-diet trait correlations were similar in both diets. Phenotypic (r
P
)and
genetic correlations (r
G
± s.e.) between DG and DFI were high and positive
on both FM (r
P
= 0.88, r
G
= 0.97 ± 0.05) and SBM diets (r
P
= 0.86, r
G
=
0.93 ± 0.10). Correlations between relative DG and DFI (FM r
P
= 0.82, r
G
=
0.97 ± 0.05; SBM r
P
= 0.82, r
G
= 0.96 ± 0.10) were similar to those for
absolute traits.
3.3. Prediction of selection responses
The selection index calculations showed that current selection on fishmeal
diets will lead to strong favourable correlated genetic changes for perfor-
mance on SBM diets (Fig. 1). Little difference was observed between the di-
ets for genetic response to selection. We emphasize that although the genetic
and phenotypic parameter point estimates used in the selection index differed
440 C.D. Quinton et al.
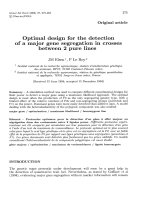
Figure 1. Genetic responses in daily gain (DG), daily feed intake (DFI) and feed efficiency (FE) in fishmeal (FM) and soybean meal
(SBM) diets in response to four alternative selection strategies: selection on DG
FM
alone, selection for maximum FE
FM
, selection for
DG
SBM
alone, and selection for maximum FE
SBM
. Genetic responses are given as percent change from the original means in the data.
Breeding fish for novel diet efficiency 441
slightly between diets, there were overlapping confidence intervals associated
with these estimates. Therefore, the genetic responses predicted from the se-
lection index represent average expected differences between the diets and also
are subject to variation around the mean.
Selection for DG
FM
caused increased DG and DFI in both diets, and genetic
responses on the FM diet were approximately 2.0% higher than on the SBM
diet. In contrast, genetic response in FE was 0.2% higher on the SBM diet
than on the FM diet. Selection for maximum FE
FM
also resulted in genetic
responses that differed only slightly between diets; responses for DG and DFI
were approximately 1% higher on the FM diet than on the SBM diet, and FE
responses were similar across diets (Fig. 1).
Direct selection for DG
SBM
or maximum FE
SBM
did not generally achieve
better genetic responses in SBM traits than the correlated responses obtained
by selection on the respective FM traits (Fig. 1). Genetic responses in DG
SBM
and FE
SBM
were 0.5% and 0.2% higher, respectively, in the DG
FM
selection
strategy than in the DG
SBM
strategy. However, genetic response in FE
SBM
was
0.46% higher in the maximum FE
SBM
strategy than in the FE
FM
strategy.
Compared with the DG selection strategies, the maximum FE
FM
and FE
SBM
strategies doubled the genetic response in FE
FM
, and tripled the FE
SBM
re-
sponse, respectively (Fig. 1). However, the FE strategies also caused approxi-
mately 4% lower responses in DG compared to DG strategies.
4. DISCUSSION
4.1. Impacts of G × E on breeding programmes
In the current study, only weak diet G × E interactions were detected for
growth, feed intake and feed efficiency in European whitefish. Therefore, in-
creased soybean meal (SBM) use in feeds does not compromise the genetic
improvements achieved by breeding programmes. In effect, results from selec-
tion index calculations show that current fish breeding programmes that select
on fishmeal diet (FM) growth or feed efficiency performance also improve their
broodstock’s ability to use novel soybean meal diets.
Furthermore, this study confirms that the current fishmeal diet is an appro-
priate environment for evaluating and selecting genotypes for improved growth
and efficiency on future soybean meal-based diets. Direct selection for FM
growthwasaseffective for improving SBM diet growth and feed efficiency
as direct selection for SBM growth. The only situation in which the SBM diet
was a superior selection environment was for direct selection for SBM diet
442 C.D. Quinton et al.
feed efficiency. Breeding programmes operating within future diet environ-
ments should therefore achieve genetic gains comparable to those with current
diets.
These results are a consequence of two factors. First, trait heritabilities and
phenotypic variations did not differ substantially across diets. Although several
studies have shown G × E interaction expressed by elevated genetic variation
in stressful or novel conditions [6], this did not occur in our study. Modern
SBM products are well processed and thus may only cause mild environmen-
tal stress in salmonids. Second, genetic correlations for DG, DFI and FE be-
tween diets were close to unity, indicating little re-ranking of families across
the diets. These weak re-rankings agree with other farmed fish studies that have
found little or no family interactions with diet nutrient levels [1, 2, 13, 22,37]
or production environments [20, 44].
Although novel soybean meal feeds should not be problematic for selective
breeding of whitefish, novel high soy diets can cause reduced growth and feed
efficiency in salmonids (e.g., [4, 40]). In the current study, the SBM diet sup-
ported slower growth but higher feed intake which indicate that it was digested
or processed less well than the FM diet, probably due to anti-nutritional factors
present in soybean meal [11] for which whitefish are not adapted. Major efforts
around the world are refining plant-protein based fish feeds through ingredient
selection, supplementation and processing techniques [11]. Our results show
that selective breeding is an effective complementary method to improve bio-
logical utilization of novel feed ingredients by farmed fish.
4.2. Genetic improvement of feed efficiency
Our results show that genetic improvement of feed efficiency for both fish-
meal and soybean meal based diets can be achieved through selection in Euro-
pean whitefish. Simultaneous selection for fast growth and reduced feed intake
achieved at least double the genetic response in feed efficiency versus selection
on growth alone.
However, genetic progress in feed efficiency occurs slowly; the greatest pre-
dicted selection responses in FE were 7–8 times smaller than gains achieved
in growth rate. Accordingly, the heritability for FE was low (0.06–0.07). This
was unexpected because in terrestrial farm animals the average heritability of
FE is moderate, 0.25, and has similar magnitude as for growth traits [38]. The
only known previous estimates of efficiency heritability in fish (0.3 in rain-
bow trout [24]) are also higher than in our data, however those were based
on family means and thus represent overestimates. In our data, feed intake
Breeding fish for novel diet efficiency 443
exhibited moderate heritability (0.17–0.32) that is typical of feed consump-
tion traits in terrestrial species (e.g., 0.25 [5], 0.23 [19]) and midway between
previous estimates for rainbow trout (average 0.10 [22]) and catfish Ictalurus
punctatus (0.41 [42]).
In terrestrial animals, improvement of feed efficiency has been attributed
to lowered maintenance energy requirements through endocrine changes [28]
and reduced thermogenesis, physical activity [29, 33] and protein turnover
rates [32]. We hypothesize that cultured salmonids can display very low FE
heritability for two reasons. First, maintenance or resting metabolism rates of
poikilothermic fish are 10 to 30 times less than mammals and up to 100 times
less than birds of the same weight [3]. Thus, potential variation in maintenance
requirements generates very little genetic variation for FE in fish. Second, be-
cause FE studies in salmonids are usually conducted during an exponential
growth phase, most feed consumed is directed to growth, and there is very lit-
tle variation in nutrient diversion to other body functions. These contribute to
an almost unity correlation between feed intake and growth that reduces vari-
ation in FE. Genetic correlations between daily gain and feed intake in both
European whitefish (0.93, 0.97; this study) and rainbow trout (0.86–0.96 [22])
were very high. In contrast, in terrestrial animals this correlation is typically
lower (0.6–0.7 [5, 7,26]).
At this time, no known fish breeding programmes select directly for feed
efficiency; all rely on a correlated genetic response obtained by sole selection
for high body weight. Previous studies have proposed that feed efficiency in
fish can be indirectly improved by selection for fast growth [16, 24, 25]. The
selection index results in the current study also support the effectiveness of
selection for growth as a strategy to indirectly improve efficiency. However,
simultaneous selection for fast growth and reduced feed intake achieved at
least double the genetic response in feed efficiency versus selection on growth
alone. Although the increase in feed efficiency generated by including feed
intake to the selection index was small (< 2%), on a production scale such
improvements translate to considerable economic benefits [25] and therefore
may merit the measurement expense in a selective breeding programme.
ACKNOWLEDGEMENTS
The authors thank M. Henryon and two anonymous referees for constructive
comments on early versions of this manuscript. The study was funded by the
Employment and Economic Development Centre of Central Finland.
444 C.D. Quinton et al.
REFERENCES
[1] Austreng E., Refstie T., Effect of varying dietary protein level in different fami-
lies of rainbow trout, Aquaculture 18 (1979) 145–156.
[2] Austreng E., Risa S., Edwards D.J., Hvidsten H., Carbohydrate in rainbow trout
diets. II. Influence of carbohydrate levels on chemical composition and feed uti-
lization of fish from different families, Aquaculture 11 (1977) 39–50.
[3] Brett J.R., The metabolic demand for oxygen in fish, particularly salmonids, and
a comparison with other vertebrates, Respir. Physiol. 14 (1972) 151–170.
[4] Bureau D.P., Harris A.M., Cho C.Y., The effects of purified alcohol extracts
from soy products on feed intake and growth of chinook salmon (Oncorhynchus
tshawytscha) and rainbow trout (Oncorhynchus mykiss), Aquaculture 161 (1998)
27–43.
[5] Cammack K.M., Leymaster K.A., Jenkins T.G., Nielsen M.K., Estimates of ge-
netic parameters for feed intake, feeding behavior, and daily gain in composite
ram lambs, J. Anim. Sci. 83 (2005) 777–785.
[6] Charmantier A., Garant D., Environmental quality and evolutionary potential:
lessons from wild populations, Proc. R. Soc. B 272 (2005) 1415–1425.
[7] Clutter A.C., Brascamp E.W., Genetics of performance traits, in: Rothschild
M.F., Ruvinsky A. (Eds.), The Genetics of the Pig, CAB International,
Wallingford, 1998, pp. 427–462.
[8] Falconer D.S., The problem of environment and selection, Am. Nat. 86 (1952)
293–298.
[9] Falconer D.S., Mackay T.F.C., Introduction to quantitative genetics, 4th edn.,
Longman, Essex, 1996.
[10] FAO Fisheries Department, The state of world fisheries and aquaculture (SOFIA)
2004, Food and Agriculture Organization of the United Nations, Rome, 2004.
[11] Francis G., Makkar H.P.S., Becker K., Antinutritional factors present in plant-
derived alternate fish feed ingredients and their effects in fish, Aquaculture 199
(2001) 197–227.
[12] Gjedrem T., Thodesen J., Selection, in: Gjedrem T. (Ed.), Selection and Breeding
Programs in Aquaculture, Springer, Dordrecht, 2005, pp. 89–111.
[13] Glover K.A., Taggart J.B., Skaala O., Teale A.J., A study of inadvertent domes-
tication selection during start-feeding of brown trout families, J. Fish Biol. 64
(2004) 1168–1178.
[14] Gunsett F.C., Linear index selection to improve traits defined as ratios, J. Anim.
Sci. 59 (1984) 1185–1193.
[15] Hazel L.N, The genetic basis for constructing selection indexes, Genetics 28
(1943) 476–490.
[16] Henryon M., Jokumsen A., Berg P., Lund I., Pedersen P.B., Olesen N.J.,
Slierendrecht W.J., Genetic variation for growth rate, feed conversion effi-
ciency, and disease resistance exists within a farmed population of rainbow trout,
Aquaculture 209 (2002) 59–76.
[17] Jobling M., Coves D., Damsgård B., Kristiansen H.R., Koskela J., Petursdottir
T.E., Kadri S., Gudmundsson O., Techniques for measuring feed intake,
Breeding fish for novel diet efficiency 445
in: Houlihan D., Boujard T., Jobling M. (Eds.), Food Intake in Fish, Blackwell
Science Inc., Oxford, 2001, pp. 49–87.
[18] Jobling M., Gomes E., Dias J., Feed types, manufacture and ingredients, in:
Houlihan D., Boujard T., Jobling M. (Eds.), Food Intake in Fish, Blackwell
Science Inc., Oxford, 2001, pp. 25–48.
[19] Johnson Z.B., Chewning J.J., Nugent R.A. III, Genetic parameters for production
traits and measures of residual feed intake in large white swine, Anim. Sci. 77
(1999) 1679–1685.
[20] Kause A., Ritola O., Paananen T., Breeding for improved appearance of
large rainbow trout in two production environments, Aquacult. Res. 35 (2004)
924–930.
[21] Kause A., Tobin D., Dobly A., Houlihan D., Martin S., Mäntysaari E.A., Ritola
O., Ruohonen K., Recording strategies and selection potential of feed intake
measured using the X-ray method in rainbow trout, Genet. Sel. Evol. 38 (2006)
389–409.
[22] Kause A., Tobin D., Houlihan D.F., Martin S.A.M., Mäntysaari E.A., Ritola O.,
Ruohonen K., Feed efficiency of rainbow trout can be improved through se-
lection: Different genetic potential on alternative diets, J. Anim. Sci. 84 (2006)
807–817.
[23] Kaushik S.J., Cravedi J.P., Lalles J.P., Sumpter J., Fauconneau B., Laroche M.,
Partial or total replacement of fish meal by soybean protein on growth, pro-
tein utilization, potential estrogenic or antigenic effects, cholesterolemia and
flesh quality in rainbow trout, Oncorhynchus mykiss, Aquaculture 133 (1995)
257–274.
[24] Kinghorn B., Genetic variation in food conversion efficiency and growth in rain-
bow trout, Aquaculture 32 (1983) 141–155.
[25] Kolstad K., Grisdale-Helland B., Gjerde B., Family differences in feed efficiency
in Atlantic salmon (Salmo salar), Aquaculture 241 (2004) 169–177.
[26] Koots K.R., Gibson J.P., Smith C., Wilton J.W., Analyses of published genetic
parameter estimates for beef production traits, 1. Heritability, Anim. Breed.
Abstr. 62 (1994) 309–338.
[27] Koskela J., Growth rate and feeding level of European whitefish (Coregonus
lavaretus L. s.l.) under hatchery conditions, Pol. Arch. Hydrobiol. 39 (1992)
731–738.
[28] Luiting P., The role of genetic variation in feed intake and its physiological as-
pects: results from selection experiments, in: van der Heide D., Huisman E.A.,
Kanis E., Osse J.W.M., Verstegen M.W.A. (Eds.), Regulation of Feed Intake,
CAB International, Wallingford, 1999, pp. 75–87.
[29] Luiting P., Schrama J.W., van der Hel W., Urff E.M., Metabolic differences be-
tween White Leghorns selected for high and low residual food consumption,
Brit. Poult. Sci. 32 (1991) 763–782.
[30] Lynch M., Walsh B., Genetics and analysis of quantitative traits, Sinauer
Associates, Sunderland, 1998.
[31] Madsen P., Jensen J., A user’s guide to DMU, a package for analysing multivari-
ate mixed models, Danish Institute of Agricultural Sciences, Tjele, 2006.
446 C.D. Quinton et al.
[32] McDonagh M.B., Herd R.M., Richardson E.C., Oddy V.H., Archer J.A., Arthur
P.F., Meat quality and the calpain system of feedlot steers following a single
generation of divergent selection for residual feed intake, Aust. J. Exp. Agric. 41
(2001) 1013–1021.
[33] McPhee C.P., Kerr J.C., Cameron N.D., Peri-partum posture and behaviour of
gilts and the location of their piglets in lines selected for components of efficient
lean growth, Appl. Anim. Behav. Sci. 71 (2001) 1–12.
[34] Naylor R.L., Goldburg R.J., Primavera J.H., Kautsky N., Beveridge M.C.M.,
Clay J., Folke C., Lubchenco J., Mooney H., Troel M., Effect of aquaculture on
world fish supplies, Nature 405 (2000) 1017–1024.
[35] New M.B., Wijkström U.N., Use of fishmeal and fish oil in aquafeeds: fur-
ther thoughts on the fishmeal trap, FAO Fisheries Circular C975, Food and
Agriculture Organization of the United Nations, Rome, 2002.
[36] Olli I.J., Krogdahl Å., Nutritive value of four soybean products in diets for rain-
bow trout (Oncorhynchus mykiss, Walbaum) reared in fresh water, Acta Agric.
Scand. A 44 (1994) 185–192.
[37] Palti Y., Silverstein J.T., Wieman H., Phillips J.G., Barrows F.T., Parsons J. E.,
Evaluation of family growth response to fishmeal and gluten-based diets in rain-
bow trout (Oncorhynchus mykiss), Aquaculture 255 (2006) 548–556.
[38] Pitchford W.S., Genetic improvement of feed efficiency of beef cattle: what
lessons can be learnt from other species? Aust. J. Exp. Agricult. 44 (2004)
371–382.
[39] Powell K., Fish farming: Eat your veg, Nature 426 (2003) 378–379.
[40] Refstie S., Storebakken T., Roem A.J., Feed consumption and conversion in
Atlantic salmon (Salmo salar) fed diets with fish meal, extracted soybean meal
or soybean meal with reduced content of oligosaccharides, trypsin inhibitors,
lectins and soya antigens, Aquaculture 162 (1998) 301–312.
[41] Refstie S., Storebakken T., Baeverfjord G., Roem A.J., Long-term protein and
lipid growth of Atlantic salmon (Salmo salar) fed diets with partial replacement
of fish meal by soy protein products at medium or high lipid level, Aquaculture
193 (2001) 91–106.
[42] Silverstein J.T., Bosworth B.G., Waldbieser G.C., Wolters W.R., Feed intake
in channel catfish: is there a genetic component? Aquacult. Res. 32 s1 (2001)
199–205.
[43] Storebakken T., Refstie S., Ruyter B., Soy products as fat and protein sources
in fish feeds for intensive aquaculture, in: Drackley J.K. (Ed.), Soy in Animal
Nutrition, Federation of Animal Science Societies, Savoy, 2000, pp. 127–170.
[44] Sylvén S., Rye M., Simianer H., Interaction of genotype with production system
for slaughter weight in rainbow trout (Oncorhynchus mykiss), Livest. Prod. Sci.
28 (1991) 253–263.
[45] Tacon A.G.J., Use of fish meal and fish oil in aquaculture: a global perspective,
Aquat. Resour. Cult. Dev. 1 (2004) 3–14.