Báo cáo sinh học: " Consensus genetic structuring and typological value of markers using multiple co-inertia analysis" pps
Bạn đang xem bản rút gọn của tài liệu. Xem và tải ngay bản đầy đủ của tài liệu tại đây (1.34 MB, 23 trang )
Genet. Sel. Evol. 39 (2007) 545–567 Available online at:
c
INRA, EDP Sciences, 2007 www.gse-journal.org
DOI: 10.1051/gse:2007021
Original article
Consensus genetic structuring
and typological value of markers using
multiple co-inertia analysis
Denis L
¨
a∗
, Thibaut J
b
, Anne-Béatrice D
b
,
Katayoun M
-G
c
a
Station de génétique quantitative et appliquée UR337, INRA, 78352 Jouy-en-Josas, France
b
Université de Lyon, Université Lyon 1, CNRS, UMR 5558, Laboratoire de biométrie et
biologie évolutive, 69622 Villeurbanne Cedex, France
c
Laboratoire de génétique biochimique et de cytogénétique UR339, INRA,
78352 Jouy-en-Josas, France
(Received 23 October 2006; accepted 20 April 2007)
Abstract – Working with weakly congruent markers means that consensus genetic structur-
ing of populations requires methods explicitly devoted to this purpose. The method, which is
presented here, belongs to the multivariate analyses. This method consists of different steps.
First, single-marker analyses were performed using a version of principal component analysis,
which is designed for allelic frequencies (%PCA). Drawing confidence ellipses around the pop-
ulation positions enhances %PCA plots. Second, a multiple co-inertia analysis (MCOA) was
performed, which reveals the common features of single-marker analyses, builds a reference
structure and makes it possible to compare single-marker structures with this reference through
graphical tools. Finally, a typological value is provided for each marker. The typological value
measures the efficiency of a marker to structure populations in the same way as other markers.
In this study, we evaluate the interest and the efficiency of this method applied to a European and
African bovine microsatellite data set. The typological value differs among markers, indicating
that some markers are more efficient in displaying a consensus typology than others. Moreover,
efficient markers in one collection of populations do not remain efficient in others. The number
of markers used in a study is not a sufficient criterion to judge its reliability. “Quantity is not
quality”.
congruence / multiple co-inertia analysis / biodiversity / microsatellite / allelic frequencies
1. INTRODUCTION
Today, a large number of studies are aimed at investigating the genetic struc-
turing of populations within species. The goal of such studies is first to provide
∗
Corresponding author:
Article published by EDP Sciences and available at
or />546 D. Laloë et al.
insight into the management and conservation of today’s animal and plant ge-
netic resources, the history of populations: demography [7, 39], origin and mi-
gration routes for human populations [14] or the history of livestock domesti-
cation [9, 11]. Epidemiological considerations can also motivate such studies
in human populations [56]. However, the most common justification of these
studies is their importance for quantifying biodiversity and thus for establish-
ing priorities in conservation programs [10, 22, 41, 59,64].
Under the coordination of the FAO, an initiative called the measurement
of domestic animal diversity (MoDAD) was started in order to provide tech-
nical recommendations for studies in farm animals [24]. Among the many
DNA tools available, microsatellites are the most widely used mainly be-
cause of their high variability. Within this context, an FAO/ISAG advisory
group has been formed to recommend species-specific lists of microsatel-
lite loci (about 30 per species) for the major farm animal species (cat-
tle, buffalo, yak, goat, sheep, pig, horse, donkey, chicken and camelids;
The adherence to such
recommendations permits reasonable comparisons of parallel or overlapping
studies of genetic diversity and it is a necessary prerequisite to combine results
in meta-analyses [60]. Within this context, Baumung et al. [5] published the
results from a survey concerning 87 projects of genetic domestic studies in do-
mestic livestock. In their article, they underline that the recommended markers
are well known and used in 79% of the projects.
Generally, in these studies on genetic structuring, two methods were per-
formed: phylogenetic reconstruction [46, 57, 67] and/or multivariate proce-
dures [8, 15, 63, 65,69]. In phylogenetic reconstruction, a consensus tree is
typically built to summarize information and measure the reliability of the
tree. Several methods have been proposed for inferring consensus trees, among
them the maximum agreement subtree, the strict consensus, the majority tree,
the Adams consensus and the asymmetric median tree [12, 52].
However, construction of trees using admixed populations, as is the case in
livestock species, violates the principles of phylogeny reconstruction [25, 64].
In this situation, multivariate procedures are recommended. The most com-
mon method to analyze allelic frequency data is the principal component
analysis (PCA) [6, 33, 34, 36, 37, 48]. Using such methods may result in a
non consensus representation, due to the incongruence among markers [50].
Weak congruence could also explain some of the low bootstrap values which
are typically reported in several studies in the following species: beef cat-
tle [13, 43, 45, 47,51,67], goats [35, 42], sheep [63, 70], and natural popula-
tions, such as white-tailed deer [20].
Consensus structuring and typological value 547
The markers involved in such studies are chosen to be neutral. One of the
main principles of population genomics states that neutral markers across the
genome will be similarly affected by demography and the evolutionary his-
tory of populations [44]. Accordingly, these markers should be congruent, i.e.
should reveal the same typology among populations.
Nevertheless, neutral markers may be influenced by selection on nearby
(linked) loci, and, then, reveal different patterns of variation.
Thus, a method explicitly devoted to exhibit a consensus in a multivariate
framework is necessary. In this context, the markers of interest should be both
highly variable and congruent in order to perform a consensus typology. The
multiple co-inertia analysis (MCOA) is dedicated to this purpose. MCOA was
first described by Chessel and Hanafi [17], and is used in ecology [4, 30].
In this paper, we address the capacity and efficiency of marker panels to ex-
hibit a genetic structuring and measure the contribution of each specific marker
by MCOA. In the genetic framework, this ordination method identifies the
structures of populations common to many tables of allelic frequencies. First,
single marker analyses were performed. Allelic frequencies are a special case
of compositional data [1,3]: they consist of vectors of positive values summing
to one. De Crespin de Billy et al. [19] introduced a specifically designed prin-
cipal component analysis (%PCA) for this kind of data. This method can be
used together with a biplot representation [27], which permits an interpreta-
tion of the location of a population in terms of its allelic frequencies. Adding
confidence ellipses [29] around the population points on the resulting plot im-
proves the visual assessment of the separating power of the markers. It also
allows accounting for the uncertainty due to the size of the sampled popula-
tion. Second, MCOA simultaneously finds ordinations from the tables that are
most congruent. It does this by finding successive axes from each table of al-
lelic frequencies, which maximize a covariance function. This method permits
the extraction of common information from separate analyses, in the setting-
up of a reference typology, and the comparison of each separate typology to
this reference typology. Finally, to quantify the efficiency of a marker, we in-
troduce the typological value (TV), which is the contribution of the marker to
the construction of the reference typology.
Hence, we reply to the following practical questions. Which markers con-
tribute most to the typology of populations? Do efficient markers in one col-
lection of populations remain efficient in others? Does the number of markers
ensure the reliability of the typology?
548 D. Laloë et al.
In this article, we provide a short background to MCOA, we describe the
typological value and we study the interest and efficiency of this method using
a bovine data set.
2. MATERIALS AND METHODS
2.1. Single marker analyses
Each marker yields allelic frequencies that define Euclidian distances be-
tween the populations in a multidimensional space. The principal component
analysis [33,34] can be used to find a plane on which the populations are scat-
tered as much as possible, i.e. conserving the distances among populations as
best as possible. However, this method does not take into account the true na-
ture of the data. Since allelic frequencies are positive and sum to one, they are
compositional data [1]. Aitchison addressed some issues specific to the mul-
tivariate analysis of such data [1–3] and showed that centered PCA performs
better when compositional data are transformed using log ratios or other loga-
rithmic data transformations [55]. An appealing alternative to these approaches
is to use a principal component analysis of proportion data (%PCA) [19]. In-
deed, the typologies provided by this analysis are directly interpretable in term
of allelic frequencies, which is at least discussed in former methods [68].
The %PCA yields the same axes as a classical centered PCA, and the dis-
tances between the scores of the populations are exactly the same as in PCA.
Thus the typology of the populations is not altered. %PCA differs from PCA in
that the cloud of points corresponding to the populations is not constrained to
be at the origin. Instead, the populations are placed by averaging with respect
to their allelic frequencies. The score s
i
of a population i onto an axis u is com-
puted as the mean of the allele coordinates (denoted u
j
,1≤ j ≤ p) weighted
by the corresponding allelic frequencies ( f
ij
): s
i
=
p
j=1
f
ij
u
j
.
This method makes it possible to draw meaningful biplots [19], where both
populations and alleles are represented, respectively by points and arrows. In
such biplots, the closer the populations are to an allele, the higher the corre-
sponding frequencies are.
To improve the typologies of populations obtained by %PCA, we propose
confidence ellipses as a visual tool to assess the genetic differences between
populations. Indeed, it should be valuable to take the precision of the popu-
lation frequency estimates into account. Since these frequencies are just es-
timates of the real ones, they may change from one sample to another. The
Consensus structuring and typological value 549
consequence for the typology is that the coordinates of any population fluctu-
ate around the true, unknown position. Hence, we can determine a confidence
ellipse [29], inside which the true population can be expected to be located,
with a given probability. This probability P is linked to a size factor S by:
P = 1 − exp
−
S
2
2
·
Using a PCA appropriate for allelic frequencies and confidence ellipses around
population positions should help to interpret the different typologies provided
by the markers. At this point, the multiple co-inertia makes it possible to carry
out a comparison between these typologies.
2.1.1. Multiple co-inertia analysis
Multiple co-inertia analysis is an ordination method, which simultaneously
analyzes K tables describing the same objects (in rows) with different sets of
variables (in columns). The mathematical principles of the method are fully
described by their authors [17], but we provide essential steps in the appendix;
examples of its utilization can be found in ecology studies [4,30].
Within the MCOA framework, K sets of variables produce K typologies
of the same objects on the basis of any single-table analysis, such as PCA or
correspondence analysis. MCOA relies on the idea that there may be congru-
ent structures among these typologies. The MCOA coordinates the K separate
PCA, in order to facilitate their comparison and emphasize their similarities.
A reference ordination is then constructed, which best summarizes the con-
gruent information among the sets of variables. It can thus be considered as a
“reference structure” (also called “reference”).
We apply the MCOA to analyze a set of n populations typed on K mark-
ers. The method provides a set of K coordinated %PCA, each corresponding
to a given molecular marker. These analyses can be interpreted like previous
%PCA since populations are placed by averaging with respect to the alle-
les. However, these analyses display both scattered and congruent typologies,
which can thus be compared. So, the criterion of the scores of maximum vari-
ance (used in %PCA) is no longer sufficient, and the correlation of the scores
with the reference must be taken into account. To consider these two aspects,
the MCOA maximizes the sum of the co-inertias (i.e. squared covariances) be-
tween the scores of populations of the coordinated analyses, and the reference.
Let l
r
k
be the r
th
scores of populations in the coordinated %PCA of a marker k
(with 1 ≤ k ≤ K),and v
r
be the r
th
reference scores. The criterion optimized in
550 D. Laloë et al.
MCOA is then:
K
k=1
w
k
cov
2
(l
r
k
, v
r
) =
K
k=1
w
k
var(l
r
k
)var(v
r
)corr
2
(l
r
k
, v
r
)(1)
where w
k
is a given weight for the marker k. These weights can be chosen
according to the nature and disparity of the markers. We choose here uniform
weights (w
k
=
1
K
) for every marker, but it is possible, for instance, to choose
w
k
so that markers of different types are on the same level of variation.
The optimized criterion (1) guarantees that the typologies are scattered
(maximization of the variance of the scores) and emphasizes their common
structure (maximization of the squared correlation). This matches our defini-
tion of what a “good marker” is, from a typological point of view: a marker
which can separate the populations well, and which separates them like many
other markers. Mathematically, this exactly corresponds to the contribution of
a marker to the MCOA criterion:
w
k
cov
2
(l
r
k
, v
r
) = w
k
var(l
r
k
)var(v
r
)corr
2
(l
r
k
, v
r
). (2)
2.2. Typological value
If the maximum of (1) is noted λ
r
, we can define the typological value (TV)
of the marker k as its relative contribution to the previous criterion:
TV
r
(k) =
w
k
cov
2
(l
r
k
, v
r
)
λ
r
· (3)
Contrary to (2), this expression is a proportion and can be expressed as a per-
centage. It corresponds to the ability of the marker k to display the r
th
reference
structure. The higher it is, the better it displays the r
th
structure of the refer-
ence. As a consequence, it can be used to compare the typological values of
a set of markers on a given structure. Whenever a structure is expressed by
more than one axis of the reference, (3) can be extended by summing sepa-
rately the numerator and denominator. For example, if an interesting structure
of populations is expressed by scores i and j, (3) is generalized as:
TV
i, j
(k) =
w
k
cov
2
(l
i
k
, v
i
) + w
k
cov
2
(l
j
k
, v
j
)
λ
i
+ λ
j
·
A last question to be tackled concerns the number of existing common struc-
tures. This is the number of scores to be kept for the reference and for each
Consensus structuring and typological value 551
coordinated analysis. This number is chosen according to the decrease of λ
r
,
as is the case in PCA with eigenvalues. However, this choice is made easier
than in PCA, since MCOA eigenvalues have the status of squared PCA eigen-
values, the differences between high ones (interesting structures) and low ones
would be clearer in MCOA.
These methods are available in the ade4 package [18] of the R software [54].
2.3. Application to data
Blood samples of 755 unrelated animals from 16 cattle breeds were ana-
lyzed:
– 11 from France: Aubrac (Aub, n = 50), Bazadaise (Baz, n = 47), Blonde
d’Aquitaine (Blo, n = 61), Bretonne Pie noire (Bre, n = 31), Charolaise (Cha,
n = 55), Gasconne (Gas, n = 50), Limousine (Lim, n = 50), Maine-Anjou (Mai,
n = 49), Montbeliarde (Mon, n = 31), Normande (Nor, n = 50) and Salers (Sal,
n = 50). Samples were collected throughout France;
– 5 from West Africa: Lagunaire (Lag, n = 51), N’Dama (N’Da, n = 30),
Somba (Som, n = 50), Sudanese Fulani Zebu (Zeb, n = 50) and Borgu (Bor,
n = 50). The Borgu breed is a crossbred between West African shorthorn cattle
and zebu. West African populations were collected in three neighboring coun-
tries: Benin, Togo and Burkina Faso. This West African data set has been taken
from [49].
All breeds were genotyped for 30 microsatellite loci recommended for ge-
netic diversity studies by the EC-funded European cattle diversity project (Res-
gen CT 98-118) and the FAO. Details on primers, original references and
experimental protocols (conditions of PCR, multiplexing) can be found at
/>These 30 microsatellites were genotyped using an ABI 377 sequencer or by
Labogena (www.labogena.fr) using an ABI 3700 sequencer.
To standardize genotypes between our laboratory and Labogena and in order
to limit genotyping errors during laboratory experiments, we used three refer-
ence animals as controls in each gel run. To limit scoring errors, the results
were recorded by two independent scorers [53].
3. RESULTS AND DISCUSSION
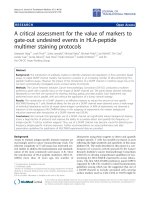
We first ran a %PCA on each microsatellite table of allelic frequencies
(single-marker analysis). Corresponding plots are drawn on the same scale for
six markers on Figure 1. For each marker, the first two axes of the %PCA are
552 D. Laloë et al.
Figure 1. Single marker %PCA (first two axes). The populations are labelled in their
confidence ellipse (P = 0.95), within an envelope formed by the alleles (arrows). Fig-
ures are on the same scale as indicated by the mesh of the grid (d = 0.5). Eigenvalue
percents are indicated for each axis. The colors are based on the most congruent dif-
ferentiation in the reference scores.
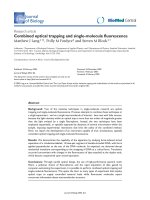
Consensus structuring and typological value 553
Figure 2. Single marker coordinated %PCA (first two axes). The populations are la-
belled in their confidence ellipse (P = 0.95), within an envelope formed by the alleles
(arrows). Figures are on the same scale as indicated by the mesh of the grid (d = 0.5).
Variance percents are indicated for each axis). The colors are based on the most con-
gruent differentiation in the reference scores.
554 D. Laloë et al.
shown. Alleles are represented by arrows, the most discriminating ones being
joined by lines. A confidence ellipse (P = 0.95) accounting for the number of
sampled animals is drawn around each population point. The barplot of eigen-
values is drawn at the bottom left. It indicates the relative magnitude of each
axis with respect to the total variance. The higher the eigenvalue is, the higher
the Euclidean distances are among populations. For example, for HEL13, the
first axis accounts for 75% of the total variance and the second axis accounts
for 21%.
For this marker, the populations are mainly structured by three alleles, al-
leles 182, 190 and 192, their allelic frequencies varying strongly according to
populations (from 0 to 0.59 for 182, from 0.02 to 0.70 for 190 and from 0.05
to 0.94 for 192). The breeds are mainly differentiated by their respective allelic
frequencies for these alleles. The Sudanese Fulani Zebu breed and Borgu lie
along the line 182–190 and African taurine breeds and French breeds lie along
the line 190–192. For example, allele 192 was highly frequent in French breeds
(0.94 in Salers), and allele 190 was frequent in African taurine breeds (0.70 for
Somba), while allele 182 was very rare in African taurine populations, absent
in the French populations and present with a frequency of 0.59 in the Sudanese
Fulani Zebu breed. Thus allele 182 could be a zebu diagnostic allele.
Some other alleles are located close to the center of the plot, because they
are rare: 178, 184, 194, 196 and 200, with maximal allelic frequencies of 0.01,
0.01, 0.07, 0.02 and 0.01, respectively. The last two alleles (186 and 188) lie
in an intermediate position: allele 186 was detected with a frequency of 0.17
in the Sudanese Fulani Zebu breed and it was nearly absent in the remaining
breeds. Allele 188 was detected only in French breeds with a maximal allelic
frequency of 0.26 for the Blonde d’Aquitaine breed. Drawing a confidence el-
lipse leads to a graphical assessment of the population structuring. Four clus-
ters can be pointed out: the French breeds (without the Bazadaise breed), the
African taurine breeds and Bazadaise breed, the Borgu breed and the Sudanese
Fulani Zebu breed.
When all the markers are considered, it is easy to see that the efficiency
of each marker differs. Some did not exhibit any clustering (INRA35), oth-
ers exhibited some clusters but not always the same. For example HEL1 and
HEL13 separated three clusters: French taurine, African taurine and African
Zebu. Some microsatellites i.e. MM12 separated the African taurine breeds
from the zebu breed. Within the French cluster, INRA63 separated three breeds
and HEL5 isolated the Maine-Anjou breed from the others.
Figure 1 is a graphical tool, which compares the usefulness of markers
for separating populations. However, the axes of each %PCA differ from one
Consensus structuring and typological value 555
marker to another, and cannot be interpreted in the same way. Axis 1 of the
HEL1 plot is not the same as Axis 1 of the MM12 plot. Single-marker struc-
tures cannot be easily compared by looking at factorial maps of separate un-
coordinated analyses. The multiple co-inertia analysis deals with this problem,
through coordinated analyses, where axes of each plot tend to display the same
structures.
Coordinated %PCA plots are drawn on the same scale for the six markers
on Figure 2. Ellipses and proximities between alleles and populations can be
interpreted in the same way as in Figure 1. However, the barplot at the bottom
left of the plot no longer represents eigenvalues, but the variance of the scores
according to the different axes. For instance, populations are more scattered
along the first axis for HEL13 than for HEL1, or INRA63.
A comparison of Figure 1 with Figure 2 shows that some markers fit the
common structures quite well. For instance, the first two axes of the plots of
HEL1, HEL13 and INRA63 are almost identical. Some others remain non ef-
ficient e.g. INRA35. However, for MM12 and HEL5, the situation is more
interesting. For MM12, axis 1 in Figure 1 is more or less axis 2 in Figure 2
of the common structure exhibited by MCOA. Concerning HEL5, in Figure 1
the most obvious feature is the separation of the Maine-Anjou breed from the
others. However this marker exhibits the common structure as indicated in Fig-
ure 2.
Therefore, the non-coordinated analyses answer the question: does the
marker separate the populations while the coordinated analysis answers the
question: how does the marker separate the populations regarding the common
structure.
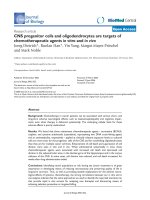
The decrease of eigenvalues shows three main structures in the reference
typology. The first three axes of the reference typology are shown in Fig-
ures 3A (axes 1 and 2) and 3B (axes 1 and 3). The first axis clearly distin-
guishes French breeds from African breeds. The second axis separates African
breeds into three groups: Taurine breeds, Borgu and Zebu. The intermediate
position of the Borgu is explained because this breed is an African shorthorn
× Zebu crossbred. The third axis separates French breeds into three clusters.
The first cluster is mainly composed of southwestern French breeds and the
Montbeliarde breed, the second is composed of Charolaise and Bretonne Pie
Noire breeds and the third distinguishes the Maine-Anjou breed. Note that
these clusters mainly fit with history and geography except for the Charolaise
and Bretonne Pie Noire cluster.
The relationship between a single marker analysis (Fig. 2) and the MCOA
(Fig. 3a) is illustrated by a cohesion plot, which is the superimposition of the
556 D. Laloë et al.
d = 1
A
Aub
Baz
Blo
Bor
Bre
Cha
Gas
Lag
Lim
Mai
Mon
NDa
Sal
Som
Zeb
Eigenvalues
d = 1
B
Aub
Baz
Blo
Bor
Bre
Cha
Gas
Lag
Lim
Mai
Mon
NDa
Sal
Som
Zeb
Eigenvalues
Figure 3. Reference scores of the multiple co-inertia analysis, displaying the most congruent structures among markers, on the
planes 1–2 (Fig. 3A) and 1–3 (Fig. 3B). A common scale is used (d = 1) for both plots. The colors indicate African breeds in blue
and French breeds in red (for the figure in color see online version).
Consensus structuring and typological value 557
two corresponding plots (Fig. 4). In this figure, the location of each data point
can be indicated using an arrow. The tip of the arrow is used to show a location
in the single marker analysis and the start of the arrow is the location of the
breed in MCOA analysis. If both typologies strongly agree, the arrows would
be short. Equally, a long arrow demonstrates a locally weak relationship among
structures.
Of the six microsatellites, INRA35 exhibits the longest arrows and is thus
the less congruent marker. With the MM12 marker, the direction of the arrows
is mainly horizontal, showing discrepancies along the first axis (separation
between France and Africa), while there is a good adequacy for the second
axis (separation between African taurine breeds and zebu breeds). However,
HEL1 reproduces the reference almost perfectly. HEL13 is also a structuring
marker for all the breeds except for the Bazadaise breed, which is clustered
with African taurine breeds.
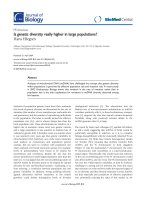
Diagrams of typological values are plotted in Figures 5A (1
st
axis),
5B (2
nd
axis) and 5C (3
rd
axis). The heterogeneity of typological values in-
creases with the number of the axis. In order to obtain a total percentage equal
or greater than 50%, nine markers are needed for axis 1, eight markers for
axis 2, and only six for axis 3. Minimum value is close to 0 for the three axes
(0.11% (INRA35), 0.07% (SPS115) and 0.02% (ILSTS005) for axes 1 to 3, re-
spectively). The maximum percentage (8.3%) for axis 1 is reached by HEL13.
This marker is also the most important for axis 2, with a typological value per-
centage equal to 9.0%. For axis 3, the typological values reach a maximum
percentage of 11.5%, for HEL5.
Some markers do not contribute to the population structuring, whatever the
axes: INRA35, INRA5 and SPS115. However, the typological values vary ac-
cording to the structures. For example, HEL13, which is the most important
marker for axes 1 and 2, is among the worst markers for axis 3 (typological
value percentage of 0.21%). Conversely, HEL5 is the most important marker
for axis 3, but not for axes 1 and 2. MM12 contributes mostly to axis 2, but not
to the other axes.
Thus, efficient markers for distinguishing African from French breeds are
not necessarily the same as for distinguishing within Africa or within France.
Correlations between typological values vary from 0.55 (axis 1 – axis 2) to
−0.13 (axis 2 – axis 3). However, typological values are robust with respect to
the set of populations that are involved in the analysis. Analyzing the subset
of French populations leads to typological values that are very well correlated
with the whole dataset (r = 0.89).
558 D. Laloë et al.
Figure 4. Cohesion plots showing the differences between the reference typology (la-
bels and arrows origin) and the coordinated single-marker analyses (normed scores)
on the first two axes. The arrows represent the typological “mistakes” displayed by the
markers. The longer an arrow is, the greater the mistake is. A common scale is used
(d = 1) for all plots.
Consensus structuring and typological value 559
BM1818
BM1824
BM2113
CSRM60
CSSM66
ETH10
ETH152
ETH185
ETH225
ETH3
HAUT24
HAUT27
HEL1
HEL13
HEL5
HEL9
ILSTS5
ILSTS6
INRA23
INRA32
INRA35
INRA37
INRA5
INRA63
MM12
SPS115
TGLA122
TGLA126
TGLA227
TGLA53
0 %
2 %
4 %
6 %
8 %
10 %
12 %
BM1818
BM1824
BM2113
CSRM60
CSSM66
ETH10
ETH152
ETH185
ETH225
ETH3
HAUT24
HAUT27
HEL1
HEL13
HEL5
HEL9
ILSTS5
ILSTS6
INRA23
INRA32
INRA35
INRA37
INRA5
INRA63
MM12
SPS115
TGLA122
TGLA126
TGLA227
TGLA53
A
BM1818
BM1824
BM2113
CSRM60
CSSM66
ETH10
ETH152
ETH185
ETH225
ETH3
HAUT24
HAUT27
HEL1
HEL13
HEL5
HEL9
ILSTS5
ILSTS6
INRA23
INRA32
INRA35
INRA37
INRA5
INRA63
MM12
SPS115
TGLA122
TGLA126
TGLA227
TGLA53
0 %
2 %
4 %
6 %
8 %
10 %
12 %
BM1818
BM1824
BM2113
CSRM60
CSSM66
ETH10
ETH152
ETH185
ETH225
ETH3
HAUT24
HAUT27
HEL1
HEL13
HEL5
HEL9
ILSTS5
ILSTS6
INRA23
INRA32
INRA35
INRA37
INRA5
INRA63
MM12
SPS115
TGLA122
TGLA126
TGLA227
TGLA53
B
BM1818
BM1824
BM2113
CSRM60
CSSM66
ETH10
ETH152
ETH185
ETH225
ETH3
HAUT24
HAUT27
HEL1
HEL13
HEL5
HEL9
ILSTS5
ILSTS6
INRA23
INRA32
INRA35
INRA37
INRA5
INRA63
MM12
SPS115
TGLA122
TGLA126
TGLA227
TGLA53
0 %
2 %
4 %
6 %
8 %
10 %
12 %
BM1818
BM1824
BM2113
CSRM60
CSSM66
ETH10
ETH152
ETH185
ETH225
ETH3
HAUT24
HAUT27
HEL1
HEL13
HEL5
HEL9
ILSTS5
ILSTS6
INRA23
INRA32
INRA35
INRA37
INRA5
INRA63
MM12
SPS115
TGLA122
TGLA126
TGLA227
TGLA53
C
Figure 5. Diagrams of typological values components, in percentages, for the three
reference structures, corresponding to (A) Africa-France separation (B) within Africa
differentiation and (C) within France differentiation.
4. CONCLUSION
In this paper, we describe the MCOA in the context of a population ge-
netic structuring analysis. This methodology is easy to use and could be of
general applicability for livestock species. The efficiency of a set of markers
is addressed with graphical tools and quantitative measures. This method is
implemented in the ade4 package [18] of the R software [54].
This method is independent of the mutation model of the markers used, and
thus can be applied to various types of markers (e.g., proteins, blood groups,
560 D. Laloë et al.
microsatellites, amplified fragment length polymorphism, single nucleotide
polymorphisms).
The choice of a weighting scheme should be thought according to the nature
of the markers involved in the study. A uniform weighting may be sensible if
only one type of markers is used, as in this paper. However, weighting each
marker by its total inertia will give the same scale of differentiation for each
marker. These two weighting options are available in the ade4 package. More-
over, thanks to the flexibility of the method, the user may supply any weighting
scheme of his/her own choice, which could be based, for instance, on the num-
ber of alleles of the marker.
Separate coordinated plots show how the markers separate the populations
regarding a common structure, while superimposed plots visually address the
discrepancies among the common structure and one single-marker structure.
The quantitative measure of typological value includes two aspects: the abil-
ity to perform a typology of populations and the degree of congruence with the
reference. Population structure is more easily exhibited using markers with
high typological values, than using those with low values. We show that effi-
cient markers in one collection of populations do not remain efficient in others.
Typological values of markers are structure-dependent. When strongly differ-
ent populations such as French and African populations are considered, all
markers roughly equally reproduce the main features of the typology. How-
ever, this is not the case for closely related populations because only a few
markers reproduce the reference typology. Thus, caution is needed in evaluat-
ing populations based on molecular studies if a small number of efficient loci
are used. These results contradict the idea [61, 62] that increasing the number
of markers will increase the reliability of the typology analysis: quantity is not
quality.
As such, a marker selection method based on the typological value should
select an efficient, not to say the most efficient, subset of markers for exhibiting
a consensus population structuring. In this respect, a general algorithm, and
particularly stopping rules for determining an optimum number of selected
markers should be investigated, as in [38,40] or [66] in a classical PCA context.
Towards a quality process, it is important to check data (sampling strategy,
DNA, experimental protocol, tracking of genotyping errors [53], standardiza-
tion of data), tools (choice of markers [58]), methods (suitability of the method
to the data and scientific goal [61,71]) and the computer programs (well estab-
lished and recommended by experts [21,32]). This process has been initiated in
livestock species by FAO guidelines [24], including recommended ISAG/FAO
sets of genetic markers for domestic species. In this respect, MCOA should
Consensus structuring and typological value 561
play a major role in the choice of panels of markers, which is essential for
an efficient design of population genetic analyses of species. A large number
of genetic diversity studies for livestock species has been carried out, some
concern livestock from a single country [23, 41, 67], others have examined di-
versity and distribution of livestock at the regional level [13, 22, 26] or even at
the scale of nearly an entire continent or all over the world [16,28,31,63]. Since
such studies are still continuing and have financial constraints, it is important
to have a measure that permits the elimination of non efficient markers from
studies. If no previous data are available, another application of the MCOA is
to study a subset of the populations, and remove the less informative markers
when completing the analysis. Luikart et al. [44] advocate the importance of
identifying “outlier loci” to avoid biased estimates of population parameters.
With that respect, MCOA and typological values should also be efficient tools
to differentiate neutral markers from markers likely to be selected from the
selection of a subset of markers, or for the comparison of the degree of differ-
entiation in neutral marker loci and genes coding quantitative traits [58, 64].
ACKNOWLEDGEMENTS
We acknowledge the assistance of the respective breeders associations in the
collection of French cattle samples. We acknowledge the following persons
for their help in planning and conducting the sampling missions for African
samples: V. Codja (Bénin), N.T. Kouagou (Togo), I. Sidibé (Burkina Faso). We
also thank J.A. Lenstra for his coordination of the wider European project. This
work was funded by the European Commission, Contract CT98-118, Inco-
Dc Erbic 18Ct960031 and by the Bureau des Ressources Génétiques and the
French Ministry in charge of Ecology (MEDD), Contract 14-A/2003. We thank
Daniel Chessel for his very helpful comments and interesting discussions about
compositional data and the multiple co-inertia analysis. We thank two referees
for a thorough review and constructive comments.
REFERENCES
[1] Aitchison J., Principal component analysis of compositional data, Biometrika 70
(1983) 57–65.
[2] Aitchison J., Logratios and natural laws in compositional data analysis, Math.
Geol. 31 (1999) 563–589.
[3] Aitchison J., Greenacre M., Biplot of compositional data, Appl. Stat. 51 (2002)
375–392.
562 D. Laloë et al.
[4] Bady P., Dolédec S., Dumont B., Fruget J F., Multiple co-inertia analysis: a tool
for assessing synchrony in the temporal variability of aquatic communities, C.
R. Biol. 327 (2004) 29–36.
[5] Baumung R., Simianer H., Hoffmann I., Genetic diversity studies in farm ani-
mals – a survey, J. Anim. Breed. Genet. 121 (2004) 361–373.
[6] Baumung R., Cubric-Curik V., Schwend K., Achmann R., Solkner J., Genetic
characterisation and breed assignment in Austrian sheep breeds using mi-
crosatellite marker information, J. Anim. Breed. Genet. 123 (2006) 265–271.
[7] Beaumont M.A., Recent developments in genetic data analysis: what can they
tell us about human demographic history? Heredity 92 (2004) 365–379.
[8] Beja-Pereira A., Alexandrino P., Bessa I., Carretero Y., Dunner S., Ferrand N.,
Jordana J., Laloë D., Moazami-Goudarzi K., Sanchez A., Canon J., Genetic
characterization of southwestern European bovine breeds: a historical and bio-
geographical reassessment with a set of 16 microsatellites, J. Hered. 94 (2003)
243–250.
[9] Beja-Pereira A., Caramelli D., Lalueza-Fox C., Vernesi C., Ferrand N.,
Casoli A., Goyache F., Royo L.J., Conti S., Lari M., Martini A., Ouragh L.,
Magid A., Atash A., Zsolnai A., Boscato P., Triantaphylidis C., Ploumi K.,
Sineo L., Mallegni F., Taberlet P., Erhardt G., Sampietro L., Bertranpetit J.,
Barbujani G., Luikart G., Bertorelle G., The origin of European cattle: evidence
from modern and ancient DNA, Proc. Natl. Acad. Sci. USA 103 (2006) 8113–
8118.
[10] Bennewitz J., Kantanen J., Tapio I., Li M.H., Kalm E., Vilkki J., Ammosov I.,
Ivanova Z., Kiselyova T., Popov R., Meuwissen T.H., Estimation of breed contri-
butions to present and future genetic diversity of 44 North Eurasian cattle breeds
using core set diversity measures, Genet. Sel. Evol. 38 (2006) 201–220.
[11] Bruford M.W., Bradley D.G., Luikart G., DNA markers reveal the complexity of
livestock domestication, Nat. Rev. Genet. 4 (2003) 900–910.
[12] Bryant D., A classification of consensus methods for phylogenies, in: Janowitz
M., Lapointe F J., McMorris F.R., Mirkin B., Roberts F.S. (Eds.), Bioconsensus,
DIMACS, AMS, 2003, pp. 163–184.
[13] Canon J., Alexandrino P., Bessa I., Carleos C., Carretero Y., Dunner S.,
Ferran N., Garcia D., Jordana J., Laloë D., Pereira A., Sanchez A., Moazami-
Goudarzi K., Genetic diversity measures of local European beef cattle breeds for
conservation purposes, Genet. Sel. Evol. 33 (2001) 311–332.
[14] Cavalli-Sforza L.L., The Human Genome Diversity Project: past, present and
future, Nat. Rev. Genet. 6 (2005) 333–340.
[15] Cavalli-Sforza L.L., Menozzi P., Piazza A., The history and geography of human
genes, Princeton University Press, 1994, 1088 p.
[16] Chenyambuga S.W., Hanotte O., Hirbo J., Watts P.C., Kemp S.J., Kifaro G.C.,
Gwakisa P.S., Peterson P.H., Rege J.E.O., Genetic characterization of indige-
nous goats of Sub-Saharan Africa using microsatellite DNA markers, Asian-
Australas. J. Anim. Sci. 17 (2004) 445–452.
[17] Chessel D., Hanafi M., Analyses de la co-inertie de K nuages de points, Rev.
Stat. Appl. 44 (1996) 35–60.
Consensus structuring and typological value 563
[18] Chessel D., Dufour A.B., Thioulouse J., The ade4 package - I: One-table meth-
ods, R-News 4 (2004) 5–10.
[19] De Crespin de Billy V., Dolédec S., Chessel D., Biplot presentation of diet com-
position data: an alternative for fish stomach contents analysis, J. Fish Biol. 56
(2000) 961–973.
[20] DeYoung R.W., Demarais S., Honeycutt R.L., Rooney A.P., Gonzales R.A.,
Gee K.L., Genetic consequences of white-tailed deer (Odocoileus virginianus)
restoration in Mississippi, Mol. Ecol. 12 (2003) 3237–3252.
[21] Excoffier L., Heckel G., Computer programs for population genetics data analy-
sis: a survival guide, Nat. Rev. Genet. 7 (2006) 745–758.
[22] Fabuel E., Barragan C., Silio L., Rodriguez M.C., Toro M.A., Analysis of ge-
netic diversity and conservation priorities in Iberian pigs based on microsatellite
markers, Heredity 93 (2004) 104–113.
[23] Fang M., Hu X., Jiang T., Braunschweig M., Hu L., Du Z., Feng J., Zhang Q.,
Wu C., Li N., The phylogeny of Chinese indigenous pig breeds inferred from
microsatellite markers, Anim. Genet. 36 (2005) 7–13.
[24] FAO, Secondary Guidelines for Development of National Farm Animal Genetics
Resources Management Plans. Measurement of Domestic Animal Diversity
(MoDAD), Original Working Group Report, FAO, Rome, 1998.
[25] Felsenstein J., How can we infer geography and history from gene frequencies?
J. Theor. Biol. 96 (1982) 9–20.
[26] Freeman A.R., Meghen C.M., Machugh D.E., Loftus R.T., Achukwi M.D.,
Bado A., Sauveroche B., Bradley D.G., Admixture and diversity in West African
cattle populations, Mol. Ecol. 13 (2004) 3477–3487.
[27] Gabriel K.R., The biplot graphic display of matrices with application to principal
component analysis, Biometrika 58 (1971) 453–467.
[28] Hanotte O., Bradley D.G., Ochieng J.W., Verjee Y., Hill E.W., Rege J.E., African
pastoralism: genetic imprints of origins and migrations, Science 296 (2002) 336–
339.
[29] Healy M.J.R., Drawing a probability ellipse, J. R. Stat. Soc. Ser. C-Appl. Stat.
21 (1972) 202–204.
[30] Hedde M., Lavelle P., Joffre R., Jiménez J.J., Decaëns T., Specific functional
signature in soil macro-invertebrate biostructures, Funct. Ecol. 19 (2005) 785–
793.
[31] Hillel J., Groenen M.A., Tixier-Boichard M., Korol A.B., David L., Kirzhner
V.M., Burke T., Barre-Dirie A., Crooijmans R.P., Elo K., Feldman M.W.,
Freidlin P.J., Maki-Tanila A., Oortwijn M., Thomson P., Vignal A., Wimmers K.,
Weigend S., Biodiversity of 52 chicken populations assessed by microsatellite
typing of DNA pools, Genet. Sel. Evol. 35 (2003) 533–557.
[32] Holmes S., Multivariate Data Analysis: The French Way, to appear
in Festchrift for David Freeman, IMS lecture notes (2006) http://www-
stat.stanford.edu/∼susan/papers/dfc.pdf [consulted: 20 March 2007].
[33] Hotelling H., Analysis of a complex of statistical variables into principal com-
ponents, J. Educ. Psychol. 24 (1933) 417–441.
[34] Hotelling H., Analysis of a complex of statistical variables into principal compo-
nents (continued from September issue), J. Educ. Psychol. 24 (1933) 498–520.
564 D. Laloë et al.
[35] Iamartino D., Bruzzone A., Lanza A., Blasi M., Pilla F., Genetic diversity of
Southern Italian goat populations assessed by microsatellite markers, Small
Ruminant Res. 57 (2005) 249–255.
[36] Ibeagha-Awemu E.M., Jann O.C., Weimann C., Erhardt G., Genetic diversity,
introgression and relationships among West/Central African cattle breeds, Genet.
Sel. Evol. 36 (2004) 673–690.
[37] Jann O.C., Ibeagha-Awemu E.M., Ozbeyaz C., Zaragoza P., Williams J.L.,
Ajmone-Marsan P., Lenstra J.A., Moazami-Goudarzi K., Erhardt G., Geographic
distribution of haplotype diversity at the bovine casein locus, Genet. Sel. Evol.
36 (2004) 243–257.
[38] Joliffe I.T., Discarding variables in a principal component analysis. I: Artificial
data., Appl. Stat. 22 (1972) 373–374.
[39] Knowles L.L., The burgeoning field of statistical phylogeography, J. Evol. Biol.
17 (2004) 1–10.
[40] Krzanowski W.J., A stopping rule for structure-preserving variable selection,
Stat. Comput. 6 (1996) 51–56.
[41] Kumar S., Gupta J., Kumar N., Dikshit K., Navani N., Jain P., Nagarajan M.,
Genetic variation and relationships among eight Indian riverine buffalo breeds,
Mol. Ecol. 15 (2006) 593–600.
[42] Li M.H., Zhao S.H., Bian C., Wang H.S., Wei H., Liu B., Yu M., Fan B.,
Chen S.L., Zhu M.J., Li S.J., Xiong T.A., Li K., Genetic relationships among
twelve Chinese indigenous goat populations based on microsatellite analysis,
Genet. Sel. Evol. 34 (2002) 729–744.
[43] Liron J.P., Peral-Garcia P., Giovambattista G., Genetic characterization of
Argentine and Bolivian Creole cattle breeds assessed through microsatellites,
J. Hered. 97 (2006) 331–339.
[44] Luikart G., England P.R., Tallmon D., Jordan S., Taberlet P., The power and
promise of population genomics: from genotyping to genome typing, Nat. Rev.
Genet. 4 (2003) 981–994.
[45] MacHugh D.E., Loftus R.T., Cunningham P., Bradley D.G., Genetic structure of
seven European cattle breeds assessed using 20 microsatellite markers, Anim.
Genet. 29 (1998) 333–340.
[46] Marletta D., Tupac-Yupanqui I., Bordonaro S., Garcia D., Guastella A.M.,
Criscione A., Canon J., Dunner S., Analysis of genetic diversity and the de-
termination of relationships among western Mediterranean horse breeds using
microsatellite markers, J. Anim. Breed. Genet. 123 (2006) 315–325.
[47] Martin-Burriel I., Garcia-Muro E., Zaragoza P., Genetic diversity analysis of six
Spanish native cattle breeds using microsatellites, Anim. Genet. 30 (1999) 177–
182.
[48] Menozzi P., Piazza A., Cavalli-Sforza L.L., Synthetic maps of human gene fre-
quencies in europeans, Science 201 (1978) 786–792.
[49] Moazami-Goudarzi K., Laloë D., Is a multivariate consensus representation
of genetic relationships among populations always meaningful? Genetics 162
(2002) 473–484.
Consensus structuring and typological value 565
[50] Moazami-Goudarzi K., Laloë D., Furet J.P., Grosclaude F., Analysis of genetic
relationships between 10 cattle breeds with 17 microsatellites, Anim. Genet. 28
(1997) 338–345.
[51] Moazami-Goudarzi K., Belemsaga D., Ceriotti G., Laloë D., Fagbohoun F.,
Kouagou N., Sidibé I., Codjia V., Crimella M., Grosclaude F., Touré S.,
Caractérisation de la race bovine Somba à l’aide de marqueurs moléculaires,
Rev. Elev. Med. Vet. Pays Trop. 54 (2001) 1–10.
[52] Phillips C., Warnow T.J., The asymetric median tree - a new model for building
consensus trees, Discrete Appl. Math. 71 (1996) 311–335.
[53] Pompanon F., Bonin A., Bellemain E., Taberlet P., Genotyping errors: causes,
consequences and solutions, Nat. Rev. Genet. 6 (2005) 847–859.
[54] R Development Core Team, R: a Language and Environment for Statistical
Computing, R Foundation for Statistical Computing, Vienna, Austria (2006),
ISBN 3-900051-07-0, .
[55] Reyment R., The statistical analysis of multivariate serological frequency data,
Bull. Math. Biol. 67 (2005) 1303–1313.
[56] Rosenberg N.A., Pritchard J.K., Weber J.L., Cann H.M., Kidd K.K., Zhivotovsky
L.A., Feldman M.W., Genetic structure of human populations, Science 298
(2002) 2381–2385.
[57] Royo L.J., Alvarez I., Beja-Pereira A., Molina A., Fernandez I., Jordana J.,
Gomez E., Gutierrez J.P., Goyache F., The origins of Iberian horses assessed
via mitochondrial DNA, J. Hered. 96 (2005) 663–669.
[58] Schlötterer C., The evolution of molecular markers-just a matter of fashion? Nat.
Rev. Genet. 5 (2004) 63–69.
[59] Simianer H., Using expected allele number as objective function to design be-
tween and within breed conservation of farm animal biodiversity, J. Anim.
Breed. Genet. 122 (2005) 177–187.
[60] Simianer H., Meyer J.N., Past and future activities to harmonize farm animal
biodiversity studies on global scale, Arch. Zootec. 52 (2003) 193–199.
[61] Takezaki N., Nei M., Genetic distances and reconstruction of phylogenetic trees
from microsatellite DNA, Genetics 144 (1996) 389–399.
[62] Talle S.B., Chenyabuga W.S., Fimland E., Syrstad O., Meuwissen T., Klungland
H., Use of DNA technologies for the conservation of animal genetic resources:
A review, Acta Agric. Scand. Sect. A Anim. Sci. 55 (2005) 1–8.
[63] Tapio M., Miceikiene I., Vilkki J., Kantanen J., Comparison of microsatellite
and blood protein diversity in sheep: inconsistencies in fragmented breeds, Mol.
Ecol. 12 (2003) 2045–2056.
[64] Toro M.A., Caballero A., Characterization and conservation of genetic diversity
in subdivided populations, Philos. Trans. R. Soc. Lond. B Biol. Sci. 360 (2005)
1367–1378.
[65] Uzun M., Gutierrez-Gil B., Arranz J.J., San Primitivo F., Saatci M., Kaya M.,
Bayon Y., Genetic relationships among Turkish sheep, Genet. Sel. Evol. 38
(2006) 513–524.
[66] Wang A., Gehan E.A., Gene selection for microarray data analysis using princi-
pal component analysis., Stat. Med. 24 (2005) 2069–2087.
566 D. Laloë et al.
[67] Wiener P., Burton D., Williams J.L., Breed relationships and definition in British
cattle: a genetic analysis, Heredity 93 (2004) 597–602.
[68] Woronow A., Regression and discrimination analysis using raw compositional
data – Is it really a problem? in: Proceedings of the 3rd Annual Conference of the
International Association for Mathematical Geology, Universitate Politecnica de
Catalunya, Barcelona, 1997, pp. 157–162.
[69] Xuebin Q., Jianlin H., Lkhagva B., Chekarova I., Badamdorj D., Rege J.E.,
Hanotte O., Genetic diversity and differentiation of Mongolian and Russian yak
populations, J. Anim. Breed. Genet. 122 (2005) 117–126.
[70] Yue-Hui M., Shao-Qi R., Shen-Jin L., Guan-Yu H., Wei-Jun G., Hong-Bin L.,
Xia L., Qian-Jun Z., Jun G., Phylogeography and origin of sheep breeds in
Northern China, Conserv. Genet. 7 (2006) 117–127.
[71] Zhang D.X., Hewitt G.M., Nuclear DNA analyses in genetic studies of popula-
tions: practice, problems and prospects, Mol. Ecol. 12 (2003) 563–584.
APPENDIX: MCOA PRINCIPLES
Notations: We consider K tables X
k
having the same rows, but different
columns. Each table defines a cloud of n points in a p
k
-dimensional space
of real numbers, R
p
k
. Distances between two points in R
p
k
are computed using
Q
k
metric (p
k
× p
k
).
Let D be a n × n diagonal matrix containing the weights of the n points and
used to compute the distances between the variables in the R
n
space.
Let w
k
be the weight of each table. Here we used the uniform weighting
w
k
=
1
K
for k = 1, K.
The tables X
k
are centered by columns. We note X
T
k
the transposed matrix
of X
k
.
First step: The aim of the MCOA is to find a set of Q
k
-normed vectors in each
space R
p
k
, called the co-inertia axes (u
1
1
u
1
k
u
1
K
), and a reference vector v
1
D-normed in R
n
maximizing:
K
k=1
w
k
(X
k
Q
k
u
1
k
|v
1
)
2
D
,
where (X
k
Q
k
u
1
k
|v
1
)
D
is the scalar product of X
k
Q
k
u
1
k
and v
1
computed with the
D metric. The vectors are centered and then, this scalar product is a covariance.
Note that row scores onto co-inertia axes are the scores of the coordinated
analyses: X
k
Q
k
u
1
k
= l
1
k
.
Let us consider the matrix Y
1
composed of the juxtaposed weighted tables:
Y
1
=
√
w
1
X
1
√
w
k
X
k
√
w
K
X
K
.
Consensus structuring and typological value 567
Chessel and Hanafi [17] showed that
K
k=1
w
k
(X
k
Q
k
u
1
k
|v
1
)
2
D
is maximum for λ
1
,
the first eigenvalue of the PCA of Y
1
.
So,
– the reference score v
1
is the first principal component of this PCA and,
– the vectors u
1
k
are obtained by: u
1
k
=
X
T
k
Dv
1
X
T
k
Dv
1
Q
k
.
Following steps: We note r the number of chosen structures in the reference,
i.e. the total number of steps (i = 1, r). The aim of the MCOA is to find an-
other set of Q
k
-normed co-inertia axes (u
i
1
u
i
k
u
i
K
), and a reference vector v
i
D-normed in R
n
maximizing:
K
k=1
w
k
(X
k
Q
k
u
i
k
|v
i
)
2
D
under the additional constraints that u
i
k
is orthogonal to u
i−1
k
and v
i
is orthogo-
nal to v
i−1
.
Let us consider the orthonormal co-inertia basis U
k
=
u
1
k
, , u
i−1
k
for each
table X
k
.
Let P
k
be the projector onto U
k
.
Let us then consider the matrix Y
i
composed of the juxtaposed weighted
tables:
Y
i
=
√
w
1
X
1
−
√
w
1
X
1
P
T
1
√
w
k
X
k
−
√
w
k
X
k
P
T
k
√
w
K
X
K
−
√
w
K
X
K
P
T
K
.
Chessel and Hanafi [17] showed that
K
k=1
w
k
(X
k
Q
k
u
i
k
|v
i
)
2
D
is maximum for λ
i
,
the first eigenvalue of the PCA of Y
i
.
So,
– the reference score v
i
is the first principal component of this PCA and,
– the vectors u
i
k
are obtained by the following: u
i
k
=
X
T
k
Dv
i
X
T
k
Dv
i
Q
k
.
Finally, MCOA yields r orthonormal row scores V =
v
1
, , v
r
(the
reference scores), r orthonormal co-inertia axes U
k
=
u
1
k
, , u
r
k
in each
p
k
-dimensional space and the corresponding row scores L
k
=
l
1
k
, , l
r
k
(the
scores of the coordinated analyses).