Báo cáo sinh học: " Analysis of the real EADGENE data set: Multivariate approaches and post analysis (Open Access publication)" doc
Bạn đang xem bản rút gọn của tài liệu. Xem và tải ngay bản đầy đủ của tài liệu tại đây (559.73 KB, 18 trang )
Genet. Sel. Evol. 39 (2007) 651–668 Available online at:
c
INRA, EDP Sciences, 2007 www.gse-journal.org
DOI: 10.1051/gse:2007030
Original article
Analysis of the real EADGENE data set:
Multivariate approaches and post analysis
(Open Access publication)
Peter Sørensen
a∗
, Agnès Bonnet
b
,BartBuitenhuis
a
, Rodrigue
C
losset
c
, Sébastien D
´
ejean
d
, Céline Delmas
e
,MylèneDuval
e
,
Liz G
lass
f
,JakobHedegaard
a
,HenrikHornshøj
a
,Ina
H
ulsegge
g
,FlorenceJaffr
´
ezic
h
,KirstyJensen
f
,LiJiang
a
,
Dirk-Jan
de Koning
f
,Kim-AnhL
ˆ
e
Cao
d,e
, Haisheng Nie
i
,
Wolfram P
etzl
j
, Marco H. Pool
g
, Christèle Robert-Grani
´
e
e
,
Magali S
an Cristobal
b
, Mogens Sandø Lund
a
,EvertM.
va n Schothorst
k
, Hans-Joachim Schuberth
l
, Hans-Martin
S
eyfert
m
, Gwenola Tosser-Klopp
b
,DavidWaddington
f
,
Michael W
at son
n
,WeiYang
m
,HolmZerbe
j
a
University of Aarhus, Faculty of Agricultural Sciences, Dept. of Genetics and
Biotechnology, P.O. Box 50 DK-8830 Tjele, Denmark;
b
INRA, UMR 444 Laboratoire de
génétique cellulaire, BP 52627, 31326 Castanet-Tolosan, France;
c
Faculty of Veterinary
Medicine, University of Liege, Liege, Belgium;
d
Université Paul Sabatier, UMR 5219
Laboratoire de statistique et probabilités, 31062 Toulouse, France;
e
INRA, UR631 Station
d’amélioration génétique des animaux, BP 52627, 31326 Castanet-Tolosan, France;
f
Roslin
Institute, Department of Genetics and Genomics, Roslin Biocentre, Roslin, Midlothian,
EH25 9PS, UK (RLN);
g
Animal Sciences Group Wageningen UR, Lelystad,
The Netherlands;
h
INRA, UR337 Station de génétique quantitative et appliquée,
Jouy-en-Josas, 78350, France;
i
Animal Breeding and Genomics Centre, Wageningen
University and Research Centre, The Netherlands;
j
Clinic for Ruminants,
Ludwig-Maximilians-University, Munich, Germany;
k
Food Bioactives Group,
RIKILT-Institute of Food Safety, Wageningen University and Research Centre, Wageningen,
The Netherlands;
l
Immunology Unit, University of Veterinary Medicine, Hannover,
Germany;
m
Research Institute for the Biology of Farm Animals, Dummerstorf, Germany;
n
Informatics Group, Institute for Animal Health, Compton, Newbury,
Berks RG20 7NN, UK
(Received 10 May 2007; accepted 4 July 2007)
Abstract – The aim of this paper was to describe, and when possible compare, the multivariate
methods used by the participants in the EADGENE WP1.4 workshop. The first approach was
∗
Corresponding author:
Article published by EDP Sciences and available at
or />652 P. Sø re ns en et al.
for class discovery and class prediction using evidence from the data at hand. Several teams
used hierarchical clustering (HC) or principal component analysis (PCA) to identify groups of
differentially expressed genes with a similar expression pattern over time points and infective
agent (E. coli or S. aureus). The main result from these analyses was that HC and PCA were able
to separate tissue samples taken at 24 h following E. coli infection from the other samples. The
second approach identified groups of differentially co-expressed genes, by identifying clusters
of genes highly correlated when animals were infected with E. coli but not correlated more than
expected by chance when the infective pathogen was S. aureus. The third approach looked at
differential expression of predefined gene sets. Gene sets were defined based on information
retrieved from biological databases such as Gene Ontology. Based on these annotation sources
the teams used either the GlobalTest or the Fisher exact test to identify differentially expressed
gene sets. The main result from these analyses was that gene sets involved in immune defence
responses were differentially expressed.
bovine annotation / bo vine microarray / gene set analysis / mastitis / multivariate ap-
proaches
1. INTRODUCTION
In the host response to pathogens rather than individual gene actions the bi-
ological importance may be exhibited through the combined actions of a group
of genes. Since the microarray technology allows us to monitor simultaneously
the expression of thousands of genes, employing multivariate statistical meth-
ods to analyse these data may enable us to identify gene groups involved in the
host response to pathogens.
There are two conceptually different ways of defining gene groups. First,
gene groups can be identified from the experimental data at hand using sta-
tistical methods developed for clustering genes that show similar expression
patterns [8]. For example, cluster analysis can be used to discover classes of
genes responding differently to specific pathogens. Another important applica-
tion of microarray data is to build classifiers that could predict if and when an
animal will respond to a specific pathogen.
Second, gene groups can be defined based on prior biological knowledge on
gene functions available from public available databases (e.g. Gene Ontology
(GO), Kyoto Encyclopedia of Genes and Genomes (KEGG)) [1]. Once the
gene groups have been identified several statistical methods exist to evaluate
the association of the gene group with the biological outcome [12, 13].
The aim of this paper was to describe and when possible compare the mul-
tivariate statistical methods used by the participants in the EADGENE WP1.4
workshop.
Multivariate gene expression analyses 653
2. MATERIALS AND METHODS
An EADGENE funded microarray study experiment was performed to gain
a better insight into the genes involved in mastitis in dairy cows [15]. The
EADGENE partners were provided data from a microarray analysis of mam-
mary tissue sampled at different time points relative to intra-mammary ex-
posure to the pathogen. For a detailed description of the experiment, the
expression data as well as methods used by individual teams for data nor-
malisation and identification of differentially expressed genes, we refer to
Jaffrézic et al. [14]. Three conceptually different multivariate statistical ap-
proaches were used by the EADGENE teams: class discovery and class pre-
diction, differential co-expression of gene sets, and differential expression of
gene sets. These statistical approaches will each be presented in more detail.
An overview of the different statistical methods and software used can be found
in Table I.
2.1. Class discovery and class prediction
The first statistical approach was for class discovery and class prediction us-
ing evidence from the data at hand. Several teams used hierarchical clustering
(HC) or principal component analysis (PCA) to identify groups of differen-
tially expressed genes with similar expression pattern. Hierarchical clustering
was based on Euclidian distance similarity measure and average agglomera-
tion method. HC and PCA were based on expression data from genes that were
found to be differentially expressed between different time points or pathogens.
The INRA_T team used a slightly different approach in which differentially
expressed genes where clustered according to their smoothed expression pro-
file over time. Before the usual clustering step, a smooth expression curve was
fitted for each gene [5,17]. The derivative of this curve was computed and will
be refered to as a “profile”. Each profile was discretized over 13 equidistant
time points from 0 to 24 h. For this new data set, the dendrogram produced by
HC was used as a guide to choose the final number of clusters (k). Finally, to
gain in robustness, a K-means algorithm was performed with k initial centroids
from the HC [5].
The INRA_T team also used Classification and Regression Trees (CART)
to identify subsets of genes (among all the genes on the array) that best pre-
dicted different time points and infective pathogens. CART is a tree-building
method that partitions a set of samples into groups [4]. However, slight changes
in the expression data can lead to a very different construction of the tree
654 P. Sø re ns en et al.
Tab le I. Overview of the different multivariate statistical methods and software used
by the different teams in the analyses of the EADGENE microarray data.
Method(s) Data Software Team(s)
Class discovery and class prediction
HC DE genes hclust
a
AARHUS, WUR, INRA_T
PCA DE genes prcomp
a
AARHUS, WUR, INRA_T
SP −> HC/K-Means DE genes R code from author INRA_T
CART + RF −> HC all genes Rpart
a
, RandomForest
a
INRA_T
CART + SA −> HC all genes R code from author INRA_T
Differential co-expression of gene sets
CoXpress all genes CoXpress
a
IAH_C
Differential expression of gene sets
GlobalTest all genes GlobalTest
a
AARHUS, IDL
Fisher exact test DE genes GOstats
a
AARHUS
EASE WUR
Ingenuity INRA_T
a
R/BioC software package.
DE genes/all genes: Either a list of differentially expressed genes (DE genes) or all genes on the array
(passing some kind of quality filter) were used as input data to the statistical analyses.
HC: hierarchial clustering.
PCA: principal component analysis.
SP: smoothed profile.
K-Means: K-means clustering.
CART: classification and regression trees.
RF: random forest.
SA: stochastic algorithm.
CoXpress: test for changes in correlation structure within gene cluster.
EASE: expression analysis systematic explorer on-line application ( />Ingenuity: ingenuity software (www.ingenuity.com).
and therefore two wrapper methods [16] that aggregate the trees were used in
combination with CART. The first wrapper method was Random Forest (RF),
which creates an ensemble of trees (the forest) using different bootstrap sam-
ples [3]. In addition, at each partition of the tree, the best predictor is chosen
among a fixed number of randomly selected genes using the “Mean decrease
accuracy” as a measure of the predictive ability [16]. The second wrapper
method was based on a stochastic algorithm [10]. The idea of this method is to
quantify numerically the classification efficiency of each gene with a probabil-
ity weight (the heavier the weight the better) and learn iteratively this probabil-
ity using stochastic approximations and a classification task. In this case, the
classification method used to measure the classification efficiency of each gene
was CART that is well adapted to multi-class problems. This will enable us to
select a subset of discriminative genes (with the heaviest probability weight)
that hence holds useful information on the microarray experiment.
Multivariate gene expression analyses 655
2.2. Differential co-expression of gene sets
The second statistical approach identified groups of differentially co-
expressed genes between the E. coli and S. aureus infected quarters. Based
only on E. coli, data genes were hierarchically clustered, using 1-r (where r
is the Pearson correlation coefficient) as a distance measure and the “average”
agglomeration method [19]. Gene groups were identified by cutting the cluster
tree at a height of 0.005. Then for each gene group the mean of the pairwise
correlations among all genes was estimated in the S. aureus data and if the
group of genes is more correlated than is expected by chance, they are said to
be differentially co-expressed.
2.3. Differential expression of gene sets
The third statistical approach tests for differential expression of apriori de-
fined gene sets using either the GlobalTest [13] or the Fisher exact test [6].
The GlobalTest uses all the genes in the data set and is based on an empiri-
cal Bayesian generalised linear model with the regression coefficients between
expression data and the sample treatments (e.g. time point or pathogen) as ran-
dom variables. The method investigates whether samples with similar treat-
ments tend to have similar gene expression patterns. It assumes that the re-
gression coefficients for individual genes belonging to a specific gene set are
a sample from some common distribution with expectation of zero and tests
(using a score test) if the variance associated with the gene set is different
from zero [12]. Since time points and pathogens are categorical variables the
GlobalTest was applied using the logistic model. P-values for tests were calcu-
lated using the asymptotic distribution. The GlobalTest is implemented in the
Bioconductor package [11] GlobalTest [13]. An alternative method to iden-
tify differentially expressed gene sets is to use the Fisher exact test to identify
over-represented gene sets in a list of differentially expressed genes. In this
method it is determined how many of the genes from a specific gene set are
in the list of differentially expressed genes and how many are on the whole
array. With these counts a Hypergeometric test is performed. This is equiva-
lent to using the Fisher exact test. The teams used this method as implemented
in the Bioconductor package GOstats [9], the Expression Analysis Systematic
Explorer (EASE) on-line application ( />genuity software (www.ingenuity.com).
2.4. Annotation of bovine genes
Several approaches for obtaining information about bovine gene functions
were explored by the EADGENE teams. The original annotation file for the
656 P. Sø re ns en et al.
bovine 20K array included 5371 Ensembl Genes, 3847 EntrezGenes and
8127 UniGenes. From these gene identifiers it is possible to retrieve addi-
tional information on bovine gene functions using the Functional Annota-
tion Tool on DAVID Bioinformatics website (david.abcc.ncifcrf.gov). Another
approach to obtain bovine annotation is to use the Bioconductor package
AnnBuilder [20]. Using the AnnBuilder software and provided mappings be-
tween microarray cDNA probe ID and Bovine GenBank Locus ID it is pos-
sible to build a customised annotation package gathering bovine annotation
from several public databases. An alternative approach to annotate bovine
genes was based on homology to human orthologs. This was done using
data from the Ensembl (www.ensembl.org) and BioMart (www.biomart.org)
databases and the Bioconductor package biomaRt [7] as the query interface.
For each unique feature on the bovine array, the query ID (Ensembl ID,
Entrezgene ID or Unigene ID) was extracted from the original annota-
tion file. For each bovine query ID the human homolog was retrieved and
used to obtain annotation from the Homo sapiens dataset in Ensembl. De-
tails about the method for gene orthology prediction can be found here
www.ensembl.org/info/data/compara/homology_method.html.
3. RESULTS
3.1. Class discovery and class prediction
The main results from the HC and the PCA of the differentially expressed
genes were that E. coli samples clustered into two groups where time 24 h
was different from the other time points (Fig. 1). HC analysis clustered genes
into two groups, one down regulated at 0–12 h and one up regulated at 24 h.
A similar pattern was observed with the K-means clustering of the smoothed
expression profiles where five (three) clusters corresponded to increasing (de-
creasing) expressions, with various magnitudes (Fig. 2). Principal component
analysis of all samples showed that S. aureus samples are different from E. coli.
Using the classifier algorithms (CART in combination with the aggregation
methods) to identify subsets of genes that best predicted different time points
enabled the HC analysis to better separate samples taken at different time
points compared to an HC analysis performed with a selection of genes with
an F-test. The RF algorithm selected 38 genes and the stochastic algorithm
selected 70 genes as best predictors of the time points. Although these two ag-
gregation methods use the same classification method (CART) only 18 genes
are overlapping. The predictive genes were generally differentially expressed,
Multivariate gene expression analyses 657
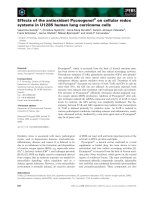
Figure 1. Heatmap showing hierarchical clustering of 147 differentially expressed
genes (horizontally) and microarrays (vertically) corresponding to timepoints 0 (n =
4), 6 (n = 4), 12 (n = 3), and 24 (n = 4) h relative to E. coli infection. Differentially ex-
pressed genes were identified using Fisher test and FDR < 1%. The light grey (black)
colour represents overexpressed (underexpressed) genes.
but not necessarily ranked high based on the F statistic. As opposed to the
results obtained from the HC analysis of the differentially expressed genes (F-
test selection), where the selected genes mostly discriminated time 24 against
the others, here separation of time points 0, 6 and 24 were better with this
unsupervised classification (Fig. 3).
658 P. Sø re ns en et al.
05 15
-1.0 -0.5 0.0 0.5 1.0
Group 1
05 15
-1.0 -0.5 0.0 0.5 1.0
Group 2
05 15
-1.0 -0.5 0.0 0.5 1.0
Group 3
05 15
-1.0 -0.5 0.0 0.5 1.0
Group 4
05 15
-1.0 -0.5 0.0 0.5 1.0
Group 5
05 15
-1.0 -0.5 0.0 0.5 1.0
Group 6
05 15
-1.0 -0.5 0.0 0.5 1.0
Group 7
05 15
-1.0 -0.5 0.0 0.5 1.0
Group 8
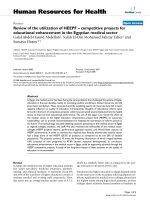
Figure 2. K-means aggregationof smooth profiles of the 147 E. coli clones (Fisher test and FDR < 1%) on 15 microarrays corresponding
to times 0–24 h. Different colours correspond to clusters obtained with a hierarchical clustering (not shown). Eight clusters were chosen
here.
Multivariate gene expression analyses 659
Figure 3. Heatmap showing hierarchical clustering of 38 best predictor genes (hori-
zontally) and microarrays (vertically) corresponding to timepoints 0 (n = 4), 6 (n = 4),
12 (n = 3), and 24 (n = 4) h relative to E. coli infection. The 38 genes were selected
using the aggregation method random forest. The light grey (black) colour represents
overexpressed (underexpressed) genes.
3.2. Differential co-expression of gene sets
The method used to identify groups of differentially co-expressed genes,
identified several clusters of genes highly correlated when animals were in-
fected with E. coli but not correlated more than expected by chance when the
infective pathogen was S. aureus (Fig. 4).
3.3. Annotation of bovine genes
In total, 2254 out of 8126 Unigene ID in the original bovine annotation
file could be recognised, but only 1142 UniGene ID were annotated in the
660 P. Sø re ns en et al.
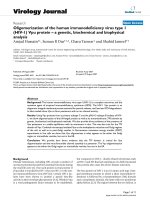
Figure 4. Graphs of the expression profiles of three groups of transcripts found to be
differentially co-expressed in the real data set. The groups are numbers 41 (top), 138
(middle) and 23 (bottom). Data has been scaled and centred. Data from the E. coli data
set is shown on the left, and from the S. aureus data set on the right.
Multivariate gene expression analyses 661
DAVID database. A similar number of bovine genes were annotated using the
AnnBuilder package where 1331 out of 2173 EntrezGene ID genes were asso-
ciated with GO terms. Annotating bovine genes based on homology to human
orthologs resulted in 3831 out of 5840 query probe ID that were associated
with human GO terms.
3.4. Differential expression of gene sets
Based on these annotation sources the teams used either the Globaltest or the
Fisher exact test to identify differentially expressed gene sets. Both methods
identified several gene sets defined by the Biological Process (GO-BP) terms
that were differentially expressed in response to infection. These gene sets in-
clude biological processes such as ‘defense response’, ‘immune response’, ‘in-
flammatory response’, ‘regulation of apoptosis’, ‘cell-cell adhesion’, ‘response
to biotic stimulus’, ‘response to wounding’ and ‘response to pest, pathogen
or parasite’. The functional analysis using the DAVID software also showed
that the genes up-regulated at E. coli 24 h infection were enriched for GO
terms related to immune activities. These results were also supported by the
functional analysis using the Ingenuity software that was based on 63 differ-
entially expressed genes and identified four highly significant biological net-
works (Fig. 5) which are all related to infection including the Toll-like receptor
signalling pathway genes (CD14, NFKBIA and TIRAP) which are essential in
the innate immunity response to gram-negative infection.
The results also showed that annotation based solely on bovine genes and
annotation based on bovine homology to human orthologs was quite differ-
ent (Fig. 6). In total, 49 significantly enriched GO terms were identified with
the two methods. Of these, only three specific GO terms were found across
both methods, which is mainly due to the limited number of identical genes
mapping to the exact same GO term (Fig. 6). Hence, if the same genes do not
map to the same GO terms in the two methods, it is of course not possible for
them to come up as enriched in the two methods. The relative low number of
identical genes mapping to the exact same GO terms in the two methods can
be explained by the level of specificity by which genes map to biological pro-
cesses (Fig. 7). An example is the term ‘inflammatory response’ in the pure
bovine annotation approach, which is represented by eight more specific terms
in the bovine-human annotation approach.
4. DISCUSSION
Three conceptually different multivariate statistical approaches were used
by the EADGENE teams in the analysis of the microarray data. Because
662 P. Sø re ns en et al.
Figure 5. Significant canonical pathway. The most significant canonical pathways, as
determined by Ingenuity software, across the entire dataset of 596 genes with a < 0.05
FDR are displayed along the x-axis. The y-axis displays the significance level which
is a P-value, calculated using the right-tailed Fisher Exact Test. In this method, the
P-value is calculated by comparing the number of user-specified genes of interest (i.e.
Functional Analysis Genes) that participate in a given function or pathway, relative to
the total number of occurrences of these genes in all functional/pathway annotations
stored in the Ingenuity Pathways Knowledge Base.
different normalisation procedures and methods for identifying differentially
expressed genes were used by the EADGENE teams, a detailed comparison of
the different statistical approaches is not possible.
The aim of the first statistical approach was class discovery and class predic-
tion. Hierarchical clustering and principal component analysis of differentially
expressed genes demonstrated a different expression profile in tissue samples
taken at 24 h following E. coli infection as compared to the other time points.
This is mainly due to the fact that a majority of the differentially expressed
genes are identified at 24 h. It was also shown that by using classifier algo-
rithms such as CART to identify subsets of genes that best predicted different
time points and pathogens enables the HC analysis to better classify the sam-
ples taken at different time points. In some cases, highly differentially ex-
pressed genes (high rank in the F-test) will be strongly correlated and may
not necessarily be useful for prediction. Other genes not correlated with the
Multivariate gene expression analyses 663
Figure 6. Gene Ontology (GO) term enrichment test for 1112 probes representing up-
regulated genes during 24 h of E. coli infection and class Biological Process (BP).
(A) AnnBuilder annotation set and GOHyperG GO enrichment test. (B) BiomaRt
annotation set and Fisher exact test. (C) The number of reporter ID (genes) for up-
regulated genes that were mapped to the same GO BP term in the two annotation
approaches.
664 P. Sø re ns en et al.
Figure 7. AnnBuilder-BioMart [bta-hsa] comparison of mappings between probe ID
and enriched GO BP terms. A list of unique probe ID with mappings to enriched GO
BP terms in the AnnBuilder approach was constructed. For each of the unique probe
ID the corresponding mappings to enriched GO BP terms in the biomart annotation
approach was identified. The mappings in the two annotation approaches were then
plotted against each other.
top ranking genes but still differentially expressed will be better in terms of
prediction and may contain more informative genes that explain the biolog-
ical experiment. Although HC and PCA are able to display the predominant
structures in the data they may fail to capture alternative structures and local
behaviour.
In the second statistical approach, the goal is to identify differential co-
expression of gene sets. In this approach, HC was used to identify several clus-
ters of co-expressed genes highly correlated when animals were infected with
E. coli but not correlated more than expected by chance when the infective
Multivariate gene expression analyses 665
pathogen was S. aureus. This approach looks for changes in the relationship
among genes themselves and may provide insight into changes in co-regulation
of genes. It does, however, rely on HC which has the disadvantages that it im-
poses a tree structure to the data, is highly sensitive to the distance metric used,
and typically requires subjective decisions on the number of clusters. There-
fore it may be useful to identify differentially co-expressed genes using gene
sets based on known gene functions and pathways (e.g. GO, KEGG).
The third statistical approach tests for differential expression of apriori de-
fined gene sets using either the GlobalTest [13] or the Fisher exact test [6].
Gene sets were defined mostly based on GO and used together with these two
methods which primarily relies on associations between the genes and the phe-
notype of interest. Although the purpose of these methods is the same they are
quite different in terms of methodology and in the genes included in the anal-
ysis. Despite the different teams used different methods for determination of
differentially expressed genes and different annotation sources both methods
showed that gene sets involved immune defence responses. Methods for iden-
tification of differential expression of individual genes are in general optimised
for detecting genes with large changes in gene expression whereas methods
for detecting differentially expressed gene sets are more powerful at detecting
smaller changes in gene expression patterns of a whole group of genes. There-
fore gene set analyses are complementary to analyses at the level of individual
genes and represent powerful tools for the dissection of complex changes in
gene expression [13].
Methods for detecting differentially expressed gene sets rely on the avail-
ability of annotated bovine genes. Because there are a limited number of an-
notated bovine genes available, an alternative annotation approach is to use
the human ortholog genes that take advantage of the well-annotated human
genome. Although the two annotation approaches affected the differentially
expressed gene set results with respect to identified GO terms and the level of
GO term specificity, there was not any major advantage in using one or the
other approach. In fact they might be complementary, suggesting that more
alternative methods should generally be applied in such post-analysis studies.
Furthermore, when using gene expression arrays for genomes of livestock an-
imals that are not fully annotated in terms of gene functions, as is the case
for the bovine genome, it is possible to identify additional gene annotations
like more GO terms when using several alternative annotation approaches as
we have done in the present study. Using several annotation methods may not
be worthwhile with more completely annotated genomes like the human and
mouse genomes.
666 P. Sø re ns en et al.
It is, however, still a challenge to interpret the biological relevance of the
differentially expressed genes and gene sets. Briefly, differentially expressed
genes included CD14 whose expression level was up regulated in our study
which was consistent with the increase of CD14 protein levels observed in
infected cow milk [2]. CD14 is part of the Toll-like Receptor signalling path-
way and two other genes in this pathway, NFKBIA and TIRAP, were also up
regulated and are known to be involved in the innate immunity response to
gram-negative infection [18].
5. CONCLUSION
Different multivariate statistical methods enabled the EADGENE teams to
discover groups of genes that displayed similar changes in gene expression
patterns. Statistical methods that use aprioridefined gene groups seem to
be useful in the search for biological relevant changes in gene expression al-
though the interpretation of the complex changes in gene expression remains a
challenge. Although these methods rely on annotated bovine genes it is possi-
ble to “borrow” information from other well-annotated species (e.g. human or
mouse) until more is known about the function of bovine genes.
ACKNOWLEDGEMENTS
The authors wish to acknowledge Caroline Channing, Karin Smedegard and
WP1.4 for organising the workshop, Zerbe et al. for providing the real data
sets and EADGENE for financial support (EU Contract No. FOOD-CT-2004-
506416).
REFERENCES
[1] Ashburner M., Ball C.A., Blake J.A., Botstein D., Butler H., Cherry J.M., Davis
A.P., Dolinski K., Dwight S.S., Eppig J.T., Harris M.A., Hill D.P., Issel-Tarver
L., Kasarskis A., Lewis S., Matese J.C., Richardson J.E., Ringwald M., Rubin
G.M., Sherlock G., Gene ontology: tool for the unification of biology, The Gene
Ontology Consortium, Nat. Genet. 25 (2000) 25–29.
[2] Bannerman D.D., Paape M.J., Lee J.W., Zhao X., Hope J.C., Rainard P.,
Escherichia coli and Staphylococcus aureus elicit differential innate immune
responses following intramammary infection, Clin. Diagn. Lab Immunol. 11
(2004) 463–472.
[3] Breiman L., Random forests, Mach Learn 45 (2001) 5–32.
Multivariate gene expression analyses 667
[4] Breiman L., Friedman J., Stone C.J., Olshen R.A., Classification and regression
trees, Chapman & Hall, New York, 1984.
[5] de Koning D.J., Jaffrézic F., Lund M.S., Watson M., Channing C., Hulsegge I.,
Pool H.M., Buitenhuis B., Hedegaard J., Hornshøj H., Jiang L., Sørensen P.,
Marot G., Delmas C., Lê Cao K A., San Cristobal M., Baron M.D., Malinverni
R., Stella A., Brunner R.M., Seyfert H M., Jensen K., Mouzaki D., Waddington
D., Jiménez-Marín Á., Pérez-Alegre M., Pérez-Reinado E., Closset R., Detilleux
J.C., Dov
ˇ
cP.,Lavri
ˇ
c M., Nie H., Janss L., The EADGENE Microarray Data
Analysis Workshop, Genet. Sel. Evol. 39 (2007) 621–631.
[6] Déjean S., Martin P., Baccini A., Besse P., Clustering time series gene expres-
sion data using smoothing spline derivativesEURASIP, J. Bioinform. Syst. Biol.,
vol. 2007, article ID 70561, 10 pages.
[7] Draghici S., Khatri P., Martins R.P., Ostermeier G.C., Krawetz S.A., Global
functional profiling of gene expression, Genomics 81 (2003) 98–104.
[8] Durinck S., Moreau Y., Kasprzyk A., Davis S., De M.B., Brazma A., Huber W.,
BioMart and Bioconductor: a powerful link between biological databases and
microarray data analysis, Bioinformatics 21 (2005) 3439–3440.
[9] Eisen M.B., Spellman P.T., Brown P.O., Botstein D., Cluster analysis and dis-
play of genome-wide expression patterns, Proc. Natl. Acad. Sci. USA 95 (1998)
14863–14868.
[10] Falcon S., Gentleman R., Using GOstats to test gene lists for GO term associa-
tion, Bioinformatics 23 (2007) 257–258.
[11] Gadat S., Younes L., A stochastic algorithm for feature selection in pattern
recognition, J. Mach. Learn. 8 (2007) />[12] Gentleman R.C., Carey V.J., Bates D.M., Bolstad B., Dettling M., Dudoit S.,
Ellis B., Gautier L., Ge Y., Gentry J., Hornik K., Hothorn T., Huber W., Iacus S.,
Irizarry R., Leisch F., Li C., Maechler M., Rossini A.J., Sawitzki G., Smith C.,
Smyth G., Tierney L., Yang J.Y., Zhang J., Bioconductor: open software devel-
opment for computational biology and bioinformatics, Genome Biol. 5 (2004)
R80.
[13] Goeman J.J., Buhlmann P., Analyzing gene expression data in terms of gene sets:
methodological issues, Bioinformatics 23 (2007) 980–987.
[14] Goeman J.J., Oosting J., Cleton-Jansen A.M., Anninga J.K., van Houwelingen
H.C., Testing association of a pathway with survival using gene expression data,
Bioinformatics 21 (2005) 1950–1957.
[15] Jaffrézic F., de Koning D.J., Boettcher P.J., Bonnet A., Buitenhuis B., Closset
R., Déjean S., Delmas C., Detilleux J.C., Dov
ˇ
c P., Duval M., Foulley J L.,
Hedegaard J., Hornshoj H., Hulsegge I., Janss L., Jensen K., Jiang L., Lavri
ˇ
c
M., Lê Cao K A., Lund M.S., Malinverni R., Marot G., Nie H., Petzl W., Pool
H.M., Robert-Granié C., San Cristobal M., van Schotshorst E.M., Schuberth H
J., Sørensen P., Stella A., Tosser-Klopp G., Waddington D., Watson M., Yang W.,
Zerbe H., Seyfert H M., Analysis of the real EADGENE data set: Comparison
of methods and guidelines for data normalisation and selection of differentially
expressed genes, Genet. Sel. Evol. 39 (2007) 633–650.
668 P. Sø re ns en et al.
[16] Lê Cao K.A., Bonnet A., Besse P., Robert-Granié C., San Cristobal M., Feature
selection with random forests for unbalanced multiclass microarray data: appli-
cation in pig ovarian follicular development, Belo Horizonte, Brazil, 13 August
2006, Proceedings of the 8th World Congress on Genetics Applied to Livestock
Production.
[17] Robert-Granié C., Baccini A., Besse P., Déjean S., Ferré P.J., Liaubet L., Martin
P.G.P., San Cristobal M., Kinetics analysis of microarray data using semipara-
metric mixed models, Belo Horizonte, Brazil, 13 August 2006, Proceedings of
the 8th World Congress on Genetics Applied to Livestock Production.
[18] Vangroenweghe F., Rainard P., Paape M., Duchateau L., Burvenich C., Increase
of Escherichia coli inoculum doses induces faster innate immune response in
primiparous cows, J. Dairy Sci. 87 (2004) 4132–4144.
[19] Watson M., CoXpress: differential co-expression in gene expression data, BMC
Bioinformatics 7 (2006) 509.
[20] Zhang J., Carey V., Gentleman R., An extensible application for assembling an-
notation for genomic data, Bioinformatics 19 (2003) 155–156.