Báo cáo sinh học: " Measuring connectedness among herds in mixed linear models: From theory to practice in large-sized genetic evaluations" pot
Bạn đang xem bản rút gọn của tài liệu. Xem và tải ngay bản đầy đủ của tài liệu tại đây (283.49 KB, 15 trang )
Genet. Sel. Evol. 40 (2008) 145–159 Available online at:
c
INRA, EDP Sciences, 2008 www.gse-journal.org
DOI: 10.1051/gse:2007041
Original article
Measuring connectedness among herds
in mixed linear models: From theory
to practice in large-sized genetic evaluations
Marie-Noëlle Fouilloux
1∗
, Virginie Cl
´
ement
2
,DenisLalo
¨
e
3
1
Institut de l’Élevage, Station de génétique quantitative et appliquée, INRA,
78352 Jouy-en-Josas, France
2
Institut de l’Élevage, Station d’amélioration génétique des animaux, INRA,
31326 Castanet-Tolosan, France
3
Station de génétique quantitative et appliquée UR337, INRA, 78352 Jouy-en-Josas, France
(Received 8 February 2007; accepted 16 October 2007)
Abstract – A procedure to measure connectedness among groups in large-sized genetic evalu-
ations is presented. It consists of two steps: (a) computing coefficients of determination (CD) of
comparisons among groups of animals; and (b) building sets of connected groups. The CD of
comparisons were estimated using a sampling-based method that estimates empirical variances
of true and predicted breeding values from a simulated n-sample. A clustering method that may
handle a large number of comparisons and build compact clusters of connected groups was de-
veloped. An aggregation criterion (Caco) that reflects the level of connectedness of each herd
was computed. This procedure was validated using a small beef data set. It was applied to the
French genetic evaluation of the beef breed with most records and to the genetic evaluation of
goats. Caco was more related to the type of service of sires used in the herds than to herd size.
It was very sensitive to the percentage of missing sires. Disconnected herds were reliably iden-
tified by low values of Caco. In France, this procedure is the reference method for evaluating
connectedness among the herds involved in on-farm genetic evaluation of beef cattle (IBOVAL)
since 2002 and for genetic evaluation of goats from 2007 onwards.
connectedness / clustering / BLUP / accuracy
1. INTRODUCTION
The problem of disconnectedness in genetic evaluation is becoming in-
creasingly important in animal breeding. In this context, the best linear un-
biased prediction (BLUP) of breeding values allows meaningful comparisons
between animals, but only when genetic links exist between the different envi-
ronments (e.g. [7]).
∗
Corresponding author:
Article published by EDP Sciences and available at
or />146 M N. Fouilloux et al.
Disconnectedness was originally defined for fixed effects models in terms
of non-estimability [2]. Such a definition implies that disconnectedness never
occurs for random effects, since their contrasts are always estimable. However,
the data design is the same whether the effect is fixed or random. Laloë [14] has
defined disconnectedness for random effects in terms of “non-predictability”
of contrasts: a contrast is not predictable if its coefficient of determination (CD)
is null. Laloë [14] showed the close relationship between the concepts of in-
estimability and non-predictability. Laloë and Phocas [15] showed that both
decrease in accuracy and potential bias in a genetic evaluation are due to the
same phenomenon of regression towards the mean. These authors proved that
these two effects of disconnectedness were assessed by CD of comparisons of
the BLUP of breeding values of animals raised in different environments. Al-
though using a different terminology (the “standardised prediction variance”
is equal to 1 – CD), Huisman et al. [10] used the square root of the CD of
comparisons as a criterion of connectedness.
Several other methods have been proposed to evaluate connectedness.
Foulley et al. [7] proposed a connectedness index (IC) equal to the relative
decrease in prediction error variance (PEV) when fixed effects are known.
Kennedy and Trus [12] measured the connectedness between two herds as the
average PEV of differences in expected breeding value between all pairs of an-
imals in the two herds (av_PEV). Lewis et al. [17] proposed the correlation
(r
ij
) of breeding value prediction errors as a pairwise connectedness statis-
tic and suggested averaging this statistic for all pairs of animals in different
management units to evaluate connectedness between units. Mathur et al. [18]
introduced a similar correlation statistic, the connectedness rating (CR
ij
), to
measure connectedness, based on the error (co)variances of fixed management
estimates. Other connectedness measures such as functions of counts of di-
rect links between test station groups have also been suggested [21]. Laloë
et al. [16] compared IC and av_PEV to CD. The CD was found to combine
data structure and amount of information. It also provides a balance between
the decrease of PEV and the loss of genetic variability owing to the genetic
relationships between animals. These authors concluded that CD was the best
method for judging the precision of a genetic evaluation or optimising corre-
sponding designs, especially when genetic relationships among animals are to
be accounted for through a relationship matrix.
Kuehn et al. [13] examined the importance of connectedness and weighed
the merits of CD, r
ij
and CR
ij
. They compared different connectedness scenar-
ios and found that only CD showed a consistent relationship with bias reduc-
tion across all scenarios tested. However, as stated by [13], “the CD is difficult
Measuring connectedness in genetic evaluation 147
to calculate for routine genetic evaluation due to storage and processing time
involved in calculating both the inverse of the coefficient matrix and the (non-
inverted) relationship matrix”. They advocated measuring connectedness by
other criterions, highly correlated to CD, but easier to compute.
Another way to circumvent this drawback is to turn to methods of approxi-
mated estimation of variance-covariance matrices. Garcia-Cortes et al.[9]and
Fouilloux and Laloë [4] have proposed sampling methods that theoretically al-
low the estimation of entire variance-covariance matrices, and, as a result, the
estimation of CD of contrasts among genetic levels of units. Two units should
be considered connected as soon as their genetic levels are predicted with suf-
ficient accuracy. The choice of this level is rather arbitrary just like the choice
of a level of accuracy for individual genetic values (EBV) to be published.
However, links between CD of contrasts among units and both accuracy of
contrasts among animals of different units and bias reduction as established
by [16] should help to choose such a level. Once the minimal level of CD is
chosen, say χ, groups of connected units have to be built, generally through
clustering methods [7].
To be applicable in large-sized genetic evaluations, a method for building
groups of connected units should meet two requirements: (i) to explicitly build
clusters of units in such a way that the CD of the contrast between the genetic
levels of two randomly picked units will be higher or equal to χ; (ii) to handle
a large number of units, which may reach several thousands.
This paper presents a new clustering method for the estimation of connect-
edness in across herd genetic evaluation, named “Caco”. The method is first
validated in a small genetic evaluation of the French Bazadais beef cattle breed.
Subsequently, the application is demonstrated in two large genetic evaluations.
These are the evaluation of 210-day weight in the French Charolais beef cattle
breed and the evaluation of protein yield in a multi-breed population of dairy
goats.
2. MATERIALS AND METHODS
2.1. Theory
Consider the following mixed model:
y = Xb + Zu + e (1)
where y is the performance vector, b the fixed effect vector, u the random effect
vector, e the residual vector, and X and Z the incidence matrices that associate
elements of b and u with those of y.
148 M N. Fouilloux et al.
The variance structure for this model is the following:
u
e
∼ N
0
0
,
Aσ
2
a
0
0Iσ
2
e
(2)
where A is the numerator relationship matrix, and the scalars σ
2
a
and σ
2
e
are the
random effect and the residual variances, respectively. The BLUE (Best Linear
Unbiased Estimation) of b, denoted b˚, and the BLUP (Best Linear Unbiased
Prediction) of u, denoted
ˆ
u, are the solutions of:
b˚
ˆ
u
=
X
XX
Z
Z
XZ
Z + λA
−1
−1
X
y
Z
y
where λ = σ
2
e
σ
2
a
. (3)
The precision of a comparison between the genetic values of animals or groups
of animals is assessed by the CD of the corresponding contrast [14]. Typically,
a given contrast can be written as a linear combination of the breeding val-
ues (c
u). Hence, for any linear combination c
u,wehave:
CD
c
u
=
(
cov(c
u, c
ˆ
u)
)
2
var(c
u)var(c
ˆ
u)
· (4)
For instance, the CD of the estimated breeding value of a single animal is
obtained by using a vector c
null except a 1 in the appropriate position corre-
sponding to this breeding value.
2.2. Estimation of CD of contrasts
The method presented by Fouilloux and Laloë [4] to estimate CD of esti-
mated breeding values has been applied to a sire model to approximate the CD
of contrasts between herds. The procedure is as follows:
1– The animals involved in the simulation are sorted from the oldest to the
youngest.
2– The direct genetic value u
i
of the animal i is calculated according to
the status of its sire (j). If j is unknown, u
i
is generated from N
0,σ
2
a
.Ifjis
known, u
i
is calculated by u
i
= 0.5u
j
+ϕ
i
where ϕ
i
is drawn from N
0, 3σ
2
a
4
.
3– Performance of each performance-tested animal (l) is simulated using the
generated breeding value of its sire (j). Fixed effects are set to 0. Consequently,
y
l
= s
i
+ε
l
, with s
j
= 0.5 × u
j
and the residual ε
l
is drawn from N
0,σ
2
ε
where
σ
2
ε
= 3σ
2
a
4 + σ
2
e
.
Measuring connectedness in genetic evaluation 149
4– The vector
ˆ
s is obtained by solving the mixed model equations (3)
using y. This process repeated n times leads to vectors of genetic values,
u
(k)
k = 1, n
and
ˆ
u
(k)
k = 1, n
where
ˆ
u = 2 ×
ˆ
s.
5– The CD of contrasts of interest are estimated by computing their empiri-
cal variances and covariances (quoted with *) and substituting them in (4):
CD
∗
c
u
=
(
cov
∗
(c
u, c
ˆ
u)
)
2
var
∗
(c
u)var
∗
(c
ˆ
u)
with
cov
∗
(c
u, c
ˆ
u) =
n
k=1
c
u
(k)
c
ˆ
u
(k)
n
, var
∗
(c
u) =
n
k=1
c
u
(k)
2
n
and
var
∗
(c
ˆ
u) =
n
k=1
c
ˆ
u
(k)
2
n
·
The NAG
[19] subroutines were used for drawing random numbers. The ap-
proximated distributions of vectors were obtained with 1000 replicates. BLUP
were estimated using a successive overrelaxation iterative method, ceasing it-
eration when the following convergence criterion was less than 10
−3
Converg. =
i
ˆ
θ
(k)
i
−
ˆ
θ
(k−1)
i
2
i
ˆ
θ
(k)
i
2
where
ˆ
θ
(k)
=
ˆ
θ
(k)
i
=
b˚(k )
ˆ
u
(k)
.
2.3. Se lecting the set of connected herds: the Caco method
The main practical goal of connectedness studies is to identify sets of con-
nected herds. Two herds are considered connected if the CD of the contrast
between their genetic levels is greater than an apriorithreshold, say χ. A set
of connected herds should then be built in such a way that any pairwise CD
of contrasts between herds of the set is greater than χ. This might be achieved
through the use of a clustering method, namely the complete linkage method.
Complete linkage is a hierarchical agglomerative clustering method that finds
small, compact clusters that do not exceed some diameter threshold. However,
this method cannot handle very large problems. Here, we are proposing an al-
ternative agglomerative clustering procedure, which is explicitly designed for
building compact clusters and is suitable for large-sized data sets.
150 M N. Fouilloux et al.
At the start of the process, each herd begins in a cluster by itself, and each
step involves aggregating herds one by one into appropriate clusters:
Step 1. Each herd begins in the cluster by itself: [{h
1
},{h
2
}, ,{h
n
}].
The two herds linked by the highest CD of comparison, say h
1
and h
2
,are
clustered together, leading to the following partition: [{h
1
,h
2
}, ,{h
n
}].
Step 2. A similarity index is calculated for each herd outside the cluster
{h
1
,h
2
}. The similarity index of a given herd is equal to its lowest CD with the
herd currently in the cluster. The herd with the highest similarity index is added
to the cluster. The Caco (“Criterion of Admission to the group of COnnected
herds”) of this new clustered herd is equal to its similarity index at this step.
Supposing, for the sake of simplicity, that this herd is h
3
, then, the new partition
is the following: [{h
1
,h
2
,h
3
}, ,{h
n
}].
The process stops either when all herds are clustered, or when the CD of
comparison between the clustered herds and each of the remaining herds are
all lower than the fixed apriorithreshold χ. In that latter case, the algorithm
is applied to the remaining herds for the building of other possible clusters.
Eventually, two herds within the same cluster are ensured to be compared with
aCD χ. The choice of χ can be considered in relation to CD, which can
be taken as a criterion of accuracy. Laloë and Phocas [15] showed that, for
balanced sire designs where connections are established using common sires
across units, the CD is a perfect indicator of potential bias arising when com-
paring individuals in separate units. They proved that, in such a design, the CD
of the contrast between genetic levels of two herds is equal to:
CD =
nη
nη + λ
, (5)
where n is the number of progeny per sire, η is the proportion of progeny
from common sires, and λ the variance ratio defined in equation (3). Therefore,
CD depends on three factors, (i) the amount of information through n,the
number of progeny per sire; (ii) the quality of the design through η; and (iii)
the heritability via the variance ratio λ. It is worth noting that the need for
links decreases with the number of progeny per sire, but not with the number
of sires per herd. These theoretical results were confirmed by Kuehn et al. [13].
Formula (5) may be used as a rule of thumb when choosing the value of χ.
2.4. Validation of the procedure
Validation of this procedure was done with the data used on the official
French on-farm beef cattle evaluation, IBOVAL, for the Bazadais breed and
Measuring connectedness in genetic evaluation 151
the year 2006 [11]. The trait analysed was 210-day weight. The model used
was a sire model and included the same fixed effect factors as in the actual
IBOVAL evaluation [11].
The data set consisted of 4957 weights and 371 sires. Unknown sires were
replaced by one dummy sire in each management unit [6]. Management unit
(400 levels), sex (2 levels), parity-age of dam (12 levels) and season (9 levels)
were included in the model as fixed effects. The heritability (h
2
) was equal to
0.23. The connectedness was studied among the 45 herds that had calf per-
formances recorded during the last five years. The empirical variances and
covariances needed to estimate the CD of comparison between herds were cal-
culated using their later calves only, because these are the most relevant to
current selection.
The threshold χ was chosen to be equal to 0.4. In the IBOVAL context,
considering a number of progeny per sire equal to 25 (the minimum progeny
number required by IBOVAL to publish bull indexes) which corresponds to
a CD of 0.6), formula (5) leads to a rate of Artificial Insemination (AI) use
of 44%.
The estimated values of CD of comparison among herds were computed by
performing the re-sampling method described in Section 2.2. The limited size
of the data set also allowed the computations of the true CD of comparison by
the direct inversion of the coefficient matrix.
2.5. Application of the procedure
The procedure to assess connectedness was applied to the genetic evalua-
tion of 210-day weight (IBOVAL [11]) in the Charolais beef cattle breed and
to the French goat multi-breed genetic evaluation for the protein yield [3].
The Charolais data included approximately 2 600 000 weaning weights from
80 000 bulls. The model used was a sire model (h
2
= 0.26) and included
the same fixed effects as in the real IBOVAL evaluation: management unit
(75 000 herd-year), parity-age of dam (25 levels), sex (2 levels), season (10 lev-
els) and supplementation level (2 levels, supplementary fed or not). The data
included 3576 herds with calf performances recorded during the last five years.
The method was also applied to the genetic evaluation of protein yield
(h
2
= 0.30) in French dairy goats. The data included 1 720 000 first lac-
tation records from 89 500 sires, with the following fixed effects: herd-year
(56 700 levels), age of the female at the beginning of the lactation (8 lev-
els) and kidding month (6 levels). The connectedness was studied among
152 M N. Fouilloux et al.
Table I. Distributions of CD of contrasts and Caco in the Bazadais evaluation.
Number Mean Standard deviation Minimum Maximum
True CD 990 0.262 0.145 0.001 0.703
Estimated CD 990 0.294 0.151 0.011 0.716
True Caco 45 0.297 0.209 0.001 0.703
Estimated Caco 45 0.320 0.207 0.011 0.716
the 2354 herds that had females with a first lactation recorded during one of
the last three years.
In both analyses, unknown sires were replaced by one dummy sire in each
management unit [6]. All the computations used a RISC 595 supercomputer
with a CPU of 133 MHz. Plots, dendrograms and smoothing surfaces were
drawn with the R software [20] and the contributed packages Rcmdr [8] and
mgcv [22].
3. RESULTS AND DISCUSSION
3.1. Validation of the procedure
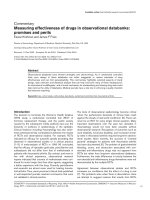
The true CD of the 990 contrasts between the Bazadais herds range between
0.001 and 0.703 (Tab. I), with a mean of 0.262 and a standard deviation of
0.145. The approximated CD values range between 0.011 and 0.716, with a
mean of 0.294 and a standard deviation of 0.151. The approximated CD values
are slightly overestimated compared to the true CD, but the correlation between
the estimated and true values is very close to 1 (r = 0.966), as illustrated by
Figure 1.
The clustering procedure was applied to the two sets of CD. The maximum
and minimum for true Caco and CD are the same, as well as the maximum
and minimum for estimated Caco and CD (Tab. I). The mean and standard
deviation of the true Caco are 0.297 and 0.209, respectively, while the corre-
sponding values for the estimated Caco are 0.320 and 0.207. As for the CD,
the approximated Caco is slightly overestimated. Estimated and true Caco are
highly correlated (r = 0.976), as illustrated by Figure 2.
Figure 3 highlights the clustering processes applied to the true CD (left hand
tree) and the estimated CD (right hand tree). In consultation with French beef
cattle breed societies, the threshold level χ to consider a herd as connected
was taken as 0.40. This was consistent with a previous measure of connec-
tion based on the number of calves born in a herd-year from AI sires. This
threshold also connected small herds with a high proportion of AI and herds
Measuring connectedness in genetic evaluation 153
Figure 1. True and estimated CD, for the Bazadais data set. The dotted line is the
linear regression line of the estimated CD on the true CD. The solid line corresponds
to the equation y = x.
Figure 2. True Caco and estimated CD, for the Bazadais dataset. The dotted line
is the linear regression line of the estimated Caco on the true Caco. The solid line
corresponds to the equation y = x.
154 M N. Fouilloux et al.
Table II. Distributions of Caco and CD of contrasts over all the herds / the connected
herds in the Charolais evaluation.
Mean Standard deviation Minimum Maximum
Caco 0.53 / 0.64 0.23 / 0.17 0.00 / 0.40 1.00 / 1.00
Average CD 0.54 / 0.67 0.12 / 0.08 0.07 / 0.48 0.92 / 0.96
Maximal CD 0.93 / 0.96 0.08 / 0.04 0.49 / 0.74 1.00 / 1.00
Minimal CD 0.05 / 0.46 0.04 / 0.03 0.00 / 0.40 0.48 / 0.74
with a low use of AI but which exchanged numerous natural service sires. Pro-
cesses using true and estimated CD were quite comparable and led to similar
clusters. In each process, only one cluster was found. Fourteen herds made up
the cluster when considering true CD. These 14 herds were again included in
the cluster built using estimated CD (right hand tree), but, owing to the slight
overestimation shown in Figure 1, a 15
th
herd was added to the cluster.
3.2. Application of the method
3.2.1. Charolais beef cattle evaluation
The 1000 replicates carried out to estimate the CD of contrasts required less
than three hours of CPU time. The cluster analysis was performed and the
Caco criterion was calculated in about 13 min. Among the 3576 herds, 2791
had a Caco greater or equal to 0.40 and, therefore, were considered connected
to each other. For each herd, the average, minimal and maximal Caco and CD
of comparisons with other herds were computed (Tab. II). The major differ-
ence between all herds and the connected ones concerned the minimal CD. Its
average value increased from 0.05 (whole set) to 0.46 (connected set). As ex-
pected, the minimum value of this statistic was null in the whole set and always
greater or equal to χ the connected set.
Relationships among the Caco and other parameters describing the herds
were investigated (Tab. III). The Caco of a herd was more related to the aver-
age (r = 0.94) and maximal (r = 0.77) than to the minimal (r = 0.18) of the CD
of contrasts pertaining to the herd. It depended only slightly on the herd size
(r = 0.16), while it increased with the number of sires used (r = 0.57). The per-
centage of unknown sires in a herd tended to decrease Caco (–0.27). Moreover,
for 13 herds in which the percentage of unknown sires was 100%, the Caco was
equal to zero. Furthermore, Caco increased with sire accuracy (r = 0.75), and
for AI link sires used across herds (r = 0.76).
Measuring connectedness in genetic evaluation 155
Figure 3. Dendrograms resulting from the Caco method applied to the true CD (left hand tree) and to the estimated CD (right hand
tree) of contrasts between herds, for the Bazadais dataset. The process begins at the bottom right of the dendrogram. The height of the
nodes is equal to the Caco of the right herd. The clusters corresponding to the threshold of 0.4 are highlighted by a rectangle. The herds
inside the rectangle are connected, with a Caco 0.4.
156 M N. Fouilloux et al.
Table III. Correlations between Caco and herd descriptors in the Charolais evaluation.
Number of performances/herd 0.16
Number of sires/herd 0.57
% calves with unknown sire –0.27
Average number of herds/sire 0.76
Average number of records/sire 0.75
Average CD 0.94
Minimal CD 0.18
Maximal CD 0.77
Caco of herds involved in IBOVAL are re-estimated every year including
records on calves born in the last five years. The stability of Caco was checked
by comparing the results from successive years. Among the 3801 herds in-
volved in the Charolais genetic evaluations of weaning weight in 2005 and
2006, the correlation between the Caco of both years was equal to 0.94. The
main variations are easily explained by high modification of the AI rate or of
the percentage of unknown sires in the herds concerned.
3.2.2. Goat breed application
The average Caco value was equal to 0.34 with a standard deviation of 0.26.
As in the beef breed genetic evaluation, the Caco was strongly related to the
percentage of goats with AI sire and to the percentage of unknown sires that
reached on average 42% among French goats [3]. All herds with 100% of un-
known sires had null Caco. Most of the herds that used AI sires had a high
Caco, as highlighted by the correlation between the Caco and the percentage
of goats with AI sire (r = 0.72). However, some herds in which the AI rate
was low also had a high Caco. That is explained by the use, in those herds,
of natural mating sires sired by AI. The correlation between Caco and the
percentage of goats with an AI paternal grandsire was indeed equal to 0.76.
A two-dimensional smoothing plot (Fig. 4), based on a generalised additive
model [22] highlighted these relationships among Caco, the percentage of
goats with AI sire (%AIs) and AI paternal grandsire (%Algs).
These results emphasise that the pedigree information was taken into ac-
count for measuring the connectedness level among herds.
As in beef breed genetic evaluation, the stability of the Caco estimation
was high. Herds (1979) were involved in both genetic evaluations of 2003 and
2004. The correlation between their Caco estimated in 2003 and 2004 was
equal to 0.92.
Measuring connectedness in genetic evaluation 157
Figure 4. A two-dimensional smoothing surface showing Caco values with respect to
the percentage of goats with AI sire (%AIs) and AI paternal grandsire (%Algs).
4. CONCLUSION
A new two-step process to analyse connectedness among herds is described:
the first step involves computing the CD of comparisons between groups of
animals using a sampling method, while in the second step, clusters of well
connected groups are formed. In applying this method, a decision needs to be
made on the threshold χ for the CD to be achieved before a herd is considered
to be connected. Such a decision still is and will always be a subjective matter.
However, a more informed choice is possible using CD as a criterion of accu-
racy and potential bias, and by considering the relationships between CD, the
amount of information, and quality of design.
Thanks to the simplicity of this method, different models of analysis may be
easily adapted. The choice of the best model depends on the size of the analyses
and the knowledge of the pedigree. Hence, application of single- or multi-trait
analyses using an animal model with or without maternal effects will be pos-
sible for small-sized evaluations, while sire or sire-maternal grandsire models
can be used for large-sized evaluations, depending on the amount of the un-
known sires or grandsires in the pedigree files. For instance, in the French beef
breed genetic evaluation, a sire-maternal grandsire model with maternal effects
will soon be tested to measure how worthwhile it is to add pedigree information
and especially to consider the connection due to the dams. Furthermore, since
158 M N. Fouilloux et al.
first lactations represent only 29% of the whole dataset used in the French goat
genetic evaluation, the method should be extended to a repeated trait model.
The clustering method was appropriate to condense the relevant information
of large matrices of similarities (here, CD of contrasts between genetic levels
of herds). It meets the requirement to construct sets of well connected units,
and may very quickly handle large problems (4000 herds in less than 15 min).
Finally it provides a set of connected herds, which makes it possible to define
a pool of animals for which estimated breeding values can be compared.
The procedure efficiently accounts for known pedigree and data structure
when measuring connectedness between herds. It matched the expectations of
breeder associations based on their knowledge of the level of genetic exchange
among herds, and has been well adopted. The procedure has been used as the
reference method to determine the connected herds in the regular IBOVAL
evaluation of nine French beef cattle breeds since 2002 [5]. It will also be
applied to the goat genetic evaluation from 2007 onwards [1].
REFERENCES
[1] Bluet B., Clément V., Martin P., Laloë D., Fouilloux M.N., Mise en place d’un
nouveau critère de connexion génétique dans l’espèce caprine, Renc. Rech.
Ruminants 13 (2006) 223.
[2] Chakrabarti C., On the C matrix in design for experiments, J. Indian Stat. Assoc.
1 (1963) 8–23.
[3] Clément V., L’indexation des caractères laitiers, Indexation caprine, IE-INRA
(2001). />id_ article=369&id_espace=32
[4] Fouilloux M.N., Laloë D., A sampling method for estimating the accuracy of
predicted breeding values in genetic evaluation, Genet. Sel. Evol. 33 (2001) 473–
486.
[5] Fouilloux M.N., Laloë D., Évolution de la méthode d’appréciation de la
connexion entre troupeaux, Note Iboval 28, IE-INRA (2002). t-
elevage.asso.fr/html1/spip.php?page=rubrique_espace&id_espace=76&id_
rubrique=589
[6] Fouilloux M.N., Laloë D., Amélioration du calcul du CACO en 2005,
Note IBOVAL 42, IE-INRA (2005). />spip.php?page=rubrique_espace&id_espace=76&id_rubrique=589
[7] Foulley J.L., Hanocq E., Boichard D., A criterion for measuring the degree of
connectedness in linear models of genetic evaluation, Genet. Sel. Evol. 24 (1992)
315–330.
[8] Fox J., The R Commander: A basic-statistics graphical user interface to R, J. Stat.
Software 14 (2006) 1–42.
[9] Garcia-Cortes L.A., Moreno C., Varona L., Altarriba J., Estimation of prediction-
error variances by resampling, J. Anim. Breed. Genet. 112 (1995) 176–182.
Measuring connectedness in genetic evaluation 159
[10] Huisman A.E., Tier B., Brown D.J., On assessing contrasts between groups of
animals, Livest. Sci. (2006) 254–267.
[11] Journaux L., Fouilloux M.N., Guerrier J., Laloë D., Results of the ge-
netic evaluation Iboval 2006 for the beef cattle breeds, Edition 2006/1,
CR 010679103, Institut de l’Élevage, Paris, France (2006) t-
elevage.asso.fr/html1/spip.php?page=article_espace&id_espace=76&id_
article=10869
[12] Kennedy B.W., Trus D., Considerations on genetic connectedness between man-
agement units under a animal-model, J. Anim. Sci. 71 (1993) 2341–2352.
[13] Kuehn L.A., Lewis R.M., Notter D., Managing the risk of comparing estimated
breeding values across flocks or herds through connectedness: a review and ap-
plication, Genet. Sel. Evol. 39 (2007) 225–247.
[14] Laloë D., Precision and information in linear-models of genetic evaluation,
Genet. Sel. Evol. 25 (1993) 557–576.
[15] Laloë D., Phocas F., A proposal of criteria of robustness analysis in genetic eval-
uation, Livest. Prod. Sci. 80 (2003) 241–256.
[16] Laloë D., Phocas F., Ménissier F., Considerations on measures of precision and
connectedness in mixed linear models of genetic evaluation, Genet. Sel. Evol.
28 (1996) 359–378.
[17] Lewis R.M., Crump R.E., Simm G., Thompson R., Assessing connectedness in
across-flock genetic evaluations, Proc. Brit. Soc. Anim. Sci. (1999) 121.
[18] Mathur P.K., Sullivan B.P., Chesnais J.P., Measuring connectedness: concept and
application to a large industry program, Proceedings of the 7th World Congress
of Genetics Applied to Livestock Production, 19–23 August 2002, Vol. 32,
Montpellier, France, pp. 545–548.
[19] Numerical Algorithm Group, The NAG Fortran Library Manual, mark 16,
The Numerical Algorithm Group limited, 1993.
[20] R Development Core Team, R: a Language and Environment for Statistical
Computing, R Foundation for Statistical Computing, Vienna, Austria (2006)
ISBN: 3-900051-07-0; .
[21] Roso V.M., Schenkel F.S., Miller S.R., Degree of connectedness among groups
of centrally tested beef bulls, Can. J. Anim. Sci. 84 (2004) 37–47.
[22] Wood S.N., Generalized Additive Models: An introduction with R., 1st Edn.,
Chapman & Hall, University of Bath, England, 2006.