Báo cáo sinh học: " Exploration of lagged relationships between mastitis and milk yield in dairy cows using a Bayesian structural equation Gaussian-threshold model" pdf
Bạn đang xem bản rút gọn của tài liệu. Xem và tải ngay bản đầy đủ của tài liệu tại đây (335.96 KB, 25 trang )
Original article
Exploration of lagged relationships
between mastitis and milk yield in dairy
cows using a Bayesian structural equation
Gaussian-threshold model
Xiao-Lin WU
1
*
, Bjørg HERINGSTAD
2
, Daniel GIANOLA
1,2,3
1
Department of Dairy Science, University of Wisconsin, Madison, WI 53706, USA
2
Department of Animal and Aquacultural Sciences, Norwegian University of Life Sciences,
1432 A
˚
s, Norway
3
Department of Animal Sciences and Department of Biostatistics and Medical Bioinformatics,
University of Wisconsin, Madison, WI 53706, USA
(Received 17 May 2007; accepted 15 January 2008)
Abstract – A Gaussian-threshold model is described under the general framework of
structural equation models for inferring simultaneous and recursive relationships between
binary and Gaussian characters, and estimating genetic parameters. Relationships
between clinical mastitis (CM) and test-day milk yield (MY) in first-lactation Norwegian
Red cows were examined using a recursive Gaussian-threshold model. For comparison,
the data were also analyzed using a standard Gaussian-threshold, a multivariate linear
model, and a recursive multivariate linear model. The first 180 days of lactation were
arbitrarily divided into three periods of equal length, in order to investigate how these
relationships evolve in the course of lactation. The recursive model showed negative
within-period effects from (liability to) CM to test-day MY in all three lactation periods,
and positive between-period effects from test-day MY to (liability to) CM in the following
period. Estimates of recursive effects and of genetic parameters were time-dependent. The
results suggested unfavorable effects of production on liability to mastitis, and dynamic
relationships between mastitis and test-day MY in the course of lactation. Fitting recursive
effects had little influence on the estimation of genetic parameters. However, some
differences were found in the estimates of heritability, genetic, and residual correlations,
using different types of models (Gaussian-threshold vs. multivariate linear).
Bayesian inference / mastitis / milk yield / structural equation model / threshold model
1. INTRODUCTION
Multivariate linear models have long bee n used for multiple-trait genetic
evaluation and analysis e.g.[2,18,24]. However, these s tandard models do not
*
Corresponding author:
Genet. Sel. Evol. 40 (2008) 333–357
Ó INRA, EDP Sciences, 2008
DOI: 10.1051/gse:2008009
Available online at:
www.gse-journal.org
Article published by EDP Sciences
allow for causal simultaneous or recursive relationships (SIR) between pheno-
types, which may be present in many biological systems. In dairy cattle, for exam-
ple, a high milk yield (MY) may increase liability to mastitis, and the disease in
turn can affect MY adversely [19]. Statistically, simultaneous effects arise when
two v ariables have mutual direct effects on each other , whereas a recursive spec-
ification postulates that one variable af fects t he other but the reciprocal effect does
not exist. Gianola and Sorens en [10] extended quantitative genetics models to han-
dle situations in which ther e are SIR eff ects between phenotypes in a multivariate
system, assuming an infinitesimal, additive, model of inheritance. A SIR model is
one among many members included in the general class of structural equation
models, where the main objective is to investigate causal pathways. Wu et al.
[26] e xtended t he SIR models further to accommodate population heterogeneity.
These S I R models, howev er, assume t hat all characters have continuous distribu-
tions of phenotypes, and are not readily a pplicable to discrete response variables.
Gaussian-threshold models have been proposed to a nalyze continuous (e.g.,
milk production) and discrete (e.g., diseases) characters jointly [14,23]. Some
discrete characters, known as threshold o r quasi-continuous traits, can be ana-
lyzed by postulating an underlying continuous distribution of phenotypes, which
maps into the observed scale via a set of fixed thresholds [9]. The threshold-
liability concept w as first out lined by Wright [25] for the analysis o f the number
of toes in Guinea pigs. However, most Gaussian-threshold models currently
available do not accommodate SIR relationships in structure equations. Lo´pez
de Maturana et al.[15] described an ‘‘equivalent’’ recursive model in which
each equation takes phenotypes o f preceding equations as covariates.
In the present paper , Gaussian-threshold models under the general concept of
structural equation models are described for inferring SIR relationships between
binary (e.g., diseases) and continuous (e.g., production) characters. A Bayesian
analysis via Markov chain Monte Carlo (MCMC) implementation is used to infer
parameters of interest. Methods for h andling ordered categorical characters are dis-
cussed as well. The method was u sed t o explore lagged or carry-over relationships
between mastitis and MY during the first 180 days of first-lactation Norwegian
Red c ows. For comparison, the data were a lso analyzed using standard mul tivar-
iate linear and Gaussian-threshold m odels, a s well a s a recursive linear model.
2. MATERIALS AND METHODS
2.1. Statistical model
Consider n individuals, each of which is measured on t
1
continuous
characters (e.g., production traits) and t
2
binary traits (e.g., diseases).
334
X L. Wu et al.
Let y
c
i
¼ y
i;1
::: y
i;t
1
ÀÁ
be a vector containing observations for the t
1
continuous
characters of the ith individual. Let g
i
¼ g
i;t
1
þ1
::: g
i;t
1
þt
2
ÀÁ
be a vector contain-
ing the t
2
binary variables (observable s cale) o f t he ith individual, and
y
b
i
¼ y
i;t
1
þ1
::: y
i;t
1
þt
2
ÀÁ
be a v ector containing the corresponding liability vari-
ables (underlying scale), which are assumed to be continuous and normally dis-
tributed. The theory of threshold models states that for a binary character, the
phenotype of an individual is 1 (e.g., sick) if the underlying liability e xceeds a
threshold j
b
and0(e.g., healthy) otherwise, so
g
i;b
jy
i;b
; j
b
¼
1ify
i;b
> j
b
;
0 otherwise;
(
ð1Þ
where b ¼ t
1
þ 1; :::; t
1
þ t
2
. The threshold is fixed arbitrarily to center the
distribution, so it is not an unknown parameter in a binary threshold model.
Let g and y
b
be vectors c ontaining all binary observations and underlying lia-
bilities, respectively, of all individuals, and let j ¼
j
t
1
þ1
::: j
t
1
þt
2
ðÞbe a vector
that contains the thresholds for all binar y traits. Then, the conditional probability
of observing a realization o f g,giveny
b
and j,isgivenby
p gjy
b
; j
ÀÁ
¼
Y
t
1
þt
2
b¼t
1
þ1
Y
n
i¼1
Iy
i;b
j
b
ÀÁ
I g
i;b
¼ 0
ÀÁ
þ Iy
i;b
> j
b
ÀÁ
I g
i;b
¼ 1
ÀÁÈÉ
;
ð2Þ
where I(A) is an indicator function, which takes the value 1 if condition A is
true and 0 otherwise.
Next, consider the joint distribution of the continuous phenotypes and of the
liabilities of the binary characters. The unknown liabilities are treated as
nuisance parameters, after data augmentation, in t he second step of the multi-
level modeling. Note that y
i
¼
y
c
i
0
y
b
i
0
ÀÁ
0
.Assume,further,thatvariablesiny
i
are af fected mutually, so t hat a phenotype or li ability is a linear function of other
phenotypes or liabilities, as well as of ‘‘ fixed’’ and random effects that are
relevant. Then, the model is
y
i;j
¼
X
t
1
þt
2
j
0
6¼j
k
j;j
0
y
i;j
0
þ x
0
i;j
b þ z
0
i;j
u þ w
0
i;j
c þ e
i;j
:
ð3Þ
Here, b is a vector of fixed effects; u is a vector of genetic effects; c is a vector
of environmental effects (e.g., herds); e
i,j
is a random residual; x
0
i;j
, z
0
i;j
, w
0
i;j
are
incidence row vectors pertaining to the jth trait of the ith individual, and k
j,j
0
is
Bayesian structura l equation Gaussian-threshold model
335
an unknown structural coefficient (i.e., regression coefficient of phenotype j
on phenotype or liability j
0
). If all k’s are equal to 0, then (3) is a standard lin-
ear model. In matrix form, (3) can be expressed as
K
y
i;1
ÁÁÁ
y
i;t
1
y
i;t
1
þ1
ÁÁÁ
y
i;t
1
þt
2
0
B
B
B
B
B
B
@
1
C
C
C
C
C
C
A
¼ X
i
b þ Z
i
u þ W
i
c þ e
i
; ð4Þ
where
X
i
¼
x
i;1
::: x
i;t
1
x
i;t
1
þ1
::: x
i;t
1
þt
2
ðÞ
0
;
Z
i
¼
z
i;1
::: z
i;t
1
z
i;t
1
þ1
::: z
i;t
1
þt
2
ðÞ
0
;
W
i
¼
w
i;1
::: w
i;t
1
w
i;t
1
þ1
::: w
i;t
1
þt
2
ðÞ
0
;
e
i
¼
e
i;1
::: e
i;t
1
e
i;t
1
þ1
::: e
i;t
1
þt
2
ðÞ
0
:
The K matrix is a structural coefficient matrix, in which a diagonal element is
1 and an off-diagonal element is Àk
jj
0
(j 6¼ j
0
).
The conditional distribution of Ky
i
is assumed multivariate normal, such that
Ky
i
jb; u; c; R
0
$ N X
i
b þ Z
i
u þ W
i
c; R
0
ðÞð5Þ
or, by changing variables
y
i
jk; b; u; c; R
0
$ N K
À1
X
i
b þ Z
i
u þ W
i
cðÞ; K
À1
R
0
K
0
À1
; ð6Þ
where R
0
is a residual variance-covariance matrix, and k is a vertical concate-
nation of all off-diagonal elements of K. Conditionally on b, u, and c, the Ky
i
’s
are mutually independent. The same is true of the y
i
’s, given b, u, c, and k. Thus,
p yjk; b; u; c; R
0
ðÞ¼
Y
n
i¼1
p y
i
jk; b; u; c; R
0
ðÞ
/
1
K
À1
R
0
K
0
À1
n=2
 exp 1
2
X
n
i¼1
y
i
À K
À1
X
i
b À Z
i
u À W
i
cðÞ
ÀÁ
0
(
 K
0
R
À1
0
K
ÀÁ
y
i
À K
À1
X
i
b À Z
i
u À W
i
cðÞ
ÀÁ
)
¼
K
jj
n
R
0
jj
n=2
 exp 1
2
X
n
i¼1
Ky
i
À X
i
b À Z
i
u À W
i
cðÞ
0
R
À1
0
Ky
i
À X
i
b À Z
i
u À W
i
cðÞ
()
:
ð7Þ
336 X L. Wu et al.
For this hierarchical model, the joint distribution of all observed d ata (includ-
ing b inary scores) and l iabilities is
p g; yjk; b; u; c; R
0
ðÞ¼p gjy
b
; j
ÀÁ
p yjk; b; u; c; R
0
ðÞ
¼
Y
t
1
þt
2
b¼t
1
þ1
Y
n
i¼1
Iy
i;b
j
b
ÀÁ
I g
i;b
¼ 0
ÀÁ
þ Iy
i;b
> j
b
ÀÁ
I g
i;b
¼ 1
ÀÁÂÃ
Â
K
jj
n
R
0
jj
n=2
 exp 1
2
X
n
i¼1
Ky
i
À X
i
b À Z
i
u À W
i
cðÞ
0
R
À1
0
Ky
i
À X
i
b À Z
i
u À W
i
cðÞ
()
:
ð8Þ
Note that, given the liabilities and the thresholds, the vector of discrete out-
comes g is independent of y
c
, the Gaussian phenotypes.
2.2. Prior distributions
Following Gianola and Sorensen [10], we assigned multivariate normal prior
distributions to structural coefficients and ‘‘ fixed’’ effects. By assuming an
infinitesimal model, the prior distribution of genetic effects is multivariate nor-
mal with an unknown genetic covariance matrix G
0
, ujA; G
0
$ Nð0; A G
0
Þ,
where A is the additive relationship matrix and represents the Kronecker
product. Similarly, the prior distribution of the environmental effects vector is
c $ N 0; I D
0
ðÞ,whereD
0
is a variance-covariance matrix among environ-
mental effects. The prior distributions of the genetic, environmental, and resid-
ual covariance matrices are assumed to be inverted Wishart, Wishart
À1
t
k
; V
k
ðÞ,
with scaling matrix V
k
and degrees of freedom parameter t
k
,where
k ¼ G
0
; D
0
; R
0
.
2.3. Joint posterior distributions
Let h ¼ k; b; u; c; G
0
; D
0
; R
0
fg
be the parameters of t he model. The poster-
ior distribution is augmented with the unobserved liabilities such that the joint
posterior distribution of all unobservables is
p h; y
b
jg; y
c
; HðÞ/p gjy
b
; jðÞp yjhðÞp hjHðÞ
/ p gjy
b
; jðÞp yjk; b; u; c; R
0
ðÞp kjH
k
ðÞp bjH
b
ÀÁ
 p u jG
0
ðÞp G
0
jH
G
0
ðÞp c jD
0
ðÞp D
0
jH
D
0
ðÞp R
0
jH
R
0
ðÞ;
ð9Þ
where H represents the collection of all known hyper-parameters, and, for
example, pðbjH
b
Þ is the density of the prior distribution of b and H
b
is a
set of known hyper-parameters (i.e., mean b
0
and variance r
2
b
0
) that the distri-
bution of b depends on.
Bayesian structura l equation Gaussian-threshold model
337
2.4. Fully conditional posterior distributions
The fully conditional posterior distributions can be ascertained from (9) by
retaining the parts varying with the parameter or group of parameters of interest
and treating the remaining parts as known [21].
2.4.1. Liabilities
To obtain the fully conditional posterior distribution of t he liability variable
(y
i,b
)forthebth binary trait of the ith individual, terms in (9) that involve y
i,b
only are extracted, such that
py
i;b
jELSE
ÀÁ
/ I
i;b
 exp 1
2
Ky
i
À X
i
b À Z
i
u À W
i
cðÞ
0
&
 R
À1
0
Ky
i
À X
i
b À Z
i
u À W
i
cðÞ
'
;
ð10Þ
where I
i;b
¼ Iy
i;b
j
b
ÀÁ
I g
i;b
¼ 0
ÀÁ
þ Iy
i;b
> j
b
ÀÁ
I g
i;b
¼ 1
ÀÁ
for b ¼ t
1
þ 1;
:::; t
1
þ t
2
. Here, ELSE refers to data and to the values of all parameters that
the conditional distribution of the parameter of interest (y
i,b
) depends on.
Because the vector y
i
includes both liabilities and observations on continuous
traits for the ith individual, it can be partitioned as
y
i
¼
y
i;Àb
y
i;b
!
;
where y
i,–b
represents y
i
but excluding the liability y
i,b
. Similarly, X
i
, Z
i
, W
i
,
and K are partitioned conformably as
X
i
¼
X
i;Àb
x
0
i;b
; Z
i
¼
Z
i;Àb
z
0
i;b
; W
i
¼
W
i;Àb
w
0
i;b
; K ¼
K
Àb
k
0
b
;
where x
0
i;b
, z
0
i;b
, w
0
i;b
, and k
0
b
are row vectors. Removing x
0
i;b
, z
0
i;b
, w
0
i;b
, and k
0
b
from X
i
, Z
i
, W
i
, and K, respectively, leads to X
i,–b
, Z
i,–b
, W
i,–b
, and K
–b
. Like-
wise, the residual covariance matrix R
0
is partitioned into a component per-
taining to the bth binary trait (r
b,b
), vectors containing the covariance
components between the bth trait and all other traits (r
–b,b
and r
b,–b
), and
the residual covariance matrix of remaining traits (R
–b,–b
), as follows:
R
0
¼
R
Àb;Àb
r
Àb;b
r
b;Àb
r
b;b
:
338
X L. Wu et al.
By properties of multivariate Gaussian distributions, the fully conditional pos-
terior distribution of liability y
i,b
is
py
i;b
jELSE
ÀÁ
/ I
i;b
 N l
i;b
; r
2
i;b
; ð11Þ
where
l
i;b
¼
X
t
1
þt
2
b
0
6¼b
k
b;b
0
y
i;b
0
þ x
0
i;b
b þ z
0
i;b
u þ w
0
i;b
c
þ r
b;Àb
R
À1
Àb;Àb
K
Àb
y
i
À X
i;Àb
b À Z
i;Àb
u À W
i;Àb
cðÞ
ð12Þ
r
2
i;b
¼ r
b;b
À r
b;Àb
R
À1
Àb;Àb
r
0
b;Àb
: ð13Þ
Because I
i,b
indicates whether the liability falls below or above the threshold,
(11) represents the density of a normal distribution truncated at j
b
.
2.4.2. Location parameters
The joint conditional posterior di stribution o f location parameters is
b; u; cjELSE / exp À
1
2
X
n
i¼1
Ky
i
À X
i
b À Z
i
u À W
i
cðÞ
0
R
À1
0
Ky
i
À X
i
b À Z
i
u À W
i
cðÞ
()
 exp b À 1b
0
ðÞb À 1b
0
ðÞ
2b
2
 exp u
0
A G
0
ðÞ
À1
u
2
!
 exp c
0
I D
0
ðÞ
À1
c
2
!
:
ð14Þ
This expression can be recognized as the posterior density of the location
parameters in a Gaussian-linear model with proper priors and known disper-
sion components [21], such that the corresponding distribution is
b; u; cjELSE $ N
^
b
^
u
^
c
2
6
6
4
3
7
7
5
;
C
bb
C
bu
C
bc
C
ub
C
uu
C
uc
C
cb
C
cu
C
cc
2
6
6
4
3
7
7
5
À1
0
B
B
@
1
C
C
A
ð15Þ
Bayesian structura l equation Gaussian-threshold model
339
where
^
b
^
u
^
c
2
6
6
4
3
7
7
5
¼
C
bb
C
bu
C
bc
C
ub
C
uu
C
uc
C
cb
C
cu
C
cc
2
6
4
3
7
5
À1
X
0
ðI R
0
Þ
À1
y
Ã
þ b
0
1r
À2
b
0
Z
0
ðI R
0
Þ
À1
y
Ã
W
0
ðI D
0
Þ
À1
y
Ã
2
6
6
4
3
7
7
5
ð16Þ
C
bb
C
bu
C
bc
C
ub
C
uu
C
uc
C
cb
C
cu
C
cc
2
6
6
4
3
7
7
5
¼
X
0
ðI R
0
Þ
À1
X þ Ir
À2
b
0
X
0
ðI R
0
Þ
À1
ZX
0
ðI R
0
Þ
À1
W
Z
0
ðI R
0
Þ
À1
XZ
0
ðI R
0
Þ
À1
Z þðA G
0
Þ
À1
Z
0
ðI R
0
Þ
À1
W
W
0
ðI R
0
Þ
À1
XW
0
ðI R
0
Þ
À1
ZW
0
ðI R
0
Þ
À1
W þðI D
0
Þ
À1
2
6
6
6
6
4
3
7
7
7
7
5
ð17Þ
and yü Ky
1
ðÞ
0
Ky
2
ðÞ
0
::: Ky
n
ðÞ
0
ðÞ
0
is a pseudo-data vector.
2.4.3. Structural coefficients and dispersion parameters
The fully conditional distribution of k can be derived following Gianola and
Sorensen [10]andWuet al. [26]. Because it does not have a recognizable form,
a Metropolis-Hastings algorithm is used to sample k, centering the proposal at
their current values [26]. In recursive models (i.e., K is an upper- or lower -diag-
onal matrix), K
jj
¼ 1. Thus, the fully conditional distribution of k reduces to a
multivariate normal distribution, and a Gibbs sampler can be used to sample k.
The conditional posterior distribution of the genetic covariance matrix G
0
is
inverse W ishart [10]. The fully conditional posterior distribution of the matrix
D
0
takes a form similar to that of the genetic covariance matrix.
When there are binary characters, because the variance of the liabilities of
each binary character is fixed at 1, the residual covariance matrix R
0
is sampled
from a conditional inverse Wishart distribution [14].
2.5. Ordered categorical traits
For an ordered categorical character there are two o r more thresholds. If t he
first threshold is fixed, the other(s) have to be estimated. Note that h ¼
j; k; b; u; c; G
0
; D
0
; R
0
fg
,wherej is a vector containing all unknown thres-
holds. The joint posterior distribution p h; y
b
jg; y
c
; HðÞremains proportional to
(9) if a unif orm prior distribution is assigned to j. Thus, all unknown parameters
340
X L. Wu et al.
are treated the same as for the case of binary characters, but an extra step is
required to sample unknown thresholds during the MCMC steps. The fully con-
ditional posterior distributions of the thresholds are independent, each of which
is the collection of all relevant terms in (9). For example, consider the kth thres-
hold for the jth categorical trait. It appears i n connection w ith liabi lities c orre-
sponding to responses in either the kth category ( where the threshold is an
upper bound) or the (k + 1 )th category (where t he threshold is a lower bound).
This leads to the use o f a uniform process to sample unknown thresholds [21].
2.6. Markov chain Monte Carlo sampling
Bayesian analysis via an MCMC implementation is used to infer mar ginal
posterior distributions for parameters of interest. The MCMC sampling proce-
dure consists of iterating through the following loop, after initializing
parameters:
1a. Sample liabilities in y
b
;
1b. Sample thresholds in j;
2. Sample structural parameters in k, using either the Metropolis-Hastings
algorithm or a Gibbs sampler, and then update the ‘‘data’’ y
Ã
i
¼ Ky
i
;
3. Sample location parameters in b, u, and c;
4. Sample the genetic covariance matrix G
0
;
5. Sample the permanent environmental covariance D
0
;
6. Sample the residual covariance matrix R
0
.
Step 1b is required only when ordered categorical characters are involved.
2.7. Transformation from liability to observable scale
In the recursive Gaussian-threshold model, the recursive effects from the cat-
egorical character (e.g., d isease) to the Ga ussian trait (e.g., p roduction) are
inferred on the underlying scale (i.e., liability to mastitis). To make inter pretation
easier these effects should be converted to the observable scale. A straightfor-
ward approa ch for conversion is t he one of ‘‘inverse probability’’ [ 7,25]. Here,
we present an intuitive a pproach that measures the difference i n means of con-
tinuous traits (e.g., MY) between the two categories of a binary trait (e.g.,mas-
titic and healthy), given the realization o f underlying liabilities.
Denote
y
Ã
i
¼ kl
i
þ e
i
: ð18Þ
Here, y
Ã
i
represents adjusted production for individual i (adjusted for all
‘‘fixed’’ and random effects, except liability to the disease, l
i
), and e
i
is the
Bayesian structura l equation Gaussian-threshold model
341
residual term. Then, the difference between means of production between sick
(1) and healthy (0) cows can be calculated as
Á ¼ Ey
Ã
i
jl
i
> j
ÀÁ
À Ey
Ã
i
jl
i
j
ÀÁ
¼ k El
1
ðÞÀEl
0
ðÞ½%k
"
l
1
À
"
l
0
Þ;
À
ð19Þ
where
"
l
1
and
"
l
0
are averages of augmented liabilities for sick and healthy
cows, respectively, during the MCMC sampling.
2.8. Application to data from Norwegian Red cows
2.8.1. Data
The data represented 20 264 first-lactation daughters of 245 Norwegian Red
sires that had their first progeny test in 1991 and 1992, and included test-day
records for MY and veterinary records on clinical mastitis (CM) cases. Only
test-day records from 5 to 180 days after calving were included. Cows with
missing test-day records were excluded from the analysis for s implicity.
The 180 days of lactation were divided arbitrarily into three approximately
equal-length periods: from d ay 5 to 6 0 (period 1), f rom day 61 to 120 (period 2 ),
and from day 121 to 180 (period 3). For each period, cows were assigned the single
MY test-d ay record that was closest in time to the mid-point of that period. For each
test-day, a dummy variable indicating the presence or absence o f CM in the 15-day
period prior to t he test-day was created. A ccording to t his definition o f CM, a pre-
existing C M status would affect t he f ollowing test-day MY, but the reverse would
not occur.
Test-day MY decreased monotonically over the three lactation periods. The
mean (standard deviation) of test-day MY was 21.40 (4.12) kg, 20.95 (4.02) kg,
and 19.99 (4.00) kg at periods 1, 2, and 3, respectively. The presence or
absence o f CM was scored based on w h ether or not the cow had a CM treatment
in a 15-day per iod prior to the test-day: 1 if a cow wa s treat ed for m astitis in the
period and 0 otherwise. The incidence of CM decreased, approximately, from
3.0% at the first p eriod to 0.9% at the second and third periods.
2.8.2. Model specifications
The data were analyzed using a standard multivariate linear sire model (LM), a
recursive multivariate linear sire model (R-LM), a standard Gaussian-threshold
(GT) sire model, and a recursive Gaussian-threshold (R-GT) sire model. For
all models, it was assumed that correlations existed between sire effects as well
as between residual effects, and that age at first calving (AGE) and herd affected
342
X L. Wu et al.
all traits. AGE (‘‘fixed’’ effect) consisted of 15 classes with AGE < 20 months as
the first class, AGE > 32 months as the last class, and each month in-between rep-
resenting a single class. Herds, with 4903 classes, were treated as a random effect
in the models, with herd effects affecting MY assumed to be uncorrelated with
those affecting CM/liability to CM (LCM). In models R-LM and R-GT, the recur-
sive effects were defined in a lagged manner, such that: CM1/LCM1 ! MY1 !
CM2/LCM2 ! MY2 ! CM3/LCM3 ! MY3, where the number following
CM, LCM, and MY indicates the lactation period, and the arrow ! represents
a causal relationship.
2.8.3. Analysis of posterior samples
The a nalyses were carried out using the Si rBayes package (version 1.0),
which is freely available upon request to the senior author
(). A detailed description of the convergence analysis
can be found in Wu et al. [26]. Based on the conver gence diagnostics results,
it was decided t hat a single c hain of 100 000 iterations would be used. Posterior
samples f rom each chain were t hinned every 10 iterations after 1000 iterations of
burn-in. Genetic parameters were calculated for each thinned sample and saved
simultaneously with posterior samples of location and dispersion parameters.
Within-herd heritabilities (h
2
) were calculated a s
^
h
2
ðiÞ
¼
4Ãr
2
sðiÞ
r
2
eiðÞ
þr
2
sðiÞ
,wherer
2
eðiÞ
and r
2
sðiÞ
were drawn from the posterior distributions of the residual variance
and sire variance, respectively, at MCMC iteration i. (In case of recursive mod-
els, r
2
eðiÞ
and r
2
sðiÞ
are diagonal elements in m atrices K
À1
ðiÞ
R
0ðiÞ
K
0
À1
ðiÞ
and
K
À1
ðiÞ
G
0ðiÞ
K
0
À1
ðiÞ
, respectively. See Wu et al. [26] f or details.)
3. RESULTS
3.1. Recursive effects
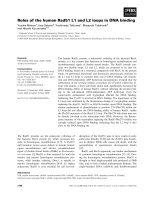
In the three lactation periods, all recursive effects from LCM/CM to MY had
negative posterior means, and those from MY to LCM/CM had positive means
(Tab. I). These results suggest that an inc reased incidence of (or liability to) CM
decreased MY at the following test-day, and that the effect from test-day MY to
CM/LCM in the n ext lactation p eriod would be weak. In model R-LM, all recur-
sive effects from CM to MY were considered significant, because their 95%
credible intervals did not overlap with zero. In model R-GT, however, only
the recursive effect from LCM1 to MY1 could be considered significant,
because the 95% credible intervals for the other two recursive effects included
zero (Fig. 1a).
Bayesian structura l equation Gaussian-threshold model
343
0.00
0.02
0.04
0.06
0.08
0.10
0.12
0.14
0.16
0.18
0.20
-0.068
-0.058
-0.048
-0.038
-0.028
-0.018
-0.008
0.002
0.013
0.023
0.033
Recursive effect from LCM to MY
Posterior density
LCM1->MY1
LCM2->MY2
LCM3->MY3
0.00
0.02
0.04
0.06
0.08
0.10
0.12
0.14
0.16
0.18
0.20
-0.009
-0.008
-0.007
-0.006
-0.005
-0.004
-0.003
-0.002
-0.001
0.000
0.001
0.002
0.003
0.004
0.005
0.006
0.007
0.008
0.009
0.010
0.011
Recursive effect from MY to LCM
Posterior density
MY1->LCM2
MY2->LCM3
a
b
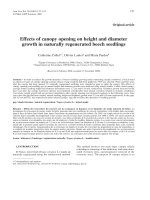
Figure 1. Posterior distributions of recursive effects: (a) from LCM to MY and
(b) from MY to LCM in lactation periods 1 (day 5 to 60), 2 (day 61 to 120), and 3
(day 121 to 180). The results were obtained from the recursive Gaussian-threshold
model (R-GT). LCM = liability to clinical mastitis; MY = test-day milk yield.
344 X L. Wu et al.
Estimated recursive effects from CM/LCM t o MY showed time-dependent
patterns based on both m odels: the effect was the strongest in the first lactation
period, and was reduced substantially in lactation periods 2 and 3. Based on
model R-LM, for example, the recursive e f fect from C M t o MY d ecreased from
À0.33 kg per d ay in lactation period 1 to À0.11 and À0.13 kg per day in lac-
tation periods 2 a nd 3. A similar trend was observed for the recursive ef fect from
LCM to MY u sing model R-GT, as illustrated in Figure 1a.
An increase of one unit of LCM in model R-GT, which is equal to 1 residual
standard deviation of liability, decreased test-day MY by 0.023 kg per day in
lactation period 1, and by À0.002 kg to À0.004 kg per day in lactation
periods 2 and 3. An increase in MY resulted i n a non-significant increase in
liability to CM in the following lactation p eriod (Fig. 1b). The posterior mean
of the effects from MY to LCM was between 0.001 and 0.002 liabi lity units
(Tab. I). These recursive effects obtained from model R-GT were converted to
the observable scale, and the difference in mean test-day MY between the
mastitic and healthy cows was À0.20 kg, À0.06 kg, and À0.09 kg per day,
respectively, in lactation periods 1, 2, and 3. Converted recursive effects from
LCM to MY based on model R -GT were small er in absolute value than their
counterparts based on model R-LM (i.e ., from À0.11 kg to À0.33 kg pe r
day), but both results pointed to the same direction, and they indicated the same
pattern of influence.
3.2. Heritability
The presence of recursive ef fects in the models did not influence point or
interval estimates of heritability for MY, a nd these estimates were also simil ar
when using the linear or the Gaussian-threshold models (Tab. II). The posterior
Table I. Posterior mean (standard deviation) of recursive effects between MY and CM/
LCM within 180 days of lactation of the first-lactation.
1,2
Recursive effects R-LM Recursive effects R-GT
CM1!MY1 À0.3324 (0.0312) LCM1!MY1 À0.0233 (0.0119)
MY1!CM2 0.0003 (0.0002) MY1!LCM2 0.0015 (0.0025)
CM2!MY2 À0.1107 (0.0508) LCM2!MY2 À0.0023 (0.0108)
MY2!CM3 0.0004 (0.0002) MY2!LCM3 0.0013 (0.0028)
CM3!MY3 À0.1284 (0.0619) LCM3!MY3 À0.0034 (0.0114)
1
CM1–3 = clinical mastitis, LCM1–3 = liability to CM, and MY1–3 = test-day milk yield,
where the numbers stand for lactation periods: 1 = day 5 to day 60 from calving, 2 = day 61 to
day 120 from calving, and 3 = day 121 to day 180 from calving.
2
R-LM = recursive multivariate linear model; R-GT = recursive Gaussian-threshold model.
Bayesian structura l equation Gaussian-threshold model
345
Table II. Posterior mean (standard deviation) of variance components for CM/LCM and MY in three periods of the first-lactation.
1,2,3
Model
Variance
CM1 LCM1 MY1 CM2 LCM2 MY2 CM3 LCM3 MY3
LM
^
r
2
s
< 0.001 (< 0.001) 0.395 (0.0477) < 0.001 (< 0.001) 0.458 (0.053) < 0.001 (< 0.001) 0.450 (0.051)
^
r
2
e
0.029 (< 0.001) 11.32 (0.116) 0.009 (< 0.001) 10.56 (0.106) 0.009 (< 0.001)
10.61 (0.105)
^
h
2
0.032 (0.007) 0.135 (0.016) 0.050 (0.013) 0.166 (0.018) 0.048 (0.012)
0.163 (0.018)
R-LM
^
r
2
s
< 0.001 (< 0.001) 0.395 (0.048) < 0.001 (< 0.001) 0.458 (0.053) < 0.001 (< 0.001)
0.450 (0.051)
^
r
2
e
0.029 (< 0.001) 11.32 (0.116) 0.009 (< 0.001) 10.56 (0.106) 0.009 (< 0.001)
10.61 (0.105)
^
h
2
0.032 (0.007) 0.135 (0.016) 0.050 (0.013) 0.166 (0.018) 0.048 (0.012)
0.163 (0.018)
GT
^
r
2
s
0.017 (0.003) 0.393 (0.048) 0.024 (0.003) 0.459 (0.053) 0.020 (0.003)
0.449 (0.051)
^r
2
e
1 (0)
11.33 (0.113)
1 (0)
10.56 (0.105)
1 (0) 10.61 (0.107)
^
h
2
0.067 (0.010) 0.134 (0.016) 0.093 (0.013) 0.167 (0.019) 0.079 (0.011)
0.162 (0.018)
R-GT
^
r
2
s
0.017 (0.003) 0.398 (0.048) 0.024 (0.003) 0.458 (0.053) 0.020 (0.003)
0.452 (0.051)
^
r
2
e
1 (0)
11.32 (0.115)
1 (0)
10.56 (0.106)
1 (0) 10.61 (0.105)
^
h
2
0.067 (0.010) 0.136 (0.016) 0.094 (0.013) 0.166 (0.018) 0.079 (0.011)
0.164 (0.018)
1
CM = clinical mastitis, LCM = liability to CM, and MY = test-day milk yield, where the numbers following CM, LCM, and MY stand for lactation
periods: 1 = day 5 to day 60, 2 = day 61 to day 120, and 3 = day 121 to day 180, respectively, from calving.
2
^
r
2
s
= estimated sire variance;
^
r
2
e
= estimated residual variance;
^
h
2
= estimated heritability.
3
LN = standard multivariate linear model; R-LN = recursive multivariate linear model; GT = standard Gaussian-threshold model; R-GT = recursive
Gaussian-threshold model.
346 X L. Wu et al.
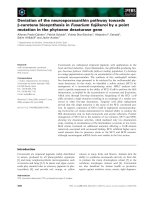
mean of within-herd heritability of test-day MY was 0.13–0.14 for MY1, and
0.16–0.17 for MY2 and MY3. The presence of recursive effects in the models
had only a sma ll effect on the estimate of h eritability of LCM/CM. However ,
0
0.05
0.1
0.15
0.2
0.25
0.3
0.05 0.1 0.15 0.2 0.25 0.3
Heritability
Posterior density
MY1
MY3
MY2
0
0.05
0.1
0.15
0.2
0.25
0.3
0.35
0.4
0 0.01 0.02 0.03 0.04 0.05 0.06 0.07 0.08 0.09 0.1 0.11 0.12 0.13 0.14 0.15 0.16 0.17
Heritability
Posterior density
LCM1
LCM2
LCM3
a
b
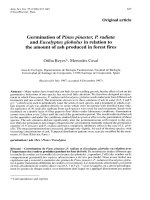
Figure 2. Posterior distributions of heritability of: (a) test-day milk yield (MY) and
(b) liability to clinical mastitis (LCM) in lactation periods 1 (day 5 to 60), 2 (day 61 to
120), and 3 (day 121 to 180). The results were obtained from the recursive Gaussian-
threshold model (R-GT).
Bayesian structura l equation Gaussian-threshold model
347
Table III. Posterior mean (standard deviation) of genetic correlations between MY and CM/LCM in three periods of the first-
lactation.
1,2
CM1 LCM1 MY1 CM2 LCM2 MY2 CM3 LCM3 MY3
CM1 LCM1 0.367 (0.105) 0.504 (0.074) 0.252 (0.105) 0.413 (0.036) 0.126 (0.107)
MY1 0.620 (0.096) 0.171 (0.097) 0.885 (0.0262) 0.020 (0.099) 0.789 (0.040)
CM2 LCM2 0.906 (0.034) 0.399 (0.087) 0.108 (0.097) 0.502 (0.012) 0.080 (0.098)
MY2 0.423 (0.087) 0.892 (0.026) 0.442 (0.081) 0.028 (0.098) 0.978 (0.008)
CM3 LCM3 0.834 (0.052) 0.062 (0.085) 0.930 (0.022) 0.095 (0.079) 0.082 (0.099)
MY3 0.312 (0.090) 0.791 (0.042) 0.144 (0.083) 0.976 (0.009) 0.169 (0.079)
1
Upper off-diagonal numbers represented genetic correlation (standard deviation) estimated from the recursive multivariate linear mode R-LM, and
lower off-diagonal numbers represented genetic correlation (standard deviation) from the recursive Gaussian-threshold model R-GT.
2
CM = clinical mastitis; LCM = liability to CM.
348 X L. Wu et al.
heritability estimates for LCM obtained from the two G aussian-t hreshold models
were considerably higher than those for CM from the two linear models. The
posterior means of h eritability of LCM were from 0 .07 to 0.09, whereas their
counterparts of CM varied from 0.03 to 0 .05 (Tab. II).
The posterior distributions of heritability of MY and LCM were unimodal and
approximately symmetric, as illustrated for the R-GT model in Figure 2.The
posterior means of herd variances were from 0.25 to 0.36 for MY, and from
0.07 to 0.09 for LCM.
3.3. Genetic and residual correlations
Genetic correlations between test-day MY were in good agreement between the
linear models and the Gaussian-threshold models (Tab. III). In general, test-day
0.0
0.1
0.2
0.3
0.4
0.5
0.6
0.7
0.8
0.9
1.0
0.58 0.63 0.68 0.73 0.78 0.83 0.88 0.93 0.98 1.00
Genetic correlation
Posterior density
MY1-MY3
MY1-MY2
MY2-MY3
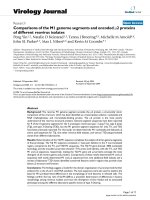
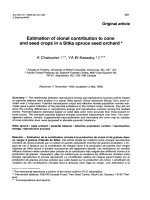
Figure 3. Posterior distributions of genetic correlations between test-day milk yield
(MY) in lactation periods 1 (day 5 to 60), 2 (day 61 to 120), and 3 (day 121 to 180).
The results were obtained from the Gaussian-threshold models with (solid-lines) or
without (dotted lines) the presence of recursive effects.
Bayesian structura l equation Gaussian-threshold model
349
MY in the three lactation periods were highly correlated; the posterior means of
genetic correlations between test-day MYs ranged from 0.79 to 0 .98. As expected,
the closer the test-days wer e, the hi gher the c orrelation between MYs w as. P oster-
ior distributions of genetic c orrelations between test-day MYs were highly over-
lapping between models with or without recursive e ffects ( Fig. 3).
0
0.1
0.2
0.3
0.4
0.5
0.6
0.7
0.8
0.9
0.58 0.63 0.68 0.73 0.78 0.83 0.88 0.93 0.98
Genetic correlation
Posterior density
LCM1-LCM3
LCM1-LCM2
LCM2-LCM3
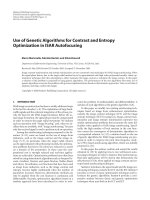
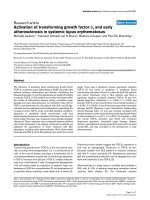
Figure 4. Posterior distributions of genetic correlations between liability to clinical
mastitis (LCM) in lactation periods 1 (day 5 to 60), 2 (day 61 to 120), and 3 (day 121
to 180). The results were obtained from the recursive Gaussian-threshold model
(R-GT).
350 X L. Wu et al.
Genetic correlations between LCM in the three lactation periods were also
high with the posterior means from the R-GT model ranging from 0.83 t o
0.93 (Tab. III). Genetic correlations between CM obtained from the recursive
linear models were smaller, ranging from 0.4 to 0 .5 (Tab. III). Nevertheless, pos-
terior distributions of genetic correlations between LCM or CM were highly
overlapping for the models with or without the presence of recursive effects.
Posterior distributions of genetic correlations between LCM from model
R-GT are shown in Figure 4.
Genetic correlations between LCM and M Y r anged from 0 .14 (LCM2-MY3)
to 0.62 (LC M 1-MY1), b ased on model R-GT. Genetic correlations between C M
and MY were slightly smaller, ranging from 0.08 (CM2-MY3) to 0.37
0
0.05
0.1
0.15
0.2
0.25
-0.13 -0.03 0.08 0.18 0.28 0.38 0.48 0.58 0.68 0.78 0.88 0.98
Genetic correlation
Posterior density
LCM1-MY3 LCM1-MY2
LCM1-MY1
Figure 5. Posterior distributions of genetic correlations between liability to clinical
mastitis in the first lactation period (LCM1) and test-day milk yields (MY) in the
three periods. The results wer e obtained from the Gaussian-threshold models with
(solid-line) or without (dotted lines) the presence of recursive effects.
Bayesian structura l equation Gaussian-threshold model
351
Table IV. Posterior mean (standard deviation) of residual correlations between MY and CM/LCM in three periods of the first-
lactation.
1,2
CM1 LCM1 MY1 CM2 LCM2 MY2 CM3 LCM3 MY3
CM1 LCM1 À0.070 (0.007) 0.253 (0.007) À0.003 (0.007) 0.180 (0.007) À0.025 (0.007)
MY1 À0.094 (0.007) 0.019 (0.007) 0.509 (0.005) 0.012 (0.007) 0.367 (0.006)
CM2 LCM2 0.448 (0.006) 0.027 (0.007) À0.011 (0.007) 0.270 (0.008) À0.014 (0.007)
MY2 À0.007 (0.007) 0.510 (0.005) À0.041 (0.007) À0.002 (0.007) 0.648 (0.004)
CM3 LCM3 0.355 (0.006) 0.042 (0.007) 0.593 (0.005) À0.006 (0.007) À0.018 (0.007)
MY3 À0.020 (0.007) 0.367 (0.006) À0.054 (0.007) 0.648 (0.004) À0.083 (0.007)
1
Upper off-diagonal numbers represented residual correlation (standard deviation) obtained from the recursive multivariate linear mode R-LN, and
lower off-diagonal numbers represented residual correlation (standard deviation) obtained from the recursive Gaussian-threshold model R-GT.
2
CM = clinical mastitis; LCM = liability to clinical mastitis.
352 X L. Wu et al.
(CM1-MY1) based on model R-LM. The presence of recursive effects changed
only slightly the posterior distributions of genetic correlations between LCM and
MY (Fig. 5). The same was true for the two linear models.
Residual correlations are given in Ta ble IV. Differences in residual correlations
between models with or without recursive eff ects were minor. The posterior mean
of residual correlations between test-day MYs was comparable between the two
types of m odels, r anging from 0.37 to 0 .65. The posterior means of r esidual c or -
relations between LCM we re from 0.355 (LCM1-LCM3) to 0.593 (LCM2-
LCM3) based on model R-GT, whereas their counterparts between CM varied
from 0 .180 (CM1-CM3) to 0.270 (MY2-MY3) b ased on model R-LM. Residual
correlations between LCM and MY were negative and close to zero (Tab. IV).
4. DISCUSSION
4.1. Estimation of recursive effects using Gaussian-threshold
vs. linear models
Many diseases are measured as categorical, rather than quantitative, traits and
often as binary response variables. The vast majority of these disease traits have a
polygenic basis. Thus, Wright [25] proposed a ‘‘physiological threshold’’ theory
to explain the link between a continuous latent variable, also referred to as ‘‘lia-
bility’’ [8], and an observable binary phenotype. The basic assumptions of a
threshold model are that: (1) there is an underlying variable whose value is the
sum of a normally distributed environmental component and an independent nor-
mally distributed genetic c omponent; ( 2) the ‘‘affected’’ character is present in
only t hose, in which the underlying variable exceeds a certain threshold value;
and (3) gene substitutions have individually small and stri ctly additive ef fe cts
on the underlying variable. A model in which additive action is at the level of
some underlying variable (liability scale) may be more sensible than one based
on additive g ene action on the outward variate (probability scale ). Concerning
heritability of a binary character, f or example, the use of a liability scale circum-
vents p roblems arising in the probability scale [7]. Biologically, the linear model
assumes a dichotomous (0 or 1) influence of CM whereas, by assuming a thres-
hold model, the effect of LCM on MY is continuous. Mastitis is a complex trait
that can be caused by many different pathogens and shows dif ferent infection pat-
terns, from mild to very severe clinical cases. It is thus more reasonable to believe
that MY is more affected by a severe mastitis than by a mild clinical case. For
cows observed as healthy (i.e., CM = 0) there may also be variation in ef fects
on MY, a s their health status may v ary from completely h ealthy to almost mastitic
(i.e., subclinical mastitis). Therefor e, a Ga ussian-thres hold model i s more
Bayesian structura l equation Gaussian-threshold model
353
preferable than a multivariate linear model to d escribe the relationship between
CM and MY.
In this paper, the model of G ianola and Sorensen [10] was extended to
describe relationships between Gaussian traits and liabili ties of binary traits.
Recursive effects from LCM to MY were estimated on the underlying scale
of disease (i.e., liability to mastitis) and converted to the probability s cale.
The conversion method measures the difference in mean MY between mastitic
and healthy cows, give n t he realized liabilities. Converted recursive effects from
the Gaussian-threshold model were smaller than those obtained from the linear
model. This probably reflects intrinsic differences between these two types of
models, i.e., the linear models produce frequency-dependent inferences [9].
Further , in the MCMC sampling, the chains for recursive effects in the linear
model did not mix a s well as they did in the Gaussian-threshold m odel, when
the incidence of disease w as low. Because CM and L CM have different herit-
abilities, it is also possible that recursive effects between CM and MY based
on model R-LM are dif ferent from t hose between LCM and MY based on m odel
R-GT. Nevertheless, both models led to the same conclusion, since recursive
effects from both models showed the same pattern and were in the same
direction.
At the phenotypic level, the influence of CM on production (e.g.,MY)has
been documented e.g. [19,22]. There is also evidence that high MY m ay
increase incidence of CM e.g. [16,17]. Using a SI R model, Wu et al. [26]found
positive recursive effects from MY to s omatic cell s core (SCS), and decreasing
effects from SCS to MY as lactation p roceeded. T hese results may r eflect a r ela-
tionship b etween CM incidence and the magnitude of the recursive effect to MY.
Incidence o f CM decreases as lactation progresses [1,3] , and so did the recursive
effect from CM to the following test-day MY, possibly because of reduced var-
iation. Both the recursive linear model and the recursive Gaussian-threshold
model s howed negative ef fects from (liability to) CM to M Y, and these effects
decreased from lactation period 1 to later periods.
4.2. Estimation of genetic parameters under recursive relationships
The presence of r ecursive effects in t he models did not af fect point or interval
estimates of heritability of LCM or MY. T his conclusion was in agreement with
previous studies, in which the estimates of heritability obtained assuming SIR
relationships [6,26] were s imilar to those from standard models. Estimated her-
itabilities for test-day MY were in agreement with previous reports in t he same
population [6]; estimated heritabilities for liability to CM were in agreement
with those of Chang et al.[5] for the same lactation periods, and slightly higher
354
X L. Wu et al.
than those of Heringstad et al.[11], who estimated heritability of CM in the
course of lactation in the same population using a longitudinal threshold model.
Wu et al.[26] found that estimates of some genetic and residual correlations
from SIR models could dif fer considerably from those obtained u sing standard
mixed models. I n the present analysis, however , similar e stimates of genetic and
residual correlations were found regardless of the presence of recursive ef fects in
the m odels. The observed difference in genetic correlations could be data driven.
However , there was a discrepancy between the linear models and the Gaussian-
threshold m odels in estimates of genetic and residual correlations involving
(liability to) CM.
Genetic correlations between (liabilities to) CM in the three lactation periods
were similar to some previous reports [5,11]. The positive, moderate to high,
genetic correlations between LCM/CM and M Y were in agreement w ith previ-
ous studies [4,12], and indicate the involvement of common genetic factors or
pathways in genetic expression and regulations of these two traits [13,20]. From
the viewpoint of genetic selection, the positive genetic correlations between lia-
bility to mastitis and MY are unfavorable, because selection for higher MY
would b e associated with an increased liability to CM . It is known that there
is an antagonistic genetic correlation between mastitis and m ilk production
e.g.[4,12] but knowledge is limited regarding how this association evolves in
the course of lactation. Thus, the present application represents an effort toward
obtaining a dynamic picture of these relationships.
ACKNOWLEDGEMENTS
Two anonymous reviewers and the associate editor are thanked for useful
comments. Dr. E. Lopez de Maturana is acknowledged for discussion on the
conversion of recursive effects from the liability to probability scales. Access
to the d ata w as given by the Norwegian D airy Herd Recording System i n a gree-
ment number 004.2005. This research was financially supported b y the Ba bcock
Institute for International Dairy Research and Development, University of
W isconsin-Madison, and by grants NRICGP/USDA 2003-35205-12833, NSF
DEB-0089742, and NSF DMS-044371.
REFERENCES
[1] Beaudeau F., Frankena K., Fourichon C., Seegers H., Faye B., Noordhuizen J.P.,
Association between health disorders of French dairy cows and early and late
culling decision making within the lactation, Prev. Vet. Med. 19 (1994) 213–
231.
Bayesian structura l equation Gaussian-threshold model
355
[2] Blake R.W., Considerations in multiple trait evaluation, J. Dairy Sci. 67 (1984)
1554–1566.
[3] Bunch K.J., Heneghan D.J.S., Hibbitt K.G., Rowlands G.J., Genetic influence
on clinical mastitis and its relationship with milk yield, season and stage of
lactation, Livest. Prod. Sci. 11 (1984) 91–104.
[4] Carle´n E., Strandberg E., Roth A., Genetic parameters for clinical mastitis,
somatic cell score, and production in the first three lactations of Swedish
Holstein cows, J. Dairy Sci. 87 (2004) 3062–3070.
[5] Chang Y M., Gianola D., Heringstad B., Klemetsdal G., Longitudinal analysis
of clinical mastitis at different stages of lactation in Norwegian cattle, Livest.
Prod. Sci. 88 (2004) 251–261.
[6] de los Campos G., Gi anola D., Heringstad B., A structura l equation model for
describing relationships between somatic cell count and milk yield in dairy
cattle, J. Dairy Sci. 89 (2006) 4445–4455.
[7] Dempster E.R., Lerner I.M., Heritability of threshold characters, Genetics 35
(1950) 212–236.
[8] Falconer D.S., Introduction to Quantitative Genetics, 2nd edn., Longman,
New York, 1981.
[9] Gianola D., Theory and analysis of threshold characters, J. Anim. Sci. 54 (1982)
1079–1096.
[10] Gianola D., Sorensen D., Quantitative genetic models for describing simulta-
neous and recursive relationships between phenotypes, Genetics 167 (2004)
1407–1424.
[11] Her ingstad B., Chang Y M., Gianola D., Klemetsdal G., Genetic analysis of
longitudinal trajectory of clinical mastitis in first-lactation Norwegian cattle,
J. Dairy Sci. 86 (2003) 2676–2683.
[12] Heringstad B., Chang Y M., Gianola D., Klemetsdal G., Genetic associations
between susceptibility to clinical mastitis and prote in yield in Norwegian dairy
cattle, J. Dairy Sci. 88 (2005) 1509–1514.
[13] Klungland H., Sabry A., Heringstad B., Olsen H.G., Gomez-Raya L., Vage
D.I., Olsaker I., Odegard J., Klemetsdal G., Schulman N., Vilkki J., Ruane J.,
Aasland M., Ronningen K., Lien S., Quantitative trait loci affecting clinical
mastitis and somatic cell count in dairy cattle, Mamm. Genome 12 (2001) 837–
842.
[14] Korsgaard I.R., Lund M.S., Sorensen D., Gianola D., Madsen P., Jensen J.,
Multivariate Bayesian analysis of Gaussian, right censored Gaussian, ordered
categorical and binary traits using Gibbs sampling, Genet. Sel. Evol. 35 (2003)
159–183.
[15] Lo´pez de Maturana E.L., Legarra A., Varona L., Ugarte E., Analysis of fertility
and dystopia in Holsteins using recursive models to handle censored and
categorical data, J. Dairy Sci. 90 (2007) 2012–2024.
[16] Myllys V., Rauthala H., Characterization of clinical mastitis in primiparous
heifers, J. Dairy Sci. 78 (1995) 538–545.
356 X L. Wu et al.
[17] Po¨so¨ J., Ma¨ntysaari E.A., Relationships between clinical mastitis, somatic cell
score, and production for the first three lactations of Finnish Ayrshire, J. Dairy
Sci. 79 (1996) 1284–1291.
[18] Quaas R.L., Garrick D.J., McElhenney W.H., Multiple trait prediction for a type
of model with heterogeneous genetic and residual covariance structures,
J. Anim. Sci. 67 (1989) 2529–2535.
[19] Schutz M.M., Genetic evaluation of somatic cell scores for United States dairy
cattle, J. Dairy Sci. 77 (1994) 2113–2129.
[20] Sharma B.S., Leyva I., Schenkel F., Karrow N.A., Association of toll-like
receptor 4 polymorphisms with somatic cell score and lactation persistency in
Holstein bulls, J. Dairy Sci. 89 (2006) 3626–3635.
[21] Sorensen D., Gianola D., Likelihood, Bayesian, and MCMC Methods in
Quantitative Genetics, Springer-Verlag, New York, 2002.
[22] Timms L.L., Schultz L.H., Mastitis therapy for cows with elevat ed somatic cell
counts or clinical mastitis, J. Dairy Sci. 67 (1984) 3 67–371.
[23] van Tassell C.P., van Vleck L.D., Gregory K.E., Bayesian analysis of tw inning
and ovulation rates using a multiple-trait threshold model and Gibbs sampling,
J. Anim. Sci. 76 (1998) 2048–2061.
[24] van Vleck L.D., Gregory K.E., Echternkamp S.E., Prediction of breeding values
for twinning rate and ovulation rate with a multiple trait, repeated records animal
model, J. Anim. Sci. 69 (1991) 3959–3966.
[25] Wright S., An analysis of variability in number of digits in an inbred strain of
Guinea pigs, Genetics 19 (1934) 506–536.
[26] Wu X L., Heringstad B., Chang Y M., de los Campos G., Gianola D., Inferring
relationships between somatic cell score and milk yield using simultaneous and
recursive models, J. Dairy Sci. 90 (2007) 3508–3521.
Bayesian structura l equation Gaussian-threshold model
357