Báo cáo sinh học: "Conservation priorities for Ethiopian sheep breeds combining threat status, breed merits and contributions to genetic diversity" potx
Bạn đang xem bản rút gọn của tài liệu. Xem và tải ngay bản đầy đủ của tài liệu tại đây (167.41 KB, 15 trang )
Original article
Conservation priorities for Ethiopian sheep
breeds combining threat status, breed merits
and contributions to genetic diversity
Solomon GIZAW
1,2
*
, Hans KOMEN
2
, Jack J. WINDIG
3,4
,
Olivier H
ANOTTE
5
, Johan A.M. VA N ARENDONK
2
1
Debre Birhan Agricultural Research Center, P.O. Box 112, Debre Birhan, Ethiopia
2
Animal Breeding and Genomics Centre, Wageningen University, P.O. Box 338,
6700 AH Wageningen, The Netherlands
3
Animal Breeding and Genomics Centre, Animal Sciences Group, Wageningen UR,
P.O. Box 65, 8200 AB Lelystad, The Netherlands
4
Centre for Genetic Resources, The Netherlands (CGN) Wageningen UR, P.O. Box 65,
8200 AB Lelystad, The Netherlands
5
International Livestock Research Institute, P.O. Box 30709, Nairobi, Kenya
(Received 5 September 2007; accepted 22 January 2008)
Abstract – Prioritizing livestock breeds for conservation needs to incorporate both genetic
and non-genetic aspects important for the survival of the breeds. Here, we apply a
maximum-utility-strategy to prioritize 14 traditional Ethiopian sheep breeds based on
their threat status, contributions to farmer livelihoods (current breed merits) and
contributions to genetic diversity. Contributions of the breeds to genetic diversity were
quantified using Eding’s marker-estimated kinship approaches. Non-genetic aspects
included threats (e.g. low population size, low preferences by farmers) and current merits
(economic, ecological and cultural merits). Threat analysis identified eight of the 14 breeds
as threatened. Analysis of current merits showed that sub-alpine and arid-lowland breeds
contribute most to farmer livelihoods in comparison to other breeds. The highest
contribution to the genetic diversity conserved was from the Simien breed. Simien showed
high between-breed (low between-breed kinship = 0.04) as well as high within-breed
diversity (low within-breed kinship = 0.09 and high H
E
= 0.73 and allelic richness =
6.83). We combined the results on threat status, current breed merits and contributions to
genetic diversity to produce a ranking of the 14 breeds for conservation purposes. Our
results balance the trade-offs between conserving breeds as insurance against future
uncertainties and current sustainable utilization. The ranking of breeds provides a basis
for conservation strategies for Ethiopian sheep and contributes to a regional or global
conservation plan.
conservation / sheep / diversity / threat status / breed merit
*
Corresponding author:
Genet. Sel. Evol. 40 (2008) 433–447
Ó INRA, EDP Sciences, 2008
DOI: 10.1051/gse:2008012
Available online at:
www.gse-journal.org
Article published by EDP Sciences
1. INTRODUCTION
The primary objective of livestock conservation for developing countries is
conservation for sustainable use [22,25]. Conservation is not only about endan-
gered breeds but also about those that are not being utilized efficiently [1]. Con-
servation aims of farm animal genetic resources range from avoiding extinction,
maintaining genetic diversity and/or the c ultural, ecological or socio-economic
values of breeds, to providing the right conditions for their evolution within
an evolving production s ystem [ 14].
Because of resource limitations, priorities need to be set on which population/
breed is to be conserved. Commonly, the contribution of a breed to total genetic
diversity has been analyzed using phylogenetic methods b ased on genetic
distances between breeds [5,20,24,27]usingtheWeitzman[28] approach.
However, Caballero and Toro [4] showed that conservation decisions based
on genetic distances can be misleading when applied to subpopulations of a
metapopulation, since it ignores the within-population variability component.
W ithin-population variability constitutes a crucial part of the metapopulation
variability and is highly relevant for conservation strategies because of its impact
on adaptive and economic traits. An approach based o n marker-estimated aver-
age kinship betwe en a nd wi thin populations has recently been suggested [ 4,7].
Both approaches described above ignore non-genetic factors such as the
cultural, economic and ecological values or merits of the breeds. However,
the human socio-political context needs to be fully understood for conservation
priorities to have any impact on human livelihoods [19]. Ruane [22] proposed a
framework that incorporates both genetic diversity and non-genetic criteria for
prioritizing breeds at the national level. H owever, applications of this framework
are lacking and conservation priorities have largely been based solely on contri-
butions of breeds t o genetic diversity.
Twelve percent of sheep breeds known worldwide have already become
extinct in the last 100 years [16]. Sheep resources of Ethiop i a are not well stud-
ied a nd there is practically no rational conservation-based improvement plan in
the c ountry. With 18 million sheep [6] and 14 traditionally recognized breeds
[15], Ethiopia possesses highly diversified and adapted indigenous sheep popu-
lations parallel to its highly diverse agro-ecology, ethnic c ommunities a nd pro-
duction systems [13]. However, changes in production systems, i n response to
socio-economic factors, have led to the use o f exotic germplasm, end angering
the survival of the adapted indigenous breeds. Besides, population sizes and
flock structures of some populations are currently not commensurate with opti-
mal genetic resource management levels.
434
S. Gizaw et al.
In this paper , we assess the threat status and contributions to farmer liveli-
hoods (current breed merits) and genetic diversity of 14 traditionally recognized
Ethiopian sheep breeds. We rank the 14 sheep breeds for conservation purposes
adapting the conceptual frameworks of Ruane [22] and Simianer et al. [24]. Our
results can be used in defining conservation priorities at the n ational level and
can contribute to a regional or global conservation plan.
2. MATERIALS AND METHODS
2.1. Breeds and genotyping
Fourteen Ethiopian sheep populations are traditionally recognized as she ep
breeds. Microsatellite DNA-based analysis revealed that some breeds could
not be separated at the genetic l evel, resulting in s ix genetically distinct breed
groups [15]. In Table I breeds and breed groups are listed together with some
basic statistics. We ran t wo pr eliminary a nalyses u sing the s ix breed groups or
the 14 traditional breeds. Ranking of breeds (based on their contribution to
Table I. Traditional breeds, breed groups, ecology, sample size, expected heterozy-
gosity (H
E
) and allelic richness.
Traditional breeds Breed groups Ecology H
E
Allelic richness
Farta
1
Short-fat-tailed Sub-alpine 0.746 7.116
Menz
1
Short-fat-tailed Sub-alpine 0.723 6.711
Sekota
1
Short-fat-tailed Sub-alpine 0.726 7.102
Simien
2
Short-fat-tailed Sub-alpine 0.728 6.830
Tikur
1
Short-fat-tailed Sub-alpine 0.738 6.455
Wollo
1
Short-fat-tailed Sub-alpine 0.729 7.193
Afar
1
Fat-rumped Arid-lowland 0.743 7.508
BHS
2,3
Fat-rumped Arid-lowland 0.682 6.597
Adilo
1
Long-fat-tailed Wet-highland 0.696 6.399
Arsi-Bale
1
Long-fat-tailed Wet-highland 0.676 6.589
Horro
2
Long-fat-tailed Wet-highland 0.658 6.205
Bonga Bonga Wet-highland 0.669 5.869
Gumz Thin-tailed Sub-humid lowland 0.728 7.133
Washera Washera Wet-highland 0.719 7.404
1,2
Within-breed groups, traditional breeds with different superscripts are genetically distinct
using microsatellite markers [15].
3
BHS: Black-head-Somali.
Conservation priorities for Ethiopian sheep
435
genetic diversity) obtained from the two analyses was similar. The results
reported here are from the analysis of the 14 traditional breeds. This analysis
was chosen since data collected on non-genetic criteria (indicators of threat sta-
tus and breed meri ts) used in a priority setting were specific to the 14 traditional
breeds, which d iffer f or mos t of the criteria.
Forty-eight animals from each of the 14 breeds were genotyped at 17 recom-
mended [12] microsatellite loci: MAF214, MAF209, ILSTS011, MCM527,
OARFCB11, DYMS1, BM8125, OARCB226, ILSTS44, OARVH72, MCM42,
ILSTS005, TGLA53, OARFCB20, OARFCB304, OARJMP29 and SRCRSP9.
DNA was extracted from peripheral blood lymphocytes preserved in urea
according to standard procedures [ 23]. Polymerase chain reaction (PCR) ampli-
fications were carried out and the PCR products were analyzed by capillary elec-
trophoresis using ABI Prism genotyper and LIZ 500 internal size standard
(Applied Biosystems). The data were collected and analyzed using the
GeneMapper
TM
software with the third order least-squares allele size calling
method.
2.2. Non-genetic criteria
2.2.1. Threat status
Threat status was assessed u sing five indicators adapted from the Food and
Agriculture Organization of the United Nations (FAO) recommended list [ 11]:
(1) population size extracted from Central St atistical Authority (CSA) [6]based
on the geographic distribution o f b reeds, (2) average number of r ams p er flock
based on 12–28 flocks per breed, (3) indiscriminate crossbreeding, (4) m ainte-
nance of pure stock and ( 5) farmers’ opinion towards their breed. For the fifth
indicator , key informant farmers scored their b reeds from 1 (po or) to 4 (excel-
lent) u sing growth, meat quality, fertility, prolificacy and market value as sepa-
rate criteria. The scores presented here are averages over all the traits. We
assumed that b reeds have a higher likelihood of being r eplaced when farmers
assign a low value/score to their breed. In order to rank breeds on threat status,
relative extinction probabilities were estimated by adapting the approach of
Reist-Marti et al. [20]. To ca lculate extinction probabilities, values between 0
(no effect on threat) and 0.3 (high effect on threat) f or threat indicators 1–3 or
between 0 and 0.1 for indicators 4–5 were assigned: (1) if population size
> 100 000 = 0.0 and < 100 000 = 0.3; (2) if average number o f rams p er flock
! 1 = 0.0, 0.5–0.9 = 0.1, 0.25–0.49 = 0.2 and 0–0.24 = 0.3; (3) if level of indis-
criminate crossbreeding is very high = 0.3, high = 0.2, low = 0.1 and none = 0.0;
(4) pure stock maintained = 0.0, partially maintained = 0.05 and not maintained
= 0.1; and (5) f armers’ opinion score 2–2.9 = 0.1 and 3–4 = 0.0. Three times
436
S. Gizaw et al.
higher weight was a ttached to ind i cators 1–3 because of their larger impact on
the survival of breeds. Exti nction probability (z) for each breed was computed as
the sum of the values. Breeds with very low extinction probability ( 0.2) were
considered relatively s afe o r not threatened.
2.2.2. Breed merit
Breed merits include economic or production, ecological and socio-cultural
values of breeds [1]. The ranking of the breeds according to their merits was
based on t he conceptual framework of Ruane [ 22]. The 14 breeds w ere s cored
for their current economic, ecological and socio-cultural merits by one of us
(Solomon Gizaw) based on discussion with farmers a nd development experts,
field observations and literature review. Average breed merit (W) for each breed
was subsequently calculated b y averaging the scores over a ll merits (economic,
ecological and cultural m erits).
Economic merits of breeds were scored based on their relative c ontributions
to farm livelihoods and domestic and export market shares, which were assumed
to reflect special traits such as quality of product. Breeds with r elatively high
importance to the farm economy (where cropping is unreliable and sheep pro-
duction is a primary or sole enterprise) and contributing to domestic or export
market were considered of ‘very high’ economic merit (score = 0.4). Those
highly important to farm economy but not contributing to the national or export
markets were rated as ‘highly’ important (score = 0.3). Breeds relatively less
important to farm economy (located in high agricultural potential and cash crop
area) but contributing t o either the national or export market were of ‘medium’
merit (score = 0.2). The rest were scored as 0.1.
Ecological values reflect adaptive c haracters of the breeds. A high ( 0.3) or
medium score ( 0.2) was assigned to breeds t hat i nhabit m ar ginal e nvironments
(arid, mountainous or degr aded landscapes) to which the adapted sheep popula-
tion could contribute to the human and environmental w elfare. Breeds i n stable
ecologies were given a ‘low’ score (0.1).
Cultural v a lues were defined b y the degree of the t raditional association of a
community to a particular sheep breed and contribution of the breed to socio-
cultural functions and r ituals. A ccordingly s cores from 0 .4 (very high) to 0.1
(low) were given.
2.3. Genetic criteria
The contribution of t he breeds to genetic diversity was analyzed using the
Eding and Meuwissen [7] app roach. Eding diversity is based on f
ij
, the coefficient
Conservation priorities for Ethiopian sheep
437
of marker-estimated kinship between individuals i and j. A high kinship implies
low genetic differ entiation and diversit y. f
ij
at each locus was calculated as
f
ij
¼
S
ij
À s
1 À s
;
where S
ij
is the similarity between i and j based on alleles being alike-in-state
and s is the probability of the two alleles being alike-in-state but not identical
by descent. Estimation of f
ij
and s can be done because f
ij
is constant over loci
but not over combinations of individuals, while s differs between loci but is
constant over populations. We used the Weighted Log-Linear Model [8]to
estimate kinship coefficients where each similarity score per locus was
weighted by the expected variance of the similarity score which results in
more informative markers having a larger influence on the solutions of both
f and s. The final f
ij
was the average over the 17 loci typed. Within- and
between-breed kinships were computed by averaging the corresponding
values for all the within or between population pairs of individuals.
The total diversity of the set of breeds was estimated by determining optimal
contributions. Optimal contributions of breeds are derived in such a way that the
average kinship in the core set is minimal, and thus the genetic diversity m ax-
imal. This results in a core set C
cor
, which is a mixture of populations such that
‘‘genetic overlap’’ is minimized, and the c omplete genetic diversity represented
[9]. Negative contributions to the core set can occur, but have no practical rel-
evance. We followed Eding et al. [9] and fixed the most negative contribution to
0 and resolved the optimal contributions for the remaining breeds. This was
repeated until all b reeds h ad a contribution greater than or equal to zero.
A safe s et of breeds was formed of populations with an estimated extinction
probability of 0.2 or less, following Eding et al. [9]. Gain in diversity (additional
diversity) from conserving an extra breed in addition to t he safe set ( Safe set
+ 1) was calculated a s [V(Safe + 1)/V(Safe)] À 1, where V is diversity conserved,
following the European Cattle Genetic Diversity Consortium a pproach [10].
2.4. Conservation priorities
In this study, we assumed a s the conservation objective, sustainable contribu-
tions of breeds to current farm liveliho ods and insurance aga inst an uncertain
future. We us ed a simplified approach to rank breeds on their total u tility b y
adapting the conceptual framework of Simianer et al.[24]. The total utility of
breed i (U
i
) was estimated as
U
i
¼ 2 z
i
à D
i
ðÞþW
i
;
438
S. Gizaw et al.
where z
i
is the extinction probability and D
i
is the partial contribution of
breed i to the Eding core set [9]. D
i
is the Weitzman [28] marginal diversity
in Simianer et al.[24]. Marginal diversities have to be known only to propor-
tionality [3] for the purpose of ranking breeds and correlation between partial
contributions and marginal diversities is very high, r = 0.9–0.98 [3,23]. W
i
is
the current merit of breed i. The ‘conservation potential’ (z
i *
D
i
) is the possi-
ble increase in expected diversity if an endangered breed i was made com-
pletely safe. The conservation potential has been used to rank breeds when
the objective is to conserve diversity per se [2,24].
3. RESULTS
3.1. Threat status and breed merits
The results on indicators of threat status and breed merits are presented in
Table II. The relative extinction probabilities, calculated using indicators of
threat status, indicate that Arsi-Bale, Black-head-Somali (BHS), Afar , Horro,
Washera and Sekota could b e considered relatively safe (designated Safe set)
with extinction probabilities of 0.2 or less. Economic merit of arid-lowland
breeds, most of sub-alpine breeds, Horro, Arsi-Bale, and Washera is very high.
Sub-alpine breeds and lowland breeds (BHS, Afar and Gumz) have relatively
high ecological values.
3.2. Contributions to genetic diversity
The coefficients of kinship are presented in Table S1 (see online version).
W ithin-bree d coefficients of kinship varied from 0.09 in the Simien sheep to
0.18 in Bonga and B H S. Higher within-breed kinship coefficients correspon ded
to lower within-breed genetic diversity (expected heterozygosity and allelic rich-
ness, Tab. I). Between breeds, BH S and Afar are the most related breeds with a
kinship coefficient of 0.121, while Simien and Bonga are the most distant
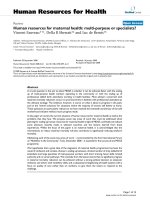
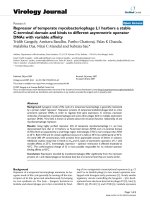
(f = 0.0). Plotting coefficients of kinship (Fig. 1) revealed a pattern of population
structure. Breeds within t he major breed groups (Tab. I) s howed closer kinship
with breeds in t he group than w i th breeds outside of the group (Fig. 1).
The contribution of b reeds t o the core set from the full set of breeds i s p re-
sented in Table III. S imien constituted n early half of the core s et (46.92%), fol-
lowed by Bonga, Afar, Gumz and Washera. The estimated loss of diversity from
maintaining only the Safe set was 2.37% (Tab. III). The additional gain in diver-
sity from adding one non-safe breed to the safe set ranged from 1.37% (Simien)
to 0.0% (Adilo). Simien, B onga and Gumz were the largest contributors.
Conservation priorities for Ethiopian sheep
439
Table II. Indicators of threat status (population size, average number of rams per flock, degree of indiscriminate crossbreeding,
maintenance of pure stocks ex situ and farmers’ opinion) and current breed merits for Ethiopian sheep breeds.
Breed Indicators for threat status
1
Breed merits
Population
(‘000)
Number
of rams
Cross-
breeding
Pure
stock
Farmer
assessment
2
Economic
merit
Cultural
value
Ecological
value
Farta 555.6 0.27 +++ – 3.50 +++ ++ +++
Menz 971.4 1.45 ++++ ++++ 2.80 ++++ ++++ ++++
Sekota 732.3 1.00 – – 3.17 + ++ ++++
Simien 347.6 0.25 – – 3.33 +++ +++ ++++
Tikur 525.3 1.00 + – 2.17 +++ +++ ++++
Wollo 1395.9 1.20 ++++ – 2.50 ++++ +++ +++
Afar 681.9 – + 3.17 ++++ ++++ ++++
BHS 906.2 8.47 – ++++ 2.83 ++++ ++++ ++++
Adilo 407.7 0.09 – – 3.50 ++ ++ +
Arsi-Bale 6345.1 1.07 – – 3.50 ++++ +++ +
Horro 3409.3 0.34 – ++++ 3.60 ++++ +++ +
Bonga 517.5 0.07 – – 3.83 +++ + +
Gumz 50.9 0.70 ++++ – 2.50 + ++ ++++
Washera 1227.7 – – 4.00 ++++ +++ +
1
The following scale is used: – none, + low, ++ medium, +++ high, ++++ very high.
2
Farmers scored their breeds on a scale of 1 (poor) to 4 (excellent) using growth, meat quality, fertility, prolificacy and market value as separate
criteria. Values given are scores averaged over traits.
440 S. Gizaw et al.
3.3. Conservation priorities
Ranking of the 14 breeds based on their total utility combining their threat sta-
tus, current merits and contributions to genetic diversity i s presented in Table IV.
The highest five priority breeds were Simien, Gumz, Afar, Menz and BHS in
ranking order.
4. DISCUSSION
In this study, we ranked 14 traditional sheep breeds of Ethiopia for conserva-
tion purposes. Earlier studies, except Ruane [22] and Reist-Marti et al.[21],
have prior itized breeds b ased solely on their c ontributions to genetic diversity
e.g.[5,17,26]. Here, we a ppli ed a maximum-utility-strategy [3] by combining
threat statuses, current breed merits and contributions to genetic diversity. The
results s how t h at the relative conservation p ri orities for Ethiopian sheep breeds
Bonga
Adilo
Arsi
Horro
Gumz
Washera
Menz
Sekota
Tikur
Farta
Wollo
Simien
Afar
BHS
Bonga
Adilo
Arsi
Horro
Gumz
Washera
Menz
Sekota
Tikur
Farta
Wollo
Simien
Afar
BHS
0,16-0,2
0,12-0,16
0,08-0,12
0,04-0,08
0-0,04
Figure 1. Contour plot of within- and between-breed kinsh ips. Kinships are
estimated based on microsatellite markers following Eding et al.[9]. Low kinship
implies high genetic diversity. Populations within the same breed group (Tab. I)
clustered together within the same range of kinship coefficients.
Conservation priorities for Ethiopian sheep
441
change when they are ranked based on their c ontributions to genetic d iversity
alone or on their t ot al utilit y.
Eding’s core set approach [8] gives highest priority to the conservation of
breeds with lowest average kinship between individuals within (highest
within-breed diversity) and across breeds (highest between-breed diversity). In
the current study, the highest contribution to Eding’s core set of breeds was
made by Simien sheep. Simien is well differentiated from other breeds and
has high w ithin-breed diversity (lowest within-breed kinship, high heterozygos-
ity and high a llelic richness). Si milar results have been reported for Portuguese
cattle [17].
Maximum genetic diversity is conserved by m aintaining individuals or breeds
with minimum genetic relationships. An earlier study on the degree of genetic
differentiation, relationships and population genetic structure based on
Table III. Eding et al. [9] total diversity
1
conserved from the full set of breeds and
contribution of each breed to the core set C
cor
; contribution of a non-safe breed to the
diversity in Safe + 1 set (C
s+i
), diversity conserved from the Safe set of breeds
2
or the
Safe set plus one additional non-sa fe breed V(S + i) with the corresponding percentage
gain in additional diversity from the extra non-safe breed (Gain%).
Breed (i) Threat status Full set Safe set + 1
C
cor
C
s+i
V(S + i) Gain (%)
0.9286
1
0.9066
2
À2.37
3
Farta Non-safe 0.0000 0.4280 0.9106 0.44
Menz Non-safe 0.0000 0.1143 0.9078 0.13
Sekota Safe 0.0000
Simien Non-safe 0.4355 0.5289 0.9190 1.37
Tikur Non-safe 0.0000 0.2357 0.9107 0.45
Wollo Non-safe 0.0000 0.2149 0.9092 0.29
Afar Safe 0.1291
BHS Safe 0.0000
Adilo Non-safe 0.0000 0.0000 0.9051 0.00
Arsi-Bale Safe 0.0000
Horro Safe 0.0000
Bonga Non-safe 0.1774 0.2444 0.9146 0.88
Gumz Non-safe 0.1170 0.3333 0.9147 0.89
Washera Safe 0.0696
1
Eding total genetic diversity in the core set calculated as 1 À f
cs
, where f
cs
is the average
kinship in the core set.
2
Diversity conserved from the Safe set of breeds.
3
Gain relative to the full set.
442 S. Gizaw et al.
Nei et al.[18] genetic distances and F-statistics among the 14 populations
studied here revealed that Ethiopian sheep could be classified into six breed
groups and nine breeds [15]. The c urrent analysis based on k inship coefficients
(Fig. 1) a nd the earlier study on the genetic structure of t he same populations
[15] indicate that some of the traditional breeds within the six breed groups
(Tab. I) cannot b e g enetically distinguished. The core set method is robust in
such a situation s ince it excludes individuals/breeds that have high kinship val-
ues with other individuals/breeds in the set [ 8]. This is illustrated in our results;
the five breeds that contributed to the core set represent each of five breed
groups, w ith the rest o f the breeds within each group having zero contribution.
The sixth group (Horro/Adilo/Arsi-Bale) did not contribute to the core set. They
have high kinship with other breeds in the core set (Bonga, Gumz a nd Washera).
They also have higher wit hin-breed kinship coefficients (0.14–0.17) compared
Table IV. Relative conservation priorities for Ethiopian sheep breeds based on
contributions to Eding core set diversity, extinction probability and over all breed
merits.
Breed Contribution
to diversity
1
Extinction
probability
2
Average
breed merit
3
Total
utility
4
Conservation
priority
Farta 0.0000 0.50 0.27 0.27 10
Menz 0.0000 0.40 0.40 0.40 4
Sekota 0.0000 0.10 0.23 0.23 13
Simien 0.4355 0.30 0.33 0.60 1
Tikur 0.0000 0.30 0.33 0.33 8
Wollo 0.0000 0.50 0.33 0.33 7
Afar 0.1291 0.05 0.40 0.41 3
BHS 0.0000 0.10 0.40 0.40 5
Adilo 0.0000 0.40 0.17 0.17 14
Arsi-Bale 0.0000 0.10 0.27 0.27 12
Horro 0.0000 0.20 0.27 0.27 11
Bonga 0.1774 0.40 0.20 0.34 6
Gumz 0.1170 0.90 0.23 0.44 2
Washera 0.0696 0.10 0.27 0.28 9
1
Contribution to Eding core set diversity was taken from C
cor
in Table III.
2
Extinction probabilities were calculated based on indicators of threat status (Tab. II)as
described in the text.
3
Average breed merits were calculated as average of economic, ecological and socio-cultural
merits (Tab. II) as described in the text.
4
Total utility of a breed was calculated as the sum of twice its ‘conservation potential’ (product
of extinction probability and marginal diversity) and its average merit.
Conservation priorities for Ethiopian sheep
443
to breeds contributing to the core set. These findings support the idea that
Eding’s approach disfavors inbred populations or those with low within-breed
diversity.
When breeds a re ranked based on their t otal utility (Tab. IV), two of the five
breeds that constitute E ding’s core set based o n t heir contributions to genetic
diversity (Tab. III) a re excluded from the five highest ranking breeds. The two
excluded breeds (Bonga and Washera) have lower total u tility value b ecause of
either lower extinction probabilities or lower average breed merits. O n the con-
trary, the two breeds (Menz and BHS) that replace Bonga and Washera have
higher average breed merit values although they do not contribute to the total
genetic diversity conserved. Conservation of the five breeds with highest total
utility would still conserve 73.4% of the genetic diversity in Ethiopian sheep
(Eding diversity). The r eduction in the total genetic diversity conserved when
considering current breed merits in this study is higher than that r eported f or Afri-
can cattle breeds [21], where only 0.5% of the diversity conserved (disregarding
breeds with special merits) would be lost when breeds w ith special merits were
favored for conservation. Inclusion of t he sixth highest ranking breed (Bonga)
would conserve most of the genetic diversity (92.5%). These six breeds are also
economically, ecologically and culturally the most important breeds of Ethiopia.
Ruane [22] suggests that t he primary criterion for conservation priorities s hould
be the degree of endangerment ( maximum-risk-strategy). T he six breeds with
highest tota l utility value in this study exclude some of the eight non-safe breeds
(Tab. III). This is because some of the excluded non-safe breeds ( e.g. Wollo and
Farta) are genetically overlapping, as discussed above, with the high ranking
Simien breed. Breeds wi th a high probability of extinction will not necessarily
have the highest priority for conservation, since their contribution to d iversity will
depend on whether there are other closely related breeds [1].
Consideration of current breed merits and threat s tatus, in addition to n eutral
genetic diversity, enabled us to balance the trade-offs between conserving diver -
sity as insurance against future uncertainties a nd current sustainable utilization.
There has been very limited r esearch [21,24] on optimally combi ning measures
of neutral diversity and br eed merits in order to rank breeds on their total uti lity.
The s implified approach adopted in this study with an arbitrary twofold weight
on neutral diversity provided a working ranking of the breeds studied. A concep-
tual framework for a maximum utility through a w eighted summation o f mea-
sures of neutral diversity and breed merits suggested by Simianer et al.[24]
merits consideration. However , currently there is no obvious way of obtaining
weights such as r elative economic values of neutral diversity [3].
The ranking of breeds provided h ere could b e u sed to d efine conservation
priorities for Ethiopian sheep and c ould contribute t o a regional or global
444
S. Gizaw et al.
conservation plan. Recommended conservation measures could include support-
ing genetic improvement programs to increase market competitiveness of indig-
enous breeds of lower productivity and stratification of production zones to
avoid indiscriminate crossbreeding (e.g. sub-alpine breeds). For breeds threa-
tened by erosion of within-breed variation (e.g. Bonga), within-breed genetic
management (such as circular mating scheme and restocking of breeding r ams)
aimed to reduce inbreeding rates c ould be r ecommended.
ONLINE MATERIAL
The supplementary file (Tab. S1) supplied by the authors is available at
.
Table S1: Marker-based within- and between-breed coefficients of kinship
estimated using weighted log-linear model [8].
ACKNOWLEDGEMENTS
This project is funded by The Netherlands Foundation f or the Advancement
of Tropical Research (WOTRO). The project is a collaboration between
Wageningen Universi ty and the International Livestock Research Institute
(ILRI).
REFERENCES
[1] Barker J.S.F., Conservation and management of genetic diversity: a domestic
animal perspective, Can. J. Forest Res. 31 (2001) 588–595.
[2] Bennewitz J., Kantanen J., Tapio I., Meng Hua Li M.H., Kalm E., Vilkki J.,
Ammosov I., Ivanova Z., Kiselyova T., Popov R., Meuwissen T.H.E., Estima-
tion of breed contributions to present and future genetic diversity of 44 North
Eurasian cattle breeds using core set diversity measures, Genet. Sel. Evol. 38
(2006) 201–220.
[3] Bennewitz J., Eding H., Ruane J., Simianer H., Selection of breeds for con-
servation, in: Oldenbroek K. (Ed.), Utilization and Conservation of Farm
Animal Genetic Resources, Wageningen Academic Publishers, Wageningen,
The Netherlands, 2007.
[4] Caballero A., Toro M.A., Analysis of genetic diversity for the management of
conserved subdivided populations, Conserv. Genet. 3 (2002) 289–299.
[5] Can˜o´n J., Alexanderino P., Bessa I., Carleos C., Carretero Y., Dunner S., Ferran N.,
Garcia D., Jordana J., Laloe¨ D., Pereira A., Sanchez A., Moazami-Goudarzi K.,
Genetic diversity measures of local European cattle breeds for conservation
purposes, Genet. Sel. Evol. 33 (2001) 311–332.
Conservation priorities for Ethiopian sheep
445
[6] CSA (Central Statistical Authority), Ethiopian Agricultural Sample Enumeration
for the year 2004/2005, Statistical report on farm management practices,
livestock and farm implements, Addis Ababa, Ethiopia, 2005.
[7] Eding H., Meuwissen T.H.E., Marker-based estimates of between and within
population kinships for the conservation of genetic diver sity, J. Anim. Breed.
Genet. 118 (2001) 141–159.
[8] Eding H., Meuwissen T.H.E., Linear methods to estimate kinships from genetic
marker data for the construction of core sets in genetic conservation schemes,
J. Anim. Breed. Genet. 120 (2003) 289–302.
[9] Eding H., Crooijmans R.P.M.A., Groenen M.A.M., Meuwissen T.H.E., Asses-
sing the contribution of breeds to genetic diversity in conservation schemes,
Genet. Sel. Evol. 34 (2002) 613–634.
[10] European Cattle Genetic Diversity Consortium, Marker-assisted conservation of
European cattle breeds: an evaluation, Anim. Genet. 37 (2006) 475–481.
[11] FAO (Food and Agriculture Organization of the United Nations), World Watch
List for Domestic Animal Diversity, 2nd edn., FAO, Rome, 1995.
[12] FAO (Food and Agriculture Organization of the United Nations), Measurement
of domestic animal diversity (MoDAD): Recommended microsatellite markers,
[consulted 2005].
[13] Galal E.S.E., Sheep germplasm in Ethiopia, Anim. Genet. Res. Inf. 1 (1983)
4–12.
[14] Gandini G.C., Ollivier L., Danell B., Distl O., Georgoudis A., Groeneveld E.,
Martyniuk E., van Arendonk J.A.M., Woolliams J.A., Criteria to assess the
degree of endangerment of livestock breeds in Europe, Livest. Prod. Sci. 91 (2004)
173–182.
[15] Gizaw S. , van Arendonk J.A.M., Komen H., Windig J.J., Hanotte O., Population
structure, genetic variation and morphological diversity in indigenous sheep of
Ethiopia, Anim. Genet. 38 (2007) 621–628.
[16] Hall S.J.G., Ruane J., Livestock breeds and their conservation: a global
overview, Conserv. Biol. 4 (1993) 815–825.
[17] Mateus J.C., Eding H., Penedo M.C.T., Rangel-Figueiredo M.T., Contributions
of Portuguese cattle breeds to genetic diversity using marker-estimated kinships,
Anim. Genet. 35 (2004) 305–313.
[18] Nei M., Tajima F., Tateno Y., Accuracy of estimated phylogeneti c trees from
molecular data, J. Mol. Evol. 19 (1983) 153–170.
[19] Rege J.E.O., Gibson J.P., Animal genetic resources and economic develop-
ment: issues in relation to economic valuation, Ecol. Econ. 45 (2003) 319–
330.
[20] Reist-Marti S.B., Simianer H., Gibson J., Hanotte O., Rege J.E.O., Weitzman’s
approach and conservation of breed diversity: an application to African cattle
breeds, Conserv. Biol. 17 (2003) 1299–1311.
[21] Reist-Marti S.B., Simianer H., Abdula A., Optimum allocation of conservation
funds and choice of conservation programs for a set of African cattle breeds, Genet.
Sel. Evol. 38 (2006) 99–126.
446 S. Gizaw et al.
[22] Ruane J., A framework for p rioritizing domestic animal breeds for conservation
purposes at the national level: a Norwegian case study, Conserv. Biol. 14 (2000)
1385–1393.
[23] Sambrook J., Fritsch E.F., Maniatis T., Molecular Cloning: A Laboratory
Manual, Cold Spring Harbor Laboratory Press, New York, 1989.
[24] Simianer H., Marti S.B., Gibson J., Hanotte O., Rege J.E.O., An approach to the
optimal allocation of conservation funds to minimize loss of genetic diversity
between livestock breeds, Ecol. Econ. 45 (2003) 377–392.
[25] Simon D.L., European approaches to c onservation of farm animal genetic
resources, Anim. Genet. Res. Inf. 25 (1999) 77–97.
[26] Tapio I., Varv S., Bennewitz J., Maleviciute J., Fimland E., Grisils Z.,
Meuwissen T.H.E., Miceikiene I., Olsaker I., Viinalass H., Vilkki J., Kantanen J.,
Prioritization for conservation of Northern European cattle breeds based on
analysis of microsatellite data, Con serv. Biol. 20 (2006) 1768–1779.
[27] Thaon d’Arnoldi C., Foulley J.L., Ollivier L., An overview of the Weitzman
approach to diversity, Genet. Sel. Evol. 30 (1998) 149–161.
[28] Weitzman M.L., On diversity, Q. J. Econ. 107 (1992) 363–405.
Conservation priorities for Ethiopian sheep
447