practical packet analysis using wireshark to solve real world network problems phần 6 ppt
Bạn đang xem bản rút gọn của tài liệu. Xem và tải ngay bản đầy đủ của tài liệu tại đây (978.59 KB, 18 trang )
This communication is summed up nicely in the Info column of the
Packet List pane, though that window only gives a very brief summary of the
packet contents. If you want to dig a little deeper, you can expand the FTP
section in the Packet Details pane.
Notice that encryption is not used in our example, so the FTP password
can be seen clearly in the capture file in packet 7 (Figure 6-16).
Figure 6-16: The password of the user csanders can be seen clearly in this packet.
A connecting client uses a list of
commands to interact with an FTP server.
These range from viewing the contents of a
directory, traversing a directory, download- Figure 6-17: Packet 15 shows the
PWD command being issued to the
ing or deleting a file, and so on. (For a
server.
complete list of the available commands
visible in an FTP packet, see RFC 959.)
Let’s look at a few FTP commands used in
our example file, beginning with packet 15,
shown in Figure 6-17.
CWD Command
As you can see, packet 15 shows a CWD command being sent from the client
to the server. CWD stands for change working directory, and this command is
invoked every time you tell an FTP client to move to a different directory on
the server.
Notice in this example that the CWD command includes requests to
change the working directory to /, which is the root directory of the FTP
server. When you first log into an FTP server, the CWD command is issued
to change to the root directory, /. Once the server receives this CWD
command, it changes to the root directory and tells the client that / is
now the current working directory.
SIZE Command
The next command is the SIZE
command, shown in Figure 6-18.
This command reports the size
(in bytes) of a particular file, and
it is always sent with a filename.
70
C ha pt er 6
Figure 6-18: The SIZE command
being sent to the server
Notice in packet 25 that the
client sends the SIZE command
to the server to request the size
of the file Music.mp3. Packet 26
(Figure 6-19) shows the server’s
response, which is the file size of
4,980,924 bytes.
Figure 6-19: The packet returned from the
issued SIZE command
RETR Command
The RETR (retrieve) command,
shown in Figure 6-20, is used by
Figure 6-20: The RETR command is used
the client to request the downto download a file from the FTP server.
load of a file from the server.
In packet 32, the client sends
the RETR command to the server, requesting download of the file Music.mp3.
Once the server gets this request, it begins sending the data to the client.
NOTE
The packets labeled FTP-DATA are ones containing a file that is being downloaded
from or uploaded to the server.
Telnet Protocol
telnet.pcap
NOTE
The telnet protocol (RFC 854) is an unsecured, text-based way for a server and
client to communicate. It is often used to remotely administer servers, switches,
routers, and other network hardware devices.
In this capture file you will see an example of a client computer
(192.168.0.2) connecting to a telnet server (192.168.0.1). As you begin to
step through the data being transmitted, notice that everything is sent in
clear text. For this reason, the telnet protocol should not be used to
transmit sensitive data.
You can be more secure by forgoing telnet and using SSH instead.
What type of communication is occurring in this
exchange between server and
client? Starting at the top, we
can immediately draw several
conclusions. The first several
packets confirm that we are
definitely seeing telnet traffic,
because telnet-specific settings
Figure 6-21: The first packets of the capture file
are being communicated
are telnet packets between server and client.
between these two devices,
as shown in Figure 6-21.
Each telnet session uses several unique options to specify communication
rates and data transfer modes, which must be synchronized between client
C omm on Pr ot oco ls
71
and server before communication can begin. These options account for the
first 30 or so packets in the sample capture file.
The first interesting packet is number 27, which identifies the server as
an OpenBSD server. Packet 29 presents a login prompt to the client, and in
packet 31 you can see that the username fake is sent back to the server. Packet
36 requests a password from the client, which is answered in packet 38 with
the password user, which is shown in Figure 6-22. You can now see just how
insecure telnet is. This username and password combination could very well
be the administrative password to one of the most important servers on your
network, and it would still be shown in clear text that is readable by anyone
with a packet sniffer and little bit of knowledge.
Figure 6-22: A password transmitted via telnet can be seen as clear as day.
The rest of the capture file shows the client using the established telnet
session to ping several websites. You can observe this data and exactly how it
is transferred by looking at the telnet section in the Packet Details pane.
MSN Messenger Service
msnms.pcap
You may find that you need to analyze the traffic of an instant message conversation for several reasons. We explored one possible scenario in Chapter 5
when we suspected an employee of giving away company financial information over messenger software. There are several popular instant messaging
applications, and while each one utilizes its own protocol, there are certain
similarities in each. Here we’ll focus specifically on traffic from the MSN
Messenger Service (MSNMS). Let’s see if we can’t catch some employees
in the act.
NOTE
Some organizations have policies that prevent the use of messaging software, and if so,
even seeing the MSNMS protocol in a capture file can set off alarms.
The capture file begins like any TCP communication—with a simple
handshake between two clients, as shown in Figure 6-23.
Figure 6-23: The TCP handshake begins the communication process.
72
C ha pt er 6
Following this handshake, the first MSNMS packet is sent from
192.168.0.114 to a server residing outside of your local network (Figure 6-24).
Figure 6-24: This packet shows a client inside our network communicating with a server from the outside world.
This packet is being sent from a computer on your network to a
remote Microsoft server in order to establish a handshake that prepares
for communication. These initial packets are marked as USR packets, as
seen under the MSNMS section of the packet in the Packet Details pane.
You can seen the email address of the person initiating the conversation
() in these initial packets (Figure 6-25).
Figure 6-25: The user
appears to be initiating a conversation, as seen
in the packet details of packet 5.
The next two packets are marked CAL packets, as shown in Figure 6-26.
CAL packets are sent from the computer inside your network to an MSN
server in order to establish communication with another MSNMS user.
Figure 6-26: CAL packets are used here to establish communication between MSNMS users.
As you can see in packet 7, the corresponding MSNMS user has the
email address (Figure 6-27).
Figure 6-27: This CAL packet lets us see the email address of the user initiating communication.
The server now acknowledges that it has received CAL packet 7 in
packet 8 (Figure 6-28).
Figure 6-28: Packet 8 shows acknowledgment of packet 7.
C omm on Pr ot oco ls
73
Packet 9 is the last packet to be sent to fully establish communication.
As shown in Figure 6-29, packet 9 is a JOI packet sent from the remote MSN
servers, indicating that the other member of the party (tesla_thomas@
hotmail.com, in this case) has successfully joined a session and can establish
communication.
Figure 6-29: Packet 9 is a JOI packet indicating that the users are now sharing a session.
The balance of the capture file contains only MSG packets, which are
simply messages sent from one endpoint to another—in this case between
Brian and Thomas.
The first thing that probably comes to mind when you think of this
concept is, Can I really see what they are saying?! Well, as scary as it is, the
answer is yes. Everything. By simply right-clicking one of the MSG packets
and selecting Follow TCP Stream (as you learned to do in Chapter 5) you
can see the full conversation between Brian and Thomas (Figure 6-30).
This might make you be a little more careful about what you say in instant
messenger conversations while on the job!
Figure 6-30: We’ll see who’s a jerk! You’re fired!
74
C ha pt er 6
Internet Control Message Protocol
icmp.pcap
Internet Control Message Protocol (ICMP) is a part of the IP protocol; I like to call
it a utility protocol because it’s used for troubleshooting other protocols. If you
have ever used the ping utility, you have used the ICMP protocol.
Let’s see what common ICMP traffic looks like. The included capture file
only contains eight packets. There are two separate pings to two separate
hosts. Let’s look at the packet details of packet 1, shown in Figure 6-31.
If you expand the ICMP section,
you will see what little there is to an
ICMP packet. The first packet is
labeled as type 8, an echo (ping)
request. Every ICMP packet has a
numerical type associated with it,
which determines how the packet is
to be handled by the destination
Figure 6-31: The first ping packet, packet 1
machine. (RFC 792 lists all the
different types of ICMP packets.)
Common sense tells us that if a computer sends an echo request, it
should receive an echo reply, and that’s just what we see in the capture file.
Packet 2 is transmitted back from the remote computer and is marked as
ICMP type 0, an echo (ping) reply.
A standard ping from a Windows command line pings a host four
times. You can see the ping process in the capture file and in Figure 6-32,
as well. The first ping destination, 192.168.0.1, receives and replies to four
pings. Following this, another ping is initiated to 72.14.207.99 (http://
www.google.com), which also receives and replies to four pings.
Figure 6-32: Ping, reply, ping, reply, ping, reply—you get the picture, right?
Final Thoughts
The goal of this chapter has been to introduce you to using Wireshark to
analyze capture files and to use those capture files to show you how some
common protocols work. Although we’ve only briefly covered some of the
more advanced protocols, I highly recommend reading their RFCs and
studying them more in depth. As the book continues on to various scenarios, we will be building on the basic concepts you’ve learned here.
C omm on Pr ot oco ls
75
7
BASIC CASE SCENARIOS
Now we’ve arrived at the real meat and
bones of this book—we are ready to use
Wireshark and packet analysis to actually
analyze network problems.
We’ll begin with a look at some simple scenarios in which our ability to
analyze packets will help us to better understand what’s going on behind the
scenes. Then we’ll look at some simple real-world troubleshooting scenarios
that you could very possibly encounter on a daily basis. Let’s dive in.
A Lost TCP Connection
One of the most common problems we encounter when troubleshooting is
a loss of network connectivity. For now, we’ll ignore the reasons why that
loss of connectivity might occur and take a look at what that loss actually
looks like at the packet level, so you can identify this type of problem when
troubleshooting.
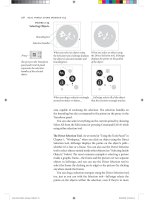
The small capture file tcp-con-lost.pcap (Figure 7-1) shows a loss of connectivity. The file begins with four standard TCP ACK packets sent between
10.3.71.7 and 10.3.30.1.
Figure 7-1: This capture begins simply enough with a few ACK packets.
The problem begins in packet 5, where we first see TCP retransmission
packets (Figure 7-2).
Figure 7-2: These TCP retransmissions are a sign of a weak or dropped connection.
By design, when TCP sends a packet to a destination and does not get a
reply, it waits a specified amount of time then retransmits the original packet.
If a response is still not received, the source (transmitting) computer doubles
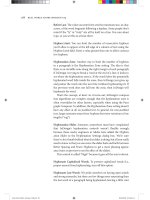
the amount of time it waits for a response before sending another retransmission. The concept of a TCP retransmission is illustrated in Figure 7-3.
10.3.30.1
10.3.71.7
SYN
ACK
ACK
Retransmission
ACK
Retransmission
ACK
Retransmission
ACK
Retransmission
ACK
Retransmission
Connection
Terminated
Figure 7-3: Too many TCP retransmissions are
usually a sign of a connectivity problem.
78
C ha pt er 7
As shown in Figure 7-3, the TCP retransmission process repeats until
five retransmission attempts are completed, which always takes approximately
9.6 seconds under its Windows implementation. Once five retransmission
attempts have failed, the connection has completely failed and the data in
the transmission is lost.
If you set your Wireshark time display format to show the time that has
elapsed since the previously captured packet (View Time Display Format
Seconds Since Beginning of Capture), you can visualize the incrementing of
time between packets (Figure 7-4).
Figure 7-4: Windows will retransmit up to five times by default.
Now take a closer look at the packets being retransmitted in Figure 7-4.
Notice that their sequence number (Seq=5840) matches the ACK number of
packet five shown at the bottom of Figure 7-1 (Ack=5840).
As you learned in Chapter 6, TCP relies on these SEQ and ACK numbers
to keep a TCP stream in order. Because the SEQ number shown in the retransmission matches the ACK number of packet 5, you know that packet 5 is the
packet that was lost and is now being retransmitted. The ability to locate the
exact packet at which a TCP retransmission attempt begins may often lead you
to clues that help you determine exactly why a loss of connectivity occurred.
Unreachable Destinations and ICMP Codes
When testing for network connectivity, one of the most commonly used tools
is the ICMP ping utility. If you are lucky, the target you are pinging will respond,
telling you that your ping was successful. Unfortunately, you often won’t get
a ping response back when you’re troubleshooting; you’ll receive a Destination
unreachable message instead. Using a packet sniffer in conjunction with an
ICMP utility can give you a little more information than just ICMP alone
would. Let’s see if we can’t get inside this ICMP error message to isolate the
problem.
Unreachable Destination
destunreachable.pcap
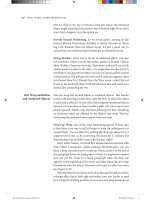
When you open the destunreachable.pcap file, you’ll notice that the first
packet in the capture file is your standard Echo (ping) request packet (also known
as an ICMP type 8 packet) from 10.2.10.2 to 10.4.88.88, as shown in Figure 7-5.
To verify this, look at the ICMP section of the Packet Details pane—you
should see this packet identified as such. Typically, though, you would want
to receive an Echo (ping) reply packet (also known as an ICMP type 0 packet)
in response to your ping.
B as i c C a s e Sc en ar ios
79
Figure 7-5: A standard ping request from 10.2.10.2 to 10.4.88.88
Examining packet 2 in Figure 7-6, you can see that it too is not a type 0
packet, but rather a type 3 packet, which is returned when a destination you
are trying to ping is unreachable.
Figure 7-6: This ICMP type 3 packet is not what we expected.
NOTE
If ICMP only identified the packet type, it wouldn’t give us much useful information.
But fortunately, it gives us a code number too, like Code: 1 (Host unreachable) .
(Several types of ICMP packets offer codes with a bit more specific information about the
packet.) Notice that the source IP address in packet 2 is not the computer the ping was
destined for. This is a sure sign that your echo request didn’t make it to its destination.
The listed ICMP code (1) tells us that the ping request made it to the
upstream router or switch, but not to the destination host. When a host is
unreachable, you will also often see an ARP broadcast sent from the router
or switch. A lack of response to this ARP broadcast means that the sending
device cannot find the destination device, so it sends a packet back to the
source computer with an ICMP type 0, code 1 packet.
Unreachable Port
Another common task when troubleshooting is to ping a device on a specific
port. This is typically done to ensure that ports that are required for certain
services to run are open and accepting incoming communication.
For example, you can ensure that FTP is accessible by pinging a remote
computer on port 21. If for some reason the remote computer is not accepting
incoming communication on port 21, it will return an ICMP type 0, code 2
packet, which means that the destination port is unreachable.
Since you will most likely be using ICMP very often in your day-to-day network maintenance routine, you should familiarize yourself with it and some
of its more common types and codes. (I keep a business card–sized quick
reference in my desk; it never hurts to have something like that on hand.)
80
C ha pt er 7
Fragmented Packets
ipfragments
.pcap
Internet Protocol is used for the bulk of data transfer across a network, but we
often overlook the fact that only so much data can fit on the wire at a time.
In order to address these lower layer limitations, IP features a technology
called fragmentation. IP fragmentation allows the protocol to break large
amounts of data into chunks that can be sent across the wire and reassembled
on the receiving system.
In this section, we’ll look at a stream of data that has been fragmented
by IP.
The trace file ipfragments.pcap consists of 24 packets that show a ping
request and response. From our previous experience, we know that a typical
ICMP ping-and-response sequence only takes eight packets. Then why do we
have so many more here? Because in this case, each request and reply requires
three packets instead of only one, so there are three times more packets than
usual, as you can see in Figure 7-7.
Figure 7-7: This ping request requires three packets rather than one because the data being transmitted is
above average size.
These are the packets you would see if you were to capture a ping whose
data size was larger than the default. By default, a ping only sends 32 bytes
of data to its destination in Windows. However, as you can see, the ping in
this trace file is transmitting 3,072 bytes of data to the client. This presents a
problem because Ethernet is only designed to handle 1,500 bytes in a single
packet. Therefore, IP must fragment the packets into a data stream, which
is what you see in this trace file.
Determining Whether a Packet Is Fragmented
How can you tell if a packet has been fragmented? Luckily, all we need to do
is look at the Packet Details pane in ipfragments.pcap. Here’s how to do it:
1.
In the capture file, select packet 1, and then expand the Internet
Protocol section in the lower portion of the Packet Details pane.
2.
You should see a section called Flags. Expand this section and you should
see three fields of data, as shown in Figure 7-8. The one that is of most
interest to us is the More Fragments section. Notice that for this packet,
this section has a value of 1; this means that it has more fragments
following it.
B as i c C a s e Sc en ar ios
81
Figure 7-8: If the More Fragments flag has a value of 1, you can expect more packets
to come with it.
3.
Look at the same section for packet 2; you should see that it has the same
value in the More Fragments field.
4.
Look at the More Fragments field for packet 3, shown in Figure 7-9.
Unlike packets 1 and 2, this packet has a 0 in the More Fragments field.
A value of 0 tells us that this packet is the end of the data stream and
that there are no more fragments following it. The only possible values
for this field are 1 and 0.
Figure 7-9: A More Fragments flag set to 0 indicates that this packet is the end of this
particular data stream.
Keeping Things in Order
The next question that arises is how these fragmented packets stay in order.
Since a device can receive multiple data streams at once, IP allows for an
offset value so that receiving systems know the order in which to sequence
fragmented packets.
To view the offset value of a fragmented packet, look under the IP section
of the Packet Details pane. For example, if you view the IP section for packet 1
in the example file, you will see an offset value of 0. This tells you that this is
the first packet in a series of fragmented packets.
82
C ha pt er 7
If you browse to the second packet, you will see a dramatic change in this
number (Figure 7-10): it rises to 1,480. The reason for this change is that the
offset value of every fragmented packet following the first one is determined
by the payload (data) size of the previous packet (minus the size of the IP
header, which is 20 bytes). In the case of packet 2, this packet takes the
previous offset, which is 0, and adds the size (in bytes) of the previous packet
to it, which is 1,480.
Figure 7-10: Packet 2 has an offset value based on the payload of the previous packet.
Like packet 2, packet 3 takes the previous offset of 1,480 and adds the
previous packet size of 1,480, resulting in a new offset of 2,960. This concept
is illustrated in Figure 7-11.
Packet 1
More Fragments = 1
Offset = 0
Packet 2
More Fragments = 1
Offset = 1480
Packet 3
More Fragments = 0
Offset = 2960
Figure 7-11: IP fragmentation breaks down large chunks of data into smaller data streams.
Take a look at examples of some other fragmented IP traffic to see if you
can follow a particular data stream until it ends and keep that stream in order
using each packet’s offset. (This may prove to be more of a challenge than
you think in a cluttered capture file.)
No Connectivity
barryscomputer
.pcap and
bethscomputer
.pcap
Now we’ll use Wireshark for the first time to analyze and troubleshoot a realworld network problem. In this scenario we have two users, Barry and Beth,
who sit next to each other in an office. After a budget increase (yeah, right!),
the IT department has just purchased two new computers for Barry and Beth.
You are in charge of installing these new computers and making sure they
are working properly. After unpacking, plugging in, and configuring both
computers, you begin to test them to make sure everything is working. However, you quickly run into a problem. Barry’s computer is working perfectly,
but for some reason, Beth’s is unable to access the Internet. Your goal is to
find out why Beth’s computer is unable to connect to the Internet and then
fix the problem.
B as i c C a s e Sc en ar ios
83
What We Know
The first thing you should always do when troubleshooting a problem is make
a list of what you know about the issue. In this case, we know that Barry and
Beth are both using identical, brand new computers. We also know that both
computers have network connectivity because you assigned them IP addresses
yourself and made sure that you could ping them from another computer on
that network segment. Finally, we know that everything that has been configured on both computers should be exactly the same, since you configured
them one after the other.
Tapping into the Wire
Once we have established what we know about the issue, it is time to devise a
plan to figure out what we don’t know. We begin by figuring out what type of
traffic captures we need to take and where we need to place our analyzer on
the network to get them.
The problem is being able to access the Internet, so the logical choice is
to capture packets while Beth’s computer is trying to access a website. The
network Barry and Beth are connecting to is one we aren’t extremely familiar
with, so for the purposes of comparison, we will capture packets from Barry’s
computer, as well. We’ll end up with two capture files: one that works and
one that doesn’t. Comparing the two should help us determine the problem.
This process is known as baselining. We’ll install Wireshark directly on both
machines.
Analysis
Let’s begin by looking at the trace file showing Barry’s computer successfully
accessing the Internet (barryscomputer.pcap). When you open the trace file,
the first thing you will see is a textbook HTTP transaction.
As you can see in Figure 7-12, you first have an ARP broadcast looking
for the Layer 2 address of the default gateway, 192.168.0.10. Once Barry’s
computer receives a reply to this request, it initiates a TCP handshake with
the remote webserver. Once this is completed, data transfer from the server
to the client begins.
Figure 7-12: Barry’s computer completes a handshake, and then HTTP data transfer begins.
Now that we know what a successful web request should look like on
this network, let’s take a look at the capture file from Beth’s computer
(bethscomputer.pcap) to see if we can find the problem. It shouldn’t take
too long to realize that something is definitely wrong here. As shown
84
C ha pt er 7
in Figure 7-13, the very first packet is an ARP request, not unlike the one in
barryscomputer.pcap. However, this ARP request is not sent to the same
IP address as the last one. Here, ARP is looking for a device with an IP address
of 192.168.0.11.
Figure 7-13: Beth’s computer appears to be sending an ARP request to a different IP address.
Immediately after that ARP packet, we see a bunch of NetBIOS traffic, as
shown in Figure 7-14. If that other IP address wasn’t a sign that something is
wrong, then all of this NetBIOS traffic definitely is.
Figure 7-14: All this NetBIOS traffic can’t be a good thing.
NetBIOS is an older protocol that is typically only used now as a
backup when TCP/IP isn’t working. The appearance of NetBIOS traffic
here means that since Beth’s computer was unable to successfully connect
to the Internet with TCP/IP, it reverted to NetBIOS as an alternate means
of communication—but that also failed. (Anytime you see NetBIOS on
your network, it is often a good sign that something is not quite right.)
Let’s focus on the biggest anomaly we have seen so far—that is, the
different IP addresses in each of the ARP packets. Barry’s computer used
ARP to find the location of the default gateway, 192.168.0.10. Beth’s computer attempted to do the same thing; however, it tried to find the location
of the IP address 192.168.0.11 and failed, as shown in Figure 7-15. The default
gateway addresses are inconsistent; something is wrong.
Barry’s Computer
Beth’s Computer
Figure 7-15: The different destination addresses for each ARP
packet point to a problem.
B as i c C a s e Sc en ar ios
85
A quick check of the TCP/IP settings on both computers reveals the
answer to our problem: a typo. Barry’s computer is set to have a default
gateway of 192.168.0.10, and Beth’s computer is set to 192.168.0.11, which
is the wrong address.
Summary
The errors you run into will often be due to misconfigurations. When possible,
compare a machine that works properly with the one that doesn’t to see if
you can pinpoint the problem. In the preceding scenario we were able to
pinpoint the exact packet in which things did not match up correctly. Once
you can narrow down your problem, you will have a much easier time fixing it.
The Ghost in Internet Explorer
hauntedbrowser
.pcap
This scenario begins with a disturbing call to the help desk from a user on
your network named Chad. According to Chad, his computer has recently
been host to a demonic possession. Despite his best efforts, the home page on
his Internet browser keeps changing itself to point to various weather sites.
Even if he manually changes it back to what it should be, his changes are
reversed after he reboots his computer. Your goal here is to get to the bottom
of this “possession” and to perform an exorcism of the ghosts that have invaded
Chad’s computer.
What We Know
Chad has been with our company quite a while and we know he does not
have a great deal of technical expertise. In fact, he usually does more harm
than good with a computer. (I don’t suppose you know any users like that,
do you?) From a technical standpoint, we know that Chad’s computer is
about two years old, runs the Windows XP operating system, and uses
Internet Explorer 6 as its browser.
Tapping into the Wire
Because this problem occurs on only Chad’s computer, we know that the only
machine we should have to capture packets from is Chad’s. Also, because it
seems that Chad’s home page resets every time he boots up his computer,
we’ll perform our capture at boot time.
In this case, we can’t install Wireshark directly onto Chad’s machine and
capture the packets we need, so hubbing out is a good method to use. If you
don’t remember how this technique is administered, please refer to our
discussion about it in “Hubbing Out” on page 19. The capture will start as
soon as the computer is turned on and will stop as soon as it is completely
booted up; no user interaction will be required.
86
C ha pt er 7
Analysis
Although there is no user interaction with the computer during the capture,
you may be a bit shocked when you open the trace file (hauntedbrowser.pcap)
and see TCP and HTTP packets shooting across the wire, as shown in
Figure 7-16. During a normal bootup process, you should rarely, if ever,
see packets sent like this.
Figure 7-16: Since there is no user interaction happening on Chad’s computer at the time of this capture, all of
these packets going across the wire should set off some alarms.
Looking more closely at these packets, we can immediately draw some
conclusions. First, we know that all of these HTTP requests are being generated by Chad’s computer because his IP address is listed as the source of
all the TCP and HTTP packets. Also, you can see in packet 5 (Figure 7-17)
that this computer is sending HTTP packets to a system on the Internet
with the GET command, meaning that it is trying to download data.
Figure 7-17: Looking more closely at packet 5, we see it is trying to download data from the Internet.
Given this information, we can assume that something is running on
Chad’s computer at startup that shouldn’t be. A look further down the
Packet List pane provides us with an insight that may just be the root
of our problem. Packets 11 and 12 do a DNS request for a server on the
weatherbug.com domain, as shown in Figure 7-18.
Figure 7-18: A DNS query to the weatherbug.com domain gives a clue to the culprit.
Considering Chad’s home page keeps changing to weather sites when he
boots up, we have probably just found our culprit. Upon further investigation
of Chad’s computer, our assumptions prove correct, and we find that the
computer has the WeatherBug desktop program running in the background,
set to download new weather information and display it on the home page
after every restart. After uninstalling this software, the problem ceases.
B as i c C a s e Sc en ar ios
87