Báo cáo y học: "Variation in alternative splicing across human tissues" potx
Bạn đang xem bản rút gọn của tài liệu. Xem và tải ngay bản đầy đủ của tài liệu tại đây (586.84 KB, 15 trang )
Genome Biology 2004, 5:R74
comment reviews reports deposited research refereed research interactions information
Open Access
2004Yeoet al.Volume 5, Issue 10, Article R74
Research
Variation in alternative splicing across human tissues
Gene Yeo
¤
*†
, Dirk Holste
¤
*
, Gabriel Kreiman
†
and Christopher B Burge
*
Addresses:
*
Department of Biology, Center for Biological and Computational Learning, Massachusetts Institute of Technology, Cambridge, MA
02319, USA.
†
Department of Brain and Cognitive Sciences, Center for Biological and Computational Learning, Massachusetts Institute of
Technology, Cambridge, MA 02319, USA.
¤ These authors contributed equally to this work.
Correspondence: Christopher B Burge. E-mail:
© 2004 Yeo et al.; licensee BioMed Central Ltd.
This is an Open Access article distributed under the terms of the Creative Commons Attribution License (
which permits unrestricted use, distribution, and reproduction in any medium, provided the original work is properly cited.
Variation in alternative splicing across human tissues<p>Alternative pre-mRNA splicing (AS) is widely used by higher eukaryotes to generate different protein isoforms in specific cell or tissue types. To compare AS events across human tissues, we analyzed the splicing patterns of genomically aligned expressed sequence tags (ESTs) derived from libraries of cDNAs from different tissues.</p>
Abstract
Background: Alternative pre-mRNA splicing (AS) is widely used by higher eukaryotes to generate
different protein isoforms in specific cell or tissue types. To compare AS events across human
tissues, we analyzed the splicing patterns of genomically aligned expressed sequence tags (ESTs)
derived from libraries of cDNAs from different tissues.
Results: Controlling for differences in EST coverage among tissues, we found that the brain and
testis had the highest levels of exon skipping. The most pronounced differences between tissues
were seen for the frequencies of alternative 3' splice site and alternative 5' splice site usage, which
were about 50 to 100% higher in the liver than in any other human tissue studied. Quantifying
differences in splice junction usage, the brain, pancreas, liver and the peripheral nervous system had
the most distinctive patterns of AS. Analysis of available microarray expression data showed that
the liver had the most divergent pattern of expression of serine-arginine protein and
heterogeneous ribonucleoprotein genes compared to the other human tissues studied, possibly
contributing to the unusually high frequency of alternative splice site usage seen in liver. Sequence
motifs enriched in alternative exons in genes expressed in the brain, testis and liver suggest specific
splicing factors that may be important in AS regulation in these tissues.
Conclusions: This study distinguishes the human brain, testis and liver as having unusually high
levels of AS, highlights differences in the types of AS occurring commonly in different tissues, and
identifies candidate cis-regulatory elements and trans-acting factors likely to have important roles
in tissue-specific AS in human cells.
Background
The differentiation of a small number of cells in the develop-
ing embryo into the hundreds of cell and tissue types present
in a human adult is associated with a multitude of changes in
gene expression. In addition to many differences between tis-
sues in transcriptional and translational regulation of genes,
alternative pre-mRNA splicing (AS) is also frequently used to
regulate gene expression and to generate tissue-specific
mRNA and protein isoforms [1-5]. Between one-third and
two-thirds of human genes are estimated to undergo AS [6-
Published: 13 September 2004
Genome Biology 2004, 5:R74
Received: 19 April 2004
Revised: 1 June 2004
Accepted: 27 July 2004
The electronic version of this article is the complete one and can be
found online at />R74.2 Genome Biology 2004, Volume 5, Issue 10, Article R74 Yeo et al. />Genome Biology 2004, 5:R74
11] and the disruption of specific AS events has been impli-
cated in several human genetic diseases [12]. The diverse and
important biological roles of alternative splicing have led to
significant interest in understanding its regulation.
Insights into the regulation of AS have come predominantly
from the molecular dissection of individual genes (reviewed
in [1,12]). Prominent examples include the tissue-specific
splicing of the c-src N1 exon [13], cancer-associated splicing
of the CD44 gene [14] and the alternative splicing cascade
involved in Drosophila melanogaster sex determination [15].
Biochemical studies of these and other genes have described
important classes of trans-acting splicing-regulatory factors,
implicating members of the ubiquitously expressed serine/
arginine-rich protein (SR protein) and heterogeneous nuclear
ribonucleoprotein (hnRNP) families, and tissue-specific fac-
tors including members of the CELF [16] and NOVA [17] fam-
ilies of proteins, as well as other proteins and protein families,
in control of specific splicing events. A number of cis-regula-
tory elements in exons or introns that play key regulatory
roles have also been identified, using a variety of methods
including site-directed mutagenesis, systematic evolution of
ligands by exponential enrichment (SELEX) and computa-
tional approaches [18-22]. In addition, DNA microarrays and
polymerase colony approaches have been developed for
higher-throughput analysis of alternative mRNA isoforms
[23-26] and a cross-linking/immunoprecipitation strategy
(CLIP) has been developed for systematic detection of the
RNAs bound by a given splicing factor [27]. These new meth-
ods suggest a path towards increasingly parallel experimental
analysis of splicing regulation.
From another direction, the accumulation of large databases
of cDNA and expressed sequence tag (EST) sequences has
enabled large-scale computational studies, which have
assessed the scope of AS in the mammalian transcriptome
[3,8,10,28]. Other computational studies have analyzed the
tissue specificity of AS events and identified sets of exons and
genes that exhibit tissue-biased expression [29,30]. However,
a number of significant questions about tissue-specific alter-
native splicing have not yet been comprehensively addressed.
Which tissues have the highest and lowest proportions of
alternative splicing? Do tissues differ in their usage of differ-
ent AS types, such as exon skipping, alternative 5' splice site
choice or alternative 3' splice site choice? Which tissues are
most distinct from other tissues in the spectrum of alternative
mRNA isoforms they express? And to what extent do expres-
sion levels of known splicing factors explain AS patterns in
different tissues?
Here, we describe an initial effort to answer these questions
using a large-scale computational analysis of ESTs derived
from about two dozen human tissues, which were aligned to
the assembled human genome sequence to infer patterns of
AS occurring in thousands of human genes. Our results dis-
tinguish specific tissues as having high levels and distinctive
patterns of AS, identify pronounced differences between the
proportions of alternative 5' splice site and alternative 3'
splice site usage between tissues, and predict candidate cis-
regulatory elements and trans-acting factors involved in tis-
sue-specific AS.
Results and discussion
Variation in the levels of alternative splicing in different
human tissues
Alternative splicing events are commonly distinguished in
terms of whether mRNA isoforms differ by inclusion or exclu-
sion of an exon, in which case the exon involved is referred to
as a 'skipped exon' (SE) or 'cassette exon', or whether iso-
forms differ in the usage of a 5' splice site or 3' splice site, giv-
ing rise to alternative 5' splice site exons (A5Es) or alternative
3' splice site exons (A3Es), respectively (depicted in Figure 1).
These descriptions are not necessarily mutually exclusive; for
example, an exon can have both an alternative 5' splice site
and an alternative 3' splice site, or have an alternative 5' splice
site or 3' splice site but be skipped in other isoforms. A fourth
type of alternative splicing, 'intron retention', in which two
isoforms differ by the presence of an unspliced intron in one
transcript that is absent in the other, was not considered in
this analysis because of the difficulty in distinguishing true
intron retention events from contamination of the EST data-
bases by pre-mRNA or genomic sequences. The presence of
these and other artifacts in EST databases are important
caveats to any analysis of EST sequence data. Therefore, we
imposed stringent filters on the quality of EST to genomic
alignments used in this analysis, accepting only about one-
fifth of all EST alignments obtained (see Materials and
methods).
To determine whether differences occur in the proportions of
these three types of AS events across human tissues, we
assessed the frequencies of genes containing skipped exons,
alternative 3' splice site exons or alternative 5' splice site
exons for 16 human tissues (see Figure 1 for the list of tissues)
for which sufficiently large numbers of EST sequences were
available. Because the availability of a larger number of ESTs
derived from a gene increases the chance of observing alter-
native isoforms of that gene, the proportion of AS genes
observed in a tissue will tend to increase with increasing EST
coverage of genes [10,31]. Since the number of EST sequences
available differs quite substantially among human tissues (for
example, the dbEST database contains about eight times
more brain-derived ESTs than heart-derived ESTs), in order
to compare the proportion of AS in different tissues in an
unbiased way, we used a sampling strategy that ensured that
all genes/tissues studied were represented by equal numbers
of ESTs.
It is important to point out that our analysis does not make
use of the concept of a canonical transcript for each gene
because it is not clear that such a transcript could be chosen
Genome Biology 2004, Volume 5, Issue 10, Article R74 Yeo et al. R74.3
comment reviews reports refereed researchdeposited research interactions information
Genome Biology 2004, 5:R74
objectively or that this concept is biologically meaningful.
Instead, AS events are defined only through pairwise compar-
ison of ESTs.
Our objective was to control for differences in EST abundance
across tissues while retaining sufficient power to detect a rea-
sonable fraction of AS events. For each tissue we considered
genes that had at least 20 aligned EST sequences derived
from human cDNA libraries specific to that tissue ('tissue-
derived' ESTs). For each such gene, a random sample of 20 of
these ESTs was chosen (without replacement) to represent
the splicing of the given gene in the given human tissue. For
the gene and tissue combinations included in this analysis,
the median number of EST sequences per gene was not dra-
matically different between tissues, ranging from 25 to 35
(see Additional data file 1). The sampled ESTs for each gene
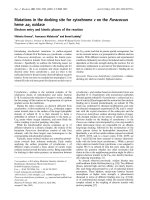
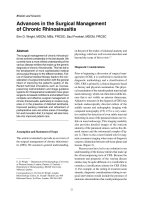
Levels of alternative splicing in 16 human tissues with moderate or high EST sequence coverageFigure 1
Levels of alternative splicing in 16 human tissues with moderate or high EST sequence coverage. Horizontal bars show the average fraction of alternatively
spliced (AS) genes of each splicing type (and estimated standard deviation) for random samplings of 20 ESTs per gene from each gene with ≥ 20 aligned EST
sequences derived from a given human tissue. The different splicing types are schematically illustrated in each subplot. (a) Fraction of AS genes containing
skipped exons, alternative 3' splice site exons (A3Es) or 5' splice site exons (A5Es), (b) fraction of AS genes containing skipped exons, (c) fraction of AS
genes containing A3Es, (d) fraction of AS genes containing A5Es.
0
20 40 60
ovary
muscle
uterus
liver
pancreas
stomach
breast
skin
kidney
colon
prostate
placenta
eye retina
lung
testis
brain
Proportion of genes with skipped exon [%]
Proportion of genes with alt. 5’ss exon [%]
Proportion of genes with alternative
3′ splice-site exons (%)
Proportion of genes with alternative
5′ splice-site exons (%)
0 10 20 30 40 50
muscle
uterus
breast
stomach
pancreas
ovary
prostate
colon
skin
eye_retina
placenta
kidney
lung
testis
liver
brain
Proportion of alternatively spliced genes [%]
Brain
Liver
Testis
Lung
kidney
Placenta
Eye-retina
Skin
Colon
Prostate
Ovary
Pancreas
Stomach
Breast
Uterus
Muscle
0
10 20 30 40 50
ovary
muscle
uterus
liver
pancreas
breast
stomach
skin
kidney
prostate
colon
placenta
eye_retina
lung
testis
brain
Proportion of genes with skipped exons [%]
Brain
Testis
Lung
Eye-retina
Placenta
Colon
Prostate
Kidney
Skin
Stomach
Breast
Pancreas
Liver
Uterus
Muscle
Ovary
0 10 20 30 40 50
breast
uterus
muscle
pancreas
stomach
colon
kidney
placenta
lung
prostate
eye_retina
testis
ovary
skin
brain
liver
Proportion of genes with alternative 3’ss exons [%]
Liver
Brain
Skin
Ovary
Testis
Eye-retina
Prostate
Lung
Placenta
Kidney
Colon
Stomach
Pancreas
Muscle
Uterus
Breast
Liver
Brain
Testis
Kidney
Placenta
Ovary
Skin
Prostate
Colon
Lung
Eye-retina
Breast
Pancreas
Stomach
Uterus
Muscle
0
30
3020 2010
40
40
50
500
10
0
30
2010
40
50
0
30
20
10
40
50
Proportion of AS genes (%) Proportion of genes with skipped exons (%)
(a) (b)
(c) (d)
R74.4 Genome Biology 2004, Volume 5, Issue 10, Article R74 Yeo et al. />Genome Biology 2004, 5:R74
were then compared to each other to identify AS events occur-
ring within the given tissue (see Materials and methods). The
random sampling was repeated 20 times and the mean frac-
tion of AS genes observed in these 20 trials was used to assess
the fraction of AS genes for each tissue (Figure 1a). Different
random subsets of a relatively large pool will have less overlap
in the specific ESTs chosen (and therefore in the specific AS
events detected) than for random subsets of a smaller pool of
ESTs, and increased numbers of ESTs give greater coverage of
exons. However, there is no reason that the expected number
of AS events detected per randomly sampled subset should
depend on the size of the pool the subset was chosen from.
While the error (standard deviation) of the measured AS fre-
quency per gene should be lower when restricting to genes
with larger minimum pools of ESTs, such a restriction would
not change the expected value. Unfortunately, the reduction
in error of the estimated AS frequency per gene is offset by an
increase in the expected error of the tissue-level AS frequency
resulting from the use of fewer genes. The inclusion of all
genes with at least 20 tissue-derived ESTs represents a rea-
sonable trade-off between these factors.
The human brain had the highest fraction of AS genes in this
analysis (Figure 1a), with more than 40% of genes exhibiting
one or more AS events, followed by the liver and testis. Previ-
ous EST-based analyses have identified high proportions of
splicing in human brain and testis tissues [29,30,32]. These
studies did not specifically control for the highly unequal rep-
resentation of ESTs from different human tissues. As larger
numbers of ESTs increase the chance of observing a larger
fraction of the expressed isoforms of a gene, the number of
available ESTs has a direct impact on estimated proportions
of AS, as seen previously in analyses comparing the levels of
AS in different organisms [31]. Thus, the results obtained in
this study confirm that the human brain and testis possess an
unusually high level of AS, even in the absence of EST-abun-
dance advantages over other tissues. We also observe a high
level of AS in the human liver, a tissue with much lower EST
coverage, where higher levels of AS have been previously
reported in cancerous cells [33,34]. Human muscle, uterus,
breast, stomach and pancreas had the lowest levels of AS
genes in this analysis (less than 25% of genes). Lowering the
minimum EST count for inclusion in this analysis from 20 to
10 ESTs, and sampling 10 (out of 10 or more) ESTs to repre-
sent each gene in each tissue, did not alter the results qualita-
tively (data not shown).
Differences in the levels of exon skipping in different
tissues
Alternatively spliced genes in this analysis exhibited on aver-
age between one and two distinct AS exons. Analyzing the dif-
ferent types of AS events separately, we found that the human
brain and testis had the highest levels of skipped exons, with
more than 20% of genes containing SEs (Figure 1b). The high
level of skipped exons observed in the brain is consistent with
previous analyses [29,30,32]. At the other extreme, the
human ovary, muscle, uterus and liver had the lowest levels of
skipped exons (about 10% of genes).
An example of a conserved exon-skipping event observed in
human and mouse brain tissue is shown in Figure 2a for the
human fragile X mental retardation syndrome-related
(FXR1) gene [35,36]. In this event, skipping of the exon alters
the reading frame of the downstream exon, presumably lead-
ing to production of a protein with an altered and truncated
carboxy terminus. The exon sequence is perfectly conserved
between the human and mouse genomes, as are the 5' splice
site and 3' splice site sequences (Figure 2a), suggesting that
this AS event may have an important regulatory role [37-39].
Differences in the levels of alternative splice site usage
in different tissues
Analyzing the proportions of AS events involving the usage of
A5Es and A3Es revealed a very different pattern (Figure 1c,d).
Notably, the fraction of genes containing A3Es was more than
twice as high in the liver as in any other human tissue studied
(Figure 1d), and the level of A5Es was also about 40-50%
higher in the liver than in any other tissue (Figure 1c). The tis-
sue with the second highest level of alternative usage for both
5' splice sites and 3' splice sites was the brain. Another group
of human tissues including muscle, uterus, breast, pancreas
and stomach - similar to the low SE frequency group above -
had the lowest level of A5Es and A3Es (less than 5% of genes
in each category). Thus, a picture emerges in which certain
human tissues such as muscle, uterus, breast, pancreas and
stomach, have low levels of AS of all types, whereas other tis-
sues, such as the brain and testis, have relatively high levels of
AS of all types and the liver has very high levels of A3Es and
A5Es, but exhibits only a modest level of exon skipping. To
our knowledge, this study represents the first systematic
analysis of the proportions of different types of AS events
occurring in different tissues. Repeating the analyses by
removing ESTs from disease-associated tissue libraries, using
available library classifications [40], gave qualitatively simi-
lar results (see Additional data files 2, 3, and 4). These data
show that ESTs derived from diseased tissues show modestly
higher frequencies of exon skipping, but the relative rankings
of tissues remain similar. The fractions of genes containing
A5Es and A3Es were not changed substantially when dis-
eased-tissue ESTs were excluded.
From the set of genes with at least 20 human liver-derived
ESTs, this analysis identified a total of 114 genes with alterna-
tive 5' splice site and/or 3' splice site usage in the liver. Those
genes in this set that were named, annotated and for which
the consensus sequences of the alternative splice sites were
conserved in the orthologous mouse gene (see Materials and
methods) are listed in Table 1. Of course, conservation of
splice sites alone is necessary, but not sufficient by itself, to
imply conservation of the AS event in the mouse. Many essen-
tial liver metabolic and detoxifying enzyme-coding genes
appear on this list, including enzymes involved in sugar
Genome Biology 2004, Volume 5, Issue 10, Article R74 Yeo et al. R74.5
comment reviews reports refereed researchdeposited research interactions information
Genome Biology 2004, 5:R74
metabolism (for example, ALDOB, IDH1), protein and amino
acid metabolism (for example, BHMT, CBP2, TDO2, PAH,
GATM), detoxification or breakdown of drugs and toxins (for
example, GSTA3, CYP3A4, CYP2C8).
Sequences and splicing patterns for two of these genes for
which orthologous mouse exons/genes and transcripts could
be identified - the genes BHMT and CYP2C8 - are shown in
detail in Figure 2b,c. In the event depicted for BHMT, the
exons involved are highly conserved between the human and
mouse orthologs (Figure 2b), consistent with the possibility
that the splicing event may have a (conserved) regulatory
role. This AS event preserves the reading frame of down-
stream exons, so the two isoforms are both likely to produce
functional proteins, differing by the insertion/deletion of 23
amino acids. In the event depicted for CYP2C8, usage of an
alternative 3' splice site removes 71 nucleotides, shifting the
reading frame and leading to a premature termination codon
in the exon (Figure 2c). In this case, the shorter alternative
transcript is a potential substrate for nonsense-mediated
decay [41,42] and the AS event may be used to regulate the
level of functional mRNA/protein produced.
Differences in splicing factor expression between
tissues
To explore the differences in splicing factor expression in dif-
ferent tissues, available mRNA expression data was obtained
from two different DNA microarray studies [43-45]. For this
trans-factor analysis, we obtained a list of 20 splicing factors
of the SR, SR-related and hnRNP protein families from pro-
teomic analyses of the human spliceosome [46-48] (see Mate-
rials and methods for the list of genes). The variation in
splicing-factor expression between pairs of tissues was stud-
ied by computing the Pearson (product-moment) correlation
coefficient (r) between the 20-dimensional vectors of splic-
ing-factor expression values between all pairs of 26 human
Figure 2
E15E14 E17
81 bp
GAGCTGAGTCTCAGAGCAGACAAAGAAACCTCCCAAGGGAAACTTTGGCTAAAAA
TCACAGTTGCAGATTATATTTCTA
CGGGAAACTTTGGCTAAAAACAAGAAAGAAATG
E16
TAA92 bp TAA
E16
||||||||||||||||||||||||
Human:
Mouse:
GAGCTGAGTCTCAGAGCAGACAAAGAAACCTCCCAA
E16
GGGAAACTTTGGCTAAAAA
|||||||||||||||||||||||||||||||||||||||||||||||||||||||
E16
CGGGAAACTTTGGCTAAAAACAAGAAAGAAATG
|||||||||||||||||||||||||||||||||
TCACAGTTGCAGATTATATTTCTA tttttctcatctttaacag
|||||||||||||||||||
tttttctcatctttaacag
intron 15
gtaaggagaatttaacctg
|||||||||||||||||||
gtaaggagaatttaacctg
intron 16
FXR1
E5E3 E4a E4b
69 bp123 bp
E4a
GGCAAGTGGCTGATGAAGGAGACGCTTTGGTTGCAGGAGGCGTGAGCCAGACGCCTTCATACCTTAG
GACAAGTGGCTGATGAAGGAGATGCTTTGGTAGCAGGAGGAGTGAGTCAGACACCTTCATACCTTAG
GTCAAAAAAGTATTTCTGCAACAGTTAGAGGTCTTTATGAAGAAGAAC
E4b E4a
CTGCAAGAGTGAAACTGAA
E4b
GTGGACTTCTTGATTGCAGAG gtaaagaaagatgtggtgaaagataagacaaatac
intron 4
ta-tactcacccattttagGGGCAGGAAGTCAATGAAGCTGCTTGCGACATCGCCC
ccctacttacccactttagGGGCAGAAAGTCAACGAAGCTGCTTGTGACATTGCAC
Human:
Mouse:
GTGAAAAAGATATTTCGCCAACAGCTAGAGGTGTTCATGAAGAAGAACCTGCAAGAGTGAGGTAGAA
|||||||||||| ||||| ||||| |||||| |||||| ||||||| || ||||||||||||
GTGGACTTCCTCATTGCAGAG gtgagcaaggg aaatccattcagaaag
||||||||| | ||||||||| || | || | || | || | |
| |||||||||||||||||||| |||||||| |||||||| ||||| ||||| ||||||||||||||
|||| ||||| ||||||||||||||||||||||||||||||||||||||||||
intron 3 E4a
BHMT
E4a E4b
90 bp71 bp
E3 E5
intron 3
ACTTTCATCCTGGGCTGTGCTCCCTGCAATGTGATCTGCTCCGTTGTTTTCCAG
ACATTCATTCTGAGCTGTGCTCCATGCAATGTCATCTGCTCCATTATTTTCCAG
E4a
GATCGTTTTGATTATAAGGATAAAGATTTTCTTATGCTCATGGAAAAACTAAAT
AAACGATTTGATTATAAAGATCAGAATTTTCTCACCCTGATGAAAAGATTCAAT
E4b
E4a
GAGAATGTCAAGATTCTGAGCTCCCCATGGTTGCAG
E4b
gtgaagtcaagaatg
Mouse:
Human:
GCTCACCTTGTGACCCC ttctaattattttctcaatcttcag
|| ||||| ||| |||||||||| |||||||| ||||||||| || ||||||||
GAAAACTTCAGGATTCTGAACTCCCCATGGATCCAGgtaaggccaagattt
tttttaaaaatttttaaatctttag CTTCACCCTGTGATCCC
|| | | | ||| | |||||| || |||||| ||||| ||
| || ||||||||||| ||| | ||||||| | || ||| ||| | | |||
|| || ||| |||||||| |||||||||| | ||||| | | ||||| |
intron 4
TGA
CYP2C8
(a)
(b)
(c)
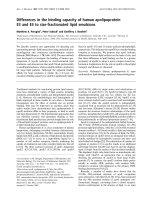
Examples of tissue-specific AS events in human genes with evidence of splice conservation in orthologous mouse genesFigure 2
Examples of tissue-specific AS events in human genes with evidence of
splice conservation in orthologous mouse genes. (a) Human fragile X
mental retardation syndrome-related (FXR1) gene splicing detected in
brain-derived EST sequences. FXR1 exhibited two alternative mRNA
isoforms differing by skipping/inclusion of exons E15 and E16. Exclusion of
E16 creates a shift in the reading-frame, which is predicted to result in an
altered and shorter carboxy terminus. The exon-skipping event is
conserved in the mouse ortholog of the human FXR1 gene, and both
isoforms were detected in mouse brain-derived ESTs. (b) Human betaine-
homocysteine S-methyltransferase (BHMT) gene splicing detected in liver-
derived ESTs. BHMT exhibited two alternative isoforms differing by
alternative 5' splice site usage in exon E4. Sequence comparisons indicate
that the exon and splice site sequences involved in both alternative 5'
splice site exon events are conserved in the mouse ortholog of the human
BHMT gene. (c) Human cytochrome P450 2C8 (CYP2C8) gene splicing.
CYP2C8 exhibited two alternative mRNA isoforms differing in the 3' splice
site usage for exon E4 (detected in ESTs derived from several tissues),
where the exclusion of a 71-base sequence creates a premature
termination codon in exon E4b. Exons and splice sites involved in the AS
event are conserved in the mouse ortholog of CYP2C8.
R74.6 Genome Biology 2004, Volume 5, Issue 10, Article R74 Yeo et al. />Genome Biology 2004, 5:R74
tissues. The DNA microarray studies analyzed 10 tissues in
addition to the 16 previously studied (Figure 3). A low value
of r between a pair of tissues indicates a low degree of con-
cordance in the relative mRNA expression levels across this
set of splicing factors, whereas a high value of r indicates
strong concordance.
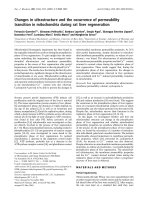
While most of the tissues examined showed a very high
degree of correlation in the expression levels of the 20 splic-
ing factors studied (typically with r > 0.75; Figure 3), the
human adult liver was clearly an outlier, with low concord-
ance in splicing-factor expression to most other tissues (typi-
cally r < 0.6, and often much lower). The unusual splicing-
Table 1
Human genes expressed in the liver with alternative 3' splice site exons (A3Es) or alternative 5' splice site exons (A5Es)
Splicing type Ensembl gene ID Gene name Exon numbers Fold-change above median
expression, HG-U95A
Fold-change above median
expression, MG-U74A
A5E;A3E 091513 Serotransferrin precursor, TF 8, 9; 4 100 100
A5E;A3E 115414 Fibronectin precursor, FN1 36; 31 10 -
A5E;A3E 117601 Antithrombin-III precursor,
SERPINC1
5; 4 100 100
A5E;A3E 136872 Fructose-bisphosphate aldolase,
ALDOB
3, 8; 4 100 10
A5E;A3E 140833 Haptoglobin-related protein
precursor, HPR
3100 10
A5E;A3E 151790 Tryptophan 2,3-dioxygenase, TDO2 3, 5; 4 10 100
A5E;A3E 171759 Phenylalanine-4-hydroxylase, PAH 6; 4,10 - 100
A5E 047457 Ceruloplasmin precursor, CP 14, 16 3 -
A5E 055957 Inter-alpha-trypsin inhibitor heavy
chain H1 precursor, ITIH1
21 100 10
A5E 111275 Aldehyde dehydrogenase, ALDH2 12 3 3
A5E 132386 Pigment epithelium-derived factor
precursor, SERPINF1
410 10
A5E 138356 Aldehyde oxidase, AOX1 27, 29 3 3
A5E 138413 Isocitrate dehydrogenase, IDH1 31 -
A5E 145692 Betaine-homocysteine S-
methyltransferase, BHMT
410 100
A5E 160868 Cytochrome P450, CYP3A4 510 10
A5E 171766 Glycine amidinotransferase, GATM 83 3
A3E 080618 Carboxypeptidase, CBP2 10 - -
A3E 080824 Heat shock protein HSP 90-alpha,
HSPCA
8- -
A3E 096087 Glutathione S-transferase, GSTA2 4, 6 10 10
A3E 106927 Protein precursor, AMBP 5, 9 100 100
A3E 110958 Telomerase-binding protein P23,
TEBP
5<1 1
A3E 134240 Hydroxymethylglutaryl-CoA
synthase, HMGCS2
810 -
A3E 138115 Cytochrome P450, CYP2C8 4100 10
A3E 145192 Alpha-2-HS-glycoprotein precursor,
AHSG
6 100 100
A3E 163631 Serum albumin precursor, ALB 9 100 100
A3E 171557 Fibrinogen gamma chain precursor,
FGG
4 100 100
A3E 174156 Glutathione S-transferase, GSTA3 4, 6 10 10
Examples of human AS genes found to exhibit A3E and/or A5E splicing with both isoforms detected in liver-derived ESTs. AS types are listed in the
first column, followed by the last six digits of the Ensembl gene number, the gene name and alternative exon numbers. The last two columns list
expression levels in human liver and mouse liver tissues, respectively, expressed in terms of the fold-change relative to the median expression level
in other tissues (from the DNA microarray data of [43] and [45], respectively).
Genome Biology 2004, Volume 5, Issue 10, Article R74 Yeo et al. R74.7
comment reviews reports refereed researchdeposited research interactions information
Genome Biology 2004, 5:R74
factor expression in the human liver was seen consistently in
data from two independent DNA microarray studies using
different probe sets (compare the two halves of Figure 3). The
low correlation observed between liver and other tissues in
splicing factor expression is statistically significant even rela-
tive to arbitrary collections of 20 genes (see Additional data
file 8). Examining the relative levels of specific splicing
factors in the human adult liver versus other tissues, the rela-
tive level of SRp30c message was consistently higher in the
liver and the relative levels of SRp40, hnRNP A2/B2 and
Srp54 messages were consistently lower. A well established
paradigm in the field of RNA splicing is that usage of alterna-
tive splice sites is often controlled by the relative concentra-
tions of specific SR proteins and hnRNP proteins [49-52].
This functional antagonism between particular SR and
hnRNP proteins is often due to competition for binding of
nearby sites on pre-mRNAs [49,53,54]. Therefore, it seems
likely that the unusual patterns of expression seen in the
human adult liver for these families of splicing factors may
contribute to the high level of alternative splice site usage
seen in this tissue. It is also interesting that splicing-factor
expression in the human fetal liver is highly concordant with
most other tissues, but has low concordance with the adult
liver (Figure 3). This observation suggests that substantial
changes in splicing-factor expression may occur during
human liver development, presumably leading to a host of
changes in the splicing patterns of genes expressed in human
liver. Currently available EST data were insufficient to allow
systematic analysis of the patterns of AS in fetal relative to
adult liver.
An important caveat to these results is that the DNA microar-
ray data used in this analysis measure mRNA expression lev-
els rather than protein levels or activities. The relation
between the amount of mRNA expressed from a gene and the
concentration of the corresponding protein has been exam-
ined previously in several studies in yeast as well as in human
and mouse liver tissues [55-58]. These studies have generally
found that mRNA expression levels correlate positively with
protein concentrations, but with fairly wide divergences for a
significant fraction of genes.
Over-represented motifs in alternative exons in the
human brain, testis and liver
The unusually high levels of alternative splicing seen in the
human brain, testis and liver prompted us to search for can-
didate tissue-specific splicing regulatory motifs in AS exons in
genes expressed in each of these tissues. Using a procedure
similar to Brudno et al. [59], sequence motifs four to six bases
long that were significantly enriched in exons skipped in AS
genes expressed in the human brain relative to constitutive
exons in genes expressed in the brain were identified. These
sequences were then compared to each other and grouped
into seven clusters, each of which shared one or two four-base
motifs (Table 2). The motifs in cluster BR1 (CUCC, CCUC)
resemble the consensus binding site for the polypyrimidine
tract-binding protein (PTB), which acts as a repressor of
splicing in many contexts [60-63]. A similar motif (CNCUC-
CUC) has been identified in exons expressed specifically in
the human brain [29]. The motifs in cluster BR7 (containing
UAGG) are similar to the high-affinity binding site UAGGG
[A/U], identified for the splicing repressor protein hnRNP A1
by SELEX experiments [64]. The consensus sequences for the
remaining clusters BR2 to BR6 (GGGU, UGGG, GGGA,
CUCA, UAGC, respectively), as well as BR7, all resembled
motifs identified in a screen for exonic splicing silencers
(ESSs) in cultured human cells (Z. Wang and C.B.B., unpub-
lished results), suggesting that most or all of the motifs BR1 to
BR7 represent sequences directly involved in mediating exon
skipping. In particular, G-rich elements, which are known to
act as intronic splicing enhancers [65,66], may function as
silencers of splicing when present in an exonic context.
A comparison of human testis-derived skipped exons to exons
constitutively included in genes expressed in the testis identi-
fied only a single cluster of sequences, TE1, which share the
tetramer UAGG. Enrichment of this motif, common to the
brain-specific cluster BR7, suggests a role for regulation of
exon skipping by hnRNP A1 - or a trans-acting factor with
similar binding preferences - in the testis.
Correlation of mRNA expression levels of 20 known splicing factors (see Materials and methods) across 26 human tissues (lower diagonal: data from Affymetrix HU-133A DNA microarray experiment [45]; upper diagonal: data from Affymetrix HU-95A DNA microarray experiment [43])Figure 3
Correlation of mRNA expression levels of 20 known splicing factors (see
Materials and methods) across 26 human tissues (lower diagonal: data
from Affymetrix HU-133A DNA microarray experiment [45]; upper
diagonal: data from Affymetrix HU-95A DNA microarray experiment
[43]). Small squares are colored to represent the extent of the correlation
between the mRNA expression patterns of the 20 splicing factor genes in
each pair of tissues (see scale at top of figure).
Cerebellum
Whole brain
Caudate nucleus
Amygdala
Thalamus
Spinal cord
Whole blood
Testes
Pancreas
Placenta
Pituitary gland
Thyroid
Prostate
Ovary
Uterus
DRG
Salivary gland
Trachea
Lung
Thymus
Adrenal gland
Kidney
Fetal liver
Liver
Heart
HG-U133
HG-U95
0 0.25 0.5 0.75 1
Fetal brain
Cerebellum
Whole brain
Caudate nucleus
Amygdala
Thalamus
Spinal cord
Whole blood
Testes
Pancreas
Placenta
Pituitary gland
Thyroid
Prostate
Ovary
Uterus
DRG
Salivary gland
Trachea
Lung
Thymus
Adrenal gland
Kidney
Fetal liver
Liver
Heart
Fetal brain
R74.8 Genome Biology 2004, Volume 5, Issue 10, Article R74 Yeo et al. />Genome Biology 2004, 5:R74
Table 2
Sequence motifs enriched in skipped exons (SEs) and alternative 5' splice site exons (A5Es)
AS type /tissue (motif name) Oligonucleotides Occurrences Consensus (% of exons containing)
SE/brain (BR1) CUCCUG 169 CUCC (45.3)
CUCCU 323
CUCCC 264
CUCC 945
CCUCCC 137 CCUC (41.0)
CCUCC 363
CCUC 1021
GCCUCC 136
GCCUC 375
GCCUCA 122
GGCCUC 118
UGCCUC 108
SE/brain (BR2) GGGUU 97 GGGU (25.6)
GGGU 411
AGGGU 116
SE/brain (BR3) UGGGA 324 UGGG (47.2)
UGGG 948
CUGGG 426
CCUGGG 171
SE/brain (BR4) GGGAUU 58 GGGA (45.5)
GGGAU 176
GGGA 840
SE/brain (BR5) CUCA 925 CUCA (46.5)
CUCAC 206
GCCUCA 122
GGCUCA 102
GCUCAC 79
CUCAGC 126
SE/brain (BR6) UAGC 269 UAGC (18.0)
UAGCU 106
GUAGC 96
GUAGCU 51
AGUAGC 47
UAGCUG 54
SE/brain (BR7) UAGG 186 UAGG (13.8)
UUAGG 63
UUAGGG 24
SE/testis (TE1) UAGG 99 UAGG (16.6)
UUAGG 33
Genome Biology 2004, Volume 5, Issue 10, Article R74 Yeo et al. R74.9
comment reviews reports refereed researchdeposited research interactions information
Genome Biology 2004, 5:R74
Alternative splice site usage gives rise to two types of exon
segments - the 'core' portion common to both splice forms
and the 'extended' portion that is present only in the longer
isoform. Two clusters of sequence motifs enriched in the core
sequences of A5Es in genes expressed in the liver relative to
the core segments of A5Es resulting from alignments of non-
liver-derived ESTs were identified - LI1 and LI2. Both are
adenosine-rich, with consensus tetramers AAAC and UAAA,
respectively. The former motif matches a candidate ESE
motif identified previously using the computational/experi-
mental RESCUE-ESE approach (motif 3F with consensus
[AG]AA [AG]C) [19]. The enrichment of a probable ESE motif
in exons exhibiting alternative splice site usage in the liver is
consistent with the model that such splicing events are often
controlled by the relative levels of SR proteins (which bind
many ESEs) and hnRNP proteins. Insufficient data were
available for the analysis of motifs in the extended portions of
liver A5Es (which tend to be significantly shorter than the
core regions) or for the analysis of liver A3Es.
A measure of dissimilarity between mRNA isoforms
To quantify the differences in splicing patterns between
mRNAs or ESTs derived from a gene locus, a new measure
called the splice junction difference ratio (SJD) was devel-
oped. For any pair of mRNAs/ESTs that align to overlapping
portions of the same genomic locus, the SJD is defined as the
proportion of splice junctions present in both transcripts that
differ between them, including only those splice junctions
that occur in regions of overlap between the transcripts (Fig-
ure 4). The SJD varies between zero and one, with a value of
zero for any pair of transcripts that have identical splice junc-
tions in the overlapping region (for example, transcripts 2
and 5 in Figure 4, or for two identical transcripts), and has a
value of 1.0 for two transcripts whose splice junctions are
completely different in the regions where they overlap (for
example, transcripts 1 and 2 in Figure 4). For instance, tran-
scripts 2 and 3 in Figure 4 differ in the 3' splice site used in the
second intron, yielding an SJD value of 2/4 = 0.5, whereas
transcripts 2 and 4 differ by skipping/inclusion of an
alternative exon, which affects a larger fraction of the introns
in the two transcripts and therefore yields a higher SJD value
of 3/5 = 0.6.
The SJD value can be generalized to compare splicing pat-
terns between two sets of transcripts from a gene - for exam-
ple, to compare the splicing patterns of the sets of ESTs
derived from two different tissues. In this case, the SJD is
defined by counting the number of splice junctions that differ
between all pairs of transcripts (i, j), with transcript i coming
from set 1 (for example, heart-derived ESTs), and transcript j
coming from set 2 (for example, lung-derived ESTs), and
dividing this number by the total number of splice junctions
in all pairs of transcripts compared, again considering only
those splice junctions that occur in regions of overlap
between the transcript pairs considered. Note that this defini-
tion has the desirable property that pairs of transcripts that
have larger numbers of overlapping splice junctions contrib-
ute more to the total than transcript pairs that overlap less. As
an example of the splice junction difference between two sets
of transcripts, consider the set S1, consisting of transcripts
(1,2) from Figure 4, and set S2, consisting of transcripts (3,4)
from Figure 4. Using the notation introduced in Figure 4,
SJD(S1,S2) = d(S1,S2) / t(S1,S2) = [d(1,3) + d(1,4) + d(2,3) +
d(2,4)]/ [t(1,3) +t(1,4) + t(2,3) + t(2,4)] = [3 + 4 + 2 + 3]/ [3
+ 4 + 4 + 5] = 12/16 = 0.75, reflecting a high level of
dissimilarity between the isoforms in these sets, whereas the
SJD falls to 0.57 for the more similar sets S1 = transcripts
(1,2) versus S3 = transcripts (2,3). Note that in cases where
multiple similar/identical transcripts occur in a given set, the
SJD measure effectively weights the isoforms by their abun-
dance, reflecting an average dissimilarity when comparing
randomly chosen pairs of transcripts from the two tissues.
For example, the SJD computed for the set S4 = (1,2,2,2,2),
that is, one transcript aligning as transcript 1 in Figure 4 and
four transcripts aligning as transcript 2, and the set S5 =
(2,2,2,2,3) is 23/95 = 0.24, substantially lower than the SJD
value for sets S1 versus S3 above, reflecting the higher frac-
tion of identically spliced transcripts between sets S4 and S5.
Core A5E/liver (LI1) AAAC 42 AAAC (53.3)
AAAAC 18
Core A5E/liver (LI2) UAAA 29 UAAA (40.0)
UAAACC 5
Sequence motifs of length four to six bases that are significantly over-represented (p < 0.002) in SEs relative to constitutively spliced exons from
brain- or testis-derived ESTs are shown, followed by the number of occurrences in SEs in these tissues. Sequence motifs are grouped/aligned by
similarity, and shared tetramers are shown in bold and listed in the last column, followed by the fraction of SEs that contain the given tetramer.
Sequence motifs significantly over-represented (p < 0.01) in the core of A5Es from human liver-derived ESTs are shown at the bottom, followed by
the number of A5E occurrences and the fraction of A5Es that contain the given tetramer. Statistical significance was evaluated as described in
Materials and methods.
Table 2 (Continued)
Sequence motifs enriched in skipped exons (SEs) and alternative 5' splice site exons (A5Es)
R74.10 Genome Biology 2004, Volume 5, Issue 10, Article R74 Yeo et al. />Genome Biology 2004, 5:R74
Global comparison of splicing patterns between tissues
To make a global comparison of patterns of splicing between
two different human tissues, a tissue-level SJD value was
computed by comparing the splicing patterns of ESTs from all
genes for which at least one EST was available from cDNA
libraries representing both tissues. The 'inter-tissue' SJD
value is then defined as the ratio of the sum of d(S
A
,S
B
) values
for all such genes, divided by the sum of t(S
A
,S
B
) values for all
of these genes, where S
A
and S
B
refer to the set of ESTs for a
gene derived from tissues A and B, respectively, and d(S
A
,S
B
)
and t(S
A
,S
B
) are defined in terms of comparison of all pairs of
ESTs from the two sets as described above. This analysis uses
all available ESTs for each gene in each tissue (rather than
samples of a fixed size). A large SJD value between a pair of
tissues indicates that mRNA isoforms of genes expressed in
the two tissues tend to be more dissimilar in their splicing
patterns than is the case for two tissues with a smaller inter-
tissue SJD value. This definition puts greater weight on those
genes for which more ESTs are available.
The SJD values were then used to globally assess tissue-level
differences in alternative splicing. A set of 25 human tissues
for which at least 20,000 genomically aligned ESTs were
available was compiled for this comparison (see Materials
and methods) and the SJD values were then computed
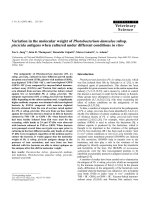
between all pairs of tissues in this set (Figure 5a). A clustering
of human tissues on the basis of their inter-tissue SJD values
(Figure 5b) identified groups of tissues that cluster together
very closely (for example, the ovary/thyroid/breast cluster,
the heart/lymph cluster and the bone/B-cell cluster), while
other tissues including the brain, pancreas, liver, peripheral
nervous system (PNS) and placenta occur as outgroups.
These results complement a previous clustering analysis
based on data from microarrays designed to detect exon skip-
ping [24]. Calculating the mean SJD value for a given tissue
when compared to the remaining 24 tissues (Figure 5c) iden-
tified a set of human tissues including the ovary, thyroid,
breast, heart, bone, B-cell, uterus, lymph and colon that have
'generic' splicing patterns which are more similar to most
other tissues. As expected, many of these tissues with generic
splicing patterns overlap with the set of tissues that have low
levels of AS (Figure 1). On the other hand, another group of
tissues including the human brain, pancreas, liver and
peripheral nervous system, have highly 'distinctive' splicing
patterns that differ from most other tissues (Figure 5c). Many
of these tissues were identified as having high proportions of
AS in Figure 1. Taken together, these observations suggest
that specific human tissues such as the brain, testis and liver,
make more extensive use of AS in gene regulation and that
these tissues have also diverged most from other tissues in the
set of spliced isoforms they express. Although we are not
aware of reliable, quantitative data on the relative abundance
of different cell types in these tissues, a greater diversity of
cell types is likely to contribute to higher SJD values for many
of these tissues.
Conclusions
The systematic analysis of transcripts generated from the
human genome is just beginning, but promises to deepen our
understanding of how changes in the program of gene expres-
sion contribute to development and differentiation. Here, we
have observed pronounced differences between human tis-
sues in the set of alternative mRNA isoforms that they
express. Because our approach normalizes the EST coverage
per gene in each tissue, there is higher confidence that these
differences accurately reflect differences in splicing patterns
between tissues. As human tissues are generally made up of a
mixture of cell types, each of which may have its own unique
pattern of gene expression and splicing, it will be important in
the future to develop methods for systematic analysis of tran-
scripts in different human cell types.
Understanding the mechanisms and regulatory consequences
of AS will require experimental and computational analyses
at many levels. At its core, AS involves the generation of
alternative transcripts mediated by interactions between cis-
regulatory elements in exons or introns and trans-acting
splicing factors. The current study has integrated these three
elements, inferring alternative transcripts from EST-genomic
alignments, identifying candidate regulatory sequence motifs
enriched in alternative exons from different tissues, and ana-
lyzing patterns of splicing-factor expression in different
Computation of splice junction difference ratio (SJD)Figure 4
Computation of splice junction difference ratio (SJD). The SJD value for a
pair of transcripts is computed as the number of splice junctions in each
transcript that are not represented in the other transcript, divided by the
total number of splice junctions in the two transcripts, in both cases
considering only those splice junctions that occur in portions of the two
transcripts that overlap (see Materials and methods for details). SJD value
calculations for different combinations of the transcripts shown in the
upper part of the figure are also shown.
d(i,j) Number of splice junctions
that differ between transcripts i,j
t(i,j) Total number of splice junctions
in transcripts i,j
1
2
3
4
5
E1
E3
E5a
E2 E5b
E4
Transcript
Transcripts
SJD (i,j)
i j
1 2 3/3 = 1
2 3 2/4 = 0.5
2 4 3/5 = 0.6
1 4 4/4 = 1
2 5 0/4 = 0SJD(i,j) = d (i,j)/t(i,j)
Genome Biology 2004, Volume 5, Issue 10, Article R74 Yeo et al. R74.11
comment reviews reports refereed researchdeposited research interactions information
Genome Biology 2004, 5:R74
tissues. Our results emphasize differences in the frequencies
of exon skipping versus alternative splice site usage in differ-
ent tissues and highlight the liver, brain and testis as having
particularly high levels of AS, supporting the idea that tissue-
regulated AS plays important roles in the differentiation of
these tissues. The high levels of alternative splice site usage in
the liver may relate to the unusual patterns of splicing-factor
expression observed in the adult liver, suggesting aspects of
developmental regulation of AS at the tissue level. Obtaining
a more comprehensive picture of AS will require the integra-
tion of additional types of data upstream and downstream of
these core interactions. Upstream, splicing factors them-
selves may be differentially regulated in different tissues or in
response to different stimuli at the level of transcription,
splicing, or translation, and are frequently regulated by post-
translational modifications such as phosphorylation, so sys-
tematic measurements of splicing factor levels and activities
will be required. Downstream, AS may affect the stability of
alternative transcripts (for example, in cases of messages sub-
ject to nonsense-mediated mRNA decay), and frequently
alters functional properties of the encoded proteins, so sys-
tematic measurements of AS transcript and protein isoforms
and functional assays will also be needed to fully understand
the regulatory consequences of AS events. Ultimately, it will
be important to place regulatory events involving AS into the
context of regulatory networks involving control at the levels
of transcription, translation and post-translational
modifications.
Materials and methods
Data and resources
Chromosome assemblies of the human genome (hg13) were
obtained from public databases [67]. Transcript databases
included approximately 94,000 human cDNA sequences
obtained from GenBank (release 134.0, gbpri and gbhtc cate-
gories), and approximately 5 million human expressed
sequence tags (ESTs) from dbEST (repository 02202003).
Human ESTs were designated according to their cDNA
library source (in total about 800) into different tissue types.
Pertinent information about cDNA libraries and the corre-
sponding human tissue or cell line was extracted from dbEST
and subsequently integrated with library information
retrieved from the Mammalian Gene Collection Initiative
(MGC) [68], the Integrated Molecular Analysis of Gene
Expression Consortium (IMAGE) [69] and the Cancer
Figure 5
012345
ovary
thyroid
breast
heart
lymph
kidney
colon
uterus
bone
b cell
eye retina
lung
head
blood
germ
skin
stomach
prostate
testis
muscle
placenta
nervous
liver
pancreas
brain
SJR (x 10
3
)
Brain
Pancreas
Liver
PNS
Placenta
Muscle
Testis
Prostate
Stomach
Skin
Germ
Blood
Head-neck
Lung
Eye-Retina
B-cell
Bone
Uterus
Colon
Kidney
Lymph
Heart
Breast
Thyroid
Ovary
Brain
Pancreas
Liver
PNS
Placenta
Muscle
Testis
Prostate
Stomach
Skin
Germ
Blood
Head-neck
Lung
Eye-retina
B-cell
Bone
Uterus
Colon
Kidney
Lymph
Heart
Breast
Thyroid
Ovary
Brain
Pancreas
Liver
PNS
Placenta
Muscle
Testis
Prostate
Stomach
Skin
Germ
Blood
Head-neck
Lung
Eye-retina
B-cell
Bone
Uterus
Colon
Kidney
Lymph
Heart
Breast
Thyroid
Ovary
Brain
Pancreas
Liver
PNS
Placenta
Muscle
Testis
Prostate
Stomach
Skin
Germ
Blood
Head-neck
Lung
Eye-retina
β-cell
Bone
Uterus
Colon
Kidney
Lymph
Heart
Breast
Thyroid
Ovary
10
9
8
7
6
5
4
3
2
1
0
Mean SJD (x 10
−3
)
SJD (x 10
−3
)
SJD versus other tissues (x 10
−3
)
012345
012345
(a)
(b)
(c)
Comparison of alternative mRNA isoforms across 25 human tissuesFigure 5
Comparison of alternative mRNA isoforms across 25 human tissues. (a)
Color-coded representation of SJD values between pairs of tissues (see
Figure 4 and Materials and methods for definition of SJD). (b) Hierarchical
clustering of SJD values using average-linkage clustering. Groups of tissues
in clusters with short branch lengths (for example, thyroid/ovary, B-cell/
bone) have highly similar patterns of AS. (c) Mean SJD values (versus
other 24 tissues) for each tissue.
R74.12 Genome Biology 2004, Volume 5, Issue 10, Article R74 Yeo et al. />Genome Biology 2004, 5:R74
Genome Anatomy Project (CGAP) [70]. Library information
obtained from MGC, IMAGE and CGAP is provided in Addi-
tional data file 5.
Genome annotation by alignment of spliced transcripts
The GENOA genome annotation script [71] was used to align
spliced cDNA and EST sequences to the human genome.
GENOA uses BLASTN to detect significant blocks of identity
between repeat-masked cDNA sequences and genomic DNA,
and then aligns cDNAs to the genomic loci identified by
BLASTN using the spliced-alignment algorithm MRNAVS-
GEN [71]. This algorithm is similar in concept to SIM4 [72]
but was developed specifically to align high-quality cDNAs
rather than ESTs and thus requires higher alignment quality
(at least 93% identity) and consensus terminal dinucleotides
at the ends of all introns (that is, GT AG, GC AG or AT AC).
EST sequences were aligned using SIM4 to those genomic
regions that had aligned cDNAs. Stringent alignment criteria
were imposed: ESTs were required to overlap cDNAs (so that
all the genes studied were supported by at least one cDNA-
genomic alignment); the first and last aligned segments of
ESTs were required to be at least 30 nucleotides in length,
with at least 90% sequence identity; and the entire EST
sequence alignment was required to extend over at least 90%
of the length of the EST with at least 90% sequence identity.
In total, GENOA aligned about 85,900 human cDNAs and
about 890,300 ESTs to the human genome. The relatively low
fraction of aligned ESTs (about 18%), and average aligned
length of about 550 bases (the average lengths were not sig-
nificantly different between different tissues, see Additional
data file 6), reflect the stringent alignment-quality criteria
that were imposed so as to be as confident as possible in the
inferred splicing patterns. The aligned sequences yielded
about 17,800 gene regions with more than one transcript
aligned that exhibited a multi-exon structure. Of these, about
60% exhibited evidence of alternative splicing of internal
exons. Our analysis did not examine differences in 3'-termi-
nal and 5'-terminal exons, inclusion of which is frequently
dictated by alternative polyadenylation or alternative tran-
scription start sites and therefore does not represent 'pure' AS
[73,74]. The EST alignments were then used to categorize all
internal exons as: constitutive exons; A3Es, A5Es, skipped
exons, multiply alternatively spliced exons (for example,
exons that exhibited both skipping and alternative 5' splice
site usage), and exons that contained retained introns. An
internal exon present in at least one transcript was identified
as a skipped exon if it was precisely excluded in one or more
other transcripts, such that the boundaries of both the 5' and
3' flanking exons were the same in the transcripts that
included and skipped the exon (for example, exon E3 in Fig-
ure 1). Similarly, an internal exon present in at least one tran-
script was identified as an A3E or A5E if at least one other
transcript contained an exon differing in length by the use of
an alternative 3' splice site or 5' splice site. The 'core' of an
A3E or A5E is defined as the exon portion that is common to
all transcripts used to infer the AS event. The extension of an
alternatively spliced exon is the exon portion added to the
core region by the use of an alternative 3' splice site or 5' splice
site) that is present in some, but not all transcripts used to
infer the AS event. Pairs of inferred A3Es or A5Es differing by
fewer than six nucleotides were excluded from further analy-
sis, as in [8], because of the possibility that such small differ-
ences might sometimes result from EST sequencing or
alignment errors. As the frequency of insertion-deletions
errors greater than three bases using modern sequencing
techniques is vanishingly small (P. Green, personal commu-
nication), a six-base cutoff should exclude the vast majority of
such errors. Alternatively spliced exons/genes identified in
specific tissues are available for download from the GENOA
website [71].
Quantifying splice junction differences between
alternative mRNA isoforms
To quantify the difference in splicing patterns between
mRNAs or ESTs derived from a gene locus, the splice junction
difference ratio (SJD) was calculated. For any pair of
mRNAs/ESTs that have been aligned to overlapping portions
of a genomic locus, the SJD is defined as the fraction of the
splice junctions that occur in overlapping portions of the two
transcripts that differ in one or both splice sites. A sample cal-
culation is given in Figure 4. The SJD measure was calculated
by taking the ratio of the number of 'valid' splice junctions
that differ between two sequences over the total number of
splice junctions, when comparing a pair of ESTs across all
splice junctions present in overlapping portions of the two
transcripts. A splice junction was considered valid if: the 5'
splice site and the 3' splice site satisfied either the GT AG or
the GC AG dinucleotide sequences at exon-intron junctions;
and if the splice junction was observed at least twice in differ-
ent transcripts.
Identification of candidate splicing regulatory motifs
Over-represented sequence motifs (k-mers) were identified
by comparing the number of occurrences of k-mers (for k in
the range of 4 to 6 bases) in a test set of alternative exons
versus a control set. In this analysis, monomeric tandem
repeats (for example, poly(A) sequences) were excluded. The
enrichment score of candidate k-mers in the test set versus
the control set was evaluated by computing χ
2
(chi-squared)
values with a Yates correction term [75], using an approach
similar in spirit to that described by Brudno et al. [59]. We
randomly sampled 500 subsets of the same size as the test set
from the control set. The enrichment scores for k-mers over-
represented in the sampled subset versus the remainder of
the control set were computed as above. The estimated p-
value for observing the given enrichment score (χ
2
-value)
associated with an over-represented sequence motif of length
k was defined as the fraction of subsets that contained any k-
mer with enrichment score (χ
2
-value) higher than the tested
motif. Correcting for multiple testing is not required as the p-
value was defined relative to the most enriched k-mer for each
Genome Biology 2004, Volume 5, Issue 10, Article R74 Yeo et al. R74.13
comment reviews reports refereed researchdeposited research interactions information
Genome Biology 2004, 5:R74
sampled set. For sets of skipped exons from human brain-
and testis-derived EST sequences, the test sets comprised
1,265 and 517 exons skipped in brain- and testis-derived
ESTs, respectively, and the control sets comprised 12,527 and
8,634 exons constitutively included in human brain- and tes-
tis-derived ESTs, respectively. Candidate sequence motifs in
skipped exons from brain and testis-derived ESTs with asso-
ciated p-values less than 0.002 were retained. For the set of
A5E and A3E events from human liver-derived EST
sequences, the test set comprised 44 A3Es and 45 A5Es, and
the control set comprised 1,619 A3Es and 1,481 A5Es identi-
fied using ESTs from all tissues excluding liver. In this analy-
sis, A3Es and A5Es with extension sequences of less than 25
bases were excluded and sequences longer than 150 bases
were truncated to 150 bases, by retaining the exon sequence
segment closest to the internal alternative splice junction.
Over-represented sequence motifs in A3Es and A5Es from
liver-derived EST sequences with associated p-values less
than 0.01 were retained.
Gene-expression analysis of trans-acting splicing factors
SR proteins, SR-related proteins, and hnRNPs were derived
from published proteomic analyses of the spliceosome [46-
48]. Expression values for these genes were obtained from the
'gene expression atlas' using the HG-U95A DNA microarray
[43] and from a similar set of expression data using the HG-
U133A DNA microarray [45]. Altogether, 20 splicing factors -
ASF/SF2, SRm300, SC35, SRp40, SRp55, SRp30c, 9G8,
SRp54, SFRS10, SRp20, hnRNPs A1, A2/B2, C, D, G, H1, K,
L, M, and RALY - were studied in 26 different tissues present
in both microarray experiments (Figure 5). The data from
each gene chip - HG-U95A and HG-U133A - were analyzed
separately. The average difference (AD) value of each probe
was used as the indicator of expression level. In analyzing
these microarray data, AD values smaller than 20 were stand-
ardized to 20, as in [43]. When two or more probes mapped
to a single gene, the values from those probes were averaged.
Pearson (product-moment) correlation coefficients between
20-dimensional vectors for all tissue pairs were calculated,
using data from each of the two DNA microarray studies
separately.
Additional data files
Additional data files containing the following supplementary
data, tables and figures are available with the online version
of this paper and from the GENOA genome annotation web-
site [71]. The lists of GenBank accession numbers of human
cDNAs and ESTs that were mapped to the human genome by
the GENOA pipeline, GENOA gene locus identifiers, and gene
loci with spliced alignments for the 22 human autosomes and
two sex chromosomes are provided at our website [76]. Sets
of constitutive and alternative exons in genes expressed in the
human brain, testis and liver, and control sets used are also
provided [77]. Additional data file 1 lists the average and
median number of ESTs per gene and tissue, and the total
number of genes per tissue using different minimum num-
bers of ESTs. Additional data file 2 lists the average total
number of AS genes and AS genes containing SEs, A3Es and
A5Es using ESTs derived from normal, non-diseased tissues.
Additional data file 3 lists the number of constitutively spliced
and AS genes, and AS genes containing SEs, A3Es and A5Es.
Additional data file 4 shows the average fractions of AS genes
and average fractions of AS genes containing SEs, A3Es and
A5Es using ESTs derived from normal, non-disease-derived
tissues. Additional data file 5 lists categories of cDNA librar-
ies and designated tissues derived from the MGC, IMAGE and
CGAP. Additional data file 6 shows the average lengths of
ESTs that aligned to gene loci expressed in different tissues.
Additional data file 7 lists human splicing factors of SR, SR-
related and hnRNP genes, corresponding Ensembl gene num-
bers and Affymetrix microarray probe identification num-
bers. Additional data file 8 shows the distribution of the
average Pearson correlation coefficient values across differ-
ent tissues for expression levels of random sets of genes
obtained from the Affymetrix microarray data.
Additional data file 1The average and median number of ESTs per gene and tissue, and the total number of genes per tissue using different minimum num-bers of ESTsThe average and median number of ESTs per gene and tissue, and the total number of genes per tissue using different minimum num-bers of ESTsClick here for additional data fileAdditional data file 2The average total number of AS genes and AS genes containing SEs, A3Es and A5Es using ESTs derived from normal, non-diseased tissuesThe average total number of AS genes and AS genes containing SEs, A3Es and A5Es using ESTs derived from normal, non-diseased tissuesClick here for additional data fileAdditional data file 3The number of constitutively spliced and AS genes, and AS genes containing SEs, A3Es and A5EsThe number of constitutively spliced and AS genes, and AS genes containing SEs, A3Es and A5EsClick here for additional data fileAdditional data file 4The average fractions of AS genes and average fractions of AS genes containing SEs, A3Es and A5Es using ESTs derived from normal, non-disease-derived tissuesThe average fractions of AS genes and average fractions of AS genes containing SEs, A3Es and A5Es using ESTs derived from normal, non-disease-derived tissuesClick here for additional data fileAdditional data file 5Categories of cDNA libraries and designated tissues derived from the MGC, IMAGE and CGAPCategories of cDNA libraries and designated tissues derived from the MGC, IMAGE and CGAPClick here for additional data fileAdditional data file 6The average lengths of ESTs that aligned to gene loci expressed in different tissuesThe average lengths of ESTs that aligned to gene loci expressed in different tissuesClick here for additional data fileAdditional data file 7Human splicing factors of SR, SR-related and hnRNP genes, corre-sponding Ensembl gene numbers and Affymetrix microarray probe identification numbersHuman splicing factors of SR, SR-related and hnRNP genes, corre-sponding Ensembl gene numbers and Affymetrix microarray probe identification numbersClick here for additional data fileAdditional data file 8The distribution of the average Pearson correlation coefficient val-ues across different tissues for expression levels of random sets of genes obtained from the Affymetrix microarray dataThe distribution of the average Pearson correlation coefficient val-ues across different tissues for expression levels of random sets of genes obtained from the Affymetrix microarray datatClick here for additional data file
Acknowledgements
We thank T. Poggio and P. Sharp for stimulating discussions and the anon-
ymous reviewers for constructive suggestions. This work was supported by
grants from the National Science Foundation and the National Institutes of
Health (C.B.B.), and by a Lee Kuan Yew fellowship (G.Y.) and a Whiteman
fellowship (G.K.).
References
1. Black DL: Mechanisms of alternative pre-messenger RNA
splicing. Annu Rev Biochem 2003, 72:291-336.
2. Cartegni L, Chew SL, Krainer AR: Listening to silence and under-
standing nonsense: exonic mutations that affect splicing. Nat
Rev Genet 2002, 3:285-298.
3. Graveley BR: Alternative splicing: increasing diversity in the
proteomic world. Trends Genet 2001, 17:100-107.
4. Lopez AJ: Alternative splicing of pre-mRNA: developmental
consequences and mechanisms of regulation. Annu Rev Genet
1998, 32:279-305.
5. Grabowski PJ: Genetic evidence for a Nova regulator of alter-
native splicing in the brain. Neuron 2000, 25:254-256.
6. Zavolan M, Kondo S, Schonbach C, Adachi J, Hume DA, Hayashizaki
Y, Gaasterland T, RIKEN GER Group, GSL members: Impact of
alternative initiation, splicing, and termination on the diver-
sity of the mRNA transcripts encoded by the mouse
transcriptome. Genome Res 2003, 13:1290-1300.
7. Mironov AA, Fickett JW, Gelfand MS: Frequent alternative splic-
ing of human genes. Genome Res 1999, 9:1288-1293.
8. Modrek B, Resch A, Grasso C, Lee C: Genome-wide detection of
alternative splicing in expressed sequences of human genes.
Nucleic Acids Res 2001, 29:2850-2859.
9. Modrek B, Lee C: A genomic view of alternative splicing. Nat
Genet 2002, 30:13-19.
10. Kan Z, States D, Gish W: Selecting for functional alternative
splices in ESTs. Genome Res 2002, 12:1837-1845.
11. Brett D, Hanke J, Lehmann G, Haase S, Delbruck S, Krueger S, Reich
J, Bork P: EST comparison indicates 38% of human mRNAs
contain possible alternative splice forms. FEBS Lett 2000,
474:83-86.
12. Faustino NA, Cooper TA: Pre-mRNA splicing and human
disease. Genes Dev 2003, 17:419-437.
13. Modafferi EF, Black DL: A complex intronic splicing enhancer
from the c-src pre-mRNA activates inclusion of a heterolo-
gous exon. Mol Cell Biol 1997, 17:6537-6545.
14. Naor D, Nedvetzki S, Golan I, Melnik L, Faitelson Y: CD44 in
cancer. Crit Rev Clin Lab Sci 2002, 39:527-579.
R74.14 Genome Biology 2004, Volume 5, Issue 10, Article R74 Yeo et al. />Genome Biology 2004, 5:R74
15. MacDougall C, Harbison D, Bownes M: The developmental con-
sequences of alternate splicing in sex determination and dif-
ferentiation in Drosophila. Dev Biol 1995, 172:353-376.
16. Ladd AN, Charlet N, Cooper TA: The CELF family of RNA bind-
ing proteins is implicated in cell-specific and
developmentally regulated alternative splicing. Mol Cell Biol
2001, 21:1285-1296.
17. Jensen KB, Dredge BK, Stefani G, Zhong R, Buckanovich RJ, Okano
HJ, Yang YY, Darnell RB: Nova-1 regulates neuron-specific
alternative splicing and is essential for neuronal viability. Neu-
ron 2000, 25:359-371.
18. Lim LP, Burge CB: A computational analysis of sequence fea-
tures involved in recognition of short introns. Proc Natl Acad Sci
USA 2001, 98:11193-11198.
19. Fairbrother WG, Yeh RF, Sharp PA, Burge CB: Predictive identifi-
cation of exonic splicing enhancers in human genes. Science
2002, 297:1007-1013.
20. Liu HX, Zhang M, Krainer AR: Identification of functional exonic
splicing enhancer motifs recognized by individual SR
proteins. Genes Dev 1998, 12:1998-2012.
21. Schaal TD, Maniatis T: Selection and characterization of pre-
mRNA splicing enhancers: identification of novel SR protein-
specific enhancer sequences. Mol Cell Biol 1999, 19:1705-1719.
22. Tian H, Kole R: Strong RNA splicing enhancers identified by a
modified method of cycled selection interact with SR
protein. J Biol Chem 2001, 276:33833-33839.
23. Zhu J, Shendure J, Mitra RD, Church GM: Single molecule profil-
ing of alternative pre-mRNA splicing. Science 2003,
301:836-838.
24. Johnson JM, Castle J, Garrett-Engele P, Kan Z, Loerch PM, Armour
CD, Santos R, Schadt EE, Stoughton R, Shoemaker DD: Genome-
wide survey of human alternative pre-mRNA splicing with
exon junction microarrays. Science 2003, 302:2141-2144.
25. Hu GK, Madore SJ, Moldover B, Jatkoe T, Balaban D, Thomas J, Wang
Y: Predicting splice variant from DNA chip expression data.
Genome Res 2001, 11:1237-1245.
26. Clark TA, Sugnet CW, Ares M Jr: Genome-wide analysis of
mRNA processing in yeast using splicing-specific
microarrays. Science 2002, 296:907-910.
27. Ule J, Jensen KB, Ruggiu M, Mele A, Ule A, Darnell RB: CLIP identi-
fies Nova-regulated RNA networks in the brain. Science 2003,
302:1212-1215.
28. Clark F, Thanaraj TA: Categorization and characterization of
transcript-confirmed constitutively and alternatively spliced
introns and exons from human. Hum Mol Genet 2002,
11:451-464.
29. Stamm S, Zhu J, Nakai K, Stoilov P, Stoss O, Zhang MQ: An alterna-
tive-exon database and its statistical analysis. DNA Cell Biol
2000, 19:739-756.
30. Xu Q, Modrek B, Lee C: Genome-wide detection of tissue-spe-
cific alternative splicing in the human transcriptome. Nucleic
Acids Res 2002, 30:3754-3766.
31. Brett D, Pospisil H, Valcarcel J, Reich J, Bork P: Alternative splicing
and genome complexity. Nat Genet 2002, 30:29-30.
32. Lee CJ, Irizarry K: Alternative splicing in the nervous system:
an emerging source of diversity and regulation. Biol Psychiatry
2003, 54:771-776.
33. Wang Z, Lo HS, Yang H, Gere S, Hu Y, Buetow KH, Lee MP: Com-
putational analysis and experimental validation of tumor-
associated alternative RNA splicing in human cancer. Cancer
Res 2003, 63:655-657.
34. Hui L, Zhang X, Wu X, Lin Z, Wang Q, Li Y, Hu G: Identification
of alternatively spliced mRNA variants related to cancers by
genome-wide ESTs alignment. Oncogene 2004, 23:3013-3023.
35. Kirkpatrick LL, McIlwain KA, Nelson DL: Alternative splicing in
the murine and human FXR1 genes. Genomics 1999, 59:193-202.
36. Kirkpatrick LL, McIlwain KA, Nelson DL: Comparative genomic
sequence analysis of the FXR gene family: FMR1, FXR1, and
FXR2. Genomics 2001, 78:169-177.
37. Sugnet CW, Kent WJ, Ares M Jr, Haussler D: Transcriptome and
genome conservation of alternative splicing events in
humans and mice. In Biocomputing 2004: Pac Symp Biocomput Edited
by: Altman RB, Dunker AK, Hunter L, Jung TA, Klein TE. Singapore:
World Scientific; 2004:66-77.
38. Sorek R, Ast G: Intronic sequences flanking alternatively
spliced exons are conserved between human and mouse.
Genome Res 2003, 13:1631-1637.
39. Kaufmann D, Kenner O, Nurnberg P, Vogel W, Bartelt B: In NF1,
CFTR, PER3, CARS and SYT7, alternatively included exons
show higher conservation of surrounding intron sequences
than constitutive exons. Eur J Hum Genet 2004, 12:139-149.
40. Megy K, Audic S, Claverie JM: Positional clustering of differen-
tially expressed genes on human chromosomes 20, 21 and
22. Genome Biol 2003, 4:P1.
41. Hillman RT, Green RE, Brenner SE: An unappreciated role for
RNA surveillance. Genome Biol 2004, 5:R8.
42. Green RE, Lewis BP, Hillman RT, Blanchette M, Lareau LF, Garnett
AT, Rio DC, Brenner SE: Widespread predicted nonsense-
mediated mRNA decay of alternatively-spliced transcripts of
human normal and disease genes. Bioinformatics 2003, 19(Suppl
1):I118-I121.
43. Su AI, Cooke MP, Ching KA, Hakak Y, Walker JR, Wiltshire T, Orth
AP, Vega RG, Sapinoso LM, Moqrich A, et al.: Large-scale analysis
of the human and mouse transcriptomes. Proc Natl Acad Sci USA
2002, 99:4465-4470.
44. Gene Expression Atlas []
45. Su AI, Wiltshire T, Batalov S, Lapp H, Ching KA, Block D, Zhang J,
Soden R, Hayakawa M, Kreiman G, et al.: A gene atlas of the
mouse and human protein-encoding transcriptomes. Proc
Natl Acad Sci USA 2004, 101:6062-6067.
46. Zhou Z, Licklider LJ, Gygi SP, Reed R: Comprehensive proteomic
analysis of the human spliceosome. Nature 2002, 419:182-185.
47. Jurica MS, Moore MJ: Pre-mRNA splicing: awash in a sea of
proteins. Mol Cell 2003, 12:5-14.
48. Rappsilber J, Ryder U, Lamond AI, Mann M: Large-scale proteomic
analysis of the human spliceosome. Genome Res 2002,
12:1231-1245.
49. Hanamura A, Caceres JF, Mayeda A, Franza BR Jr, Krainer AR: Reg-
ulated tissue-specific expression of antagonistic pre-mRNA
splicing factors. RNA 1998, 4:430-444.
50. Bai Y, Lee D, Yu T, Chasin LA: Control of 3' splice site choice in
vivo by ASF/SF2 and hnRNP A1. Nucleic Acids Res 1999,
27:1126-1134.
51. Eperon IC, Makarova OV, Mayeda A, Munroe SH, Caceres JF, Hay-
ward DG, Krainer AR: Selection of alternative 5' splice sites:
role of U1 snRNP and models for the antagonistic effects of
SF2/ASF and hnRNP A1. Mol Cell Biol 2000, 20:8303-8318.
52. Kamma H, Portman DS, Dreyfuss G: Cell type-specific expression
of hnRNP proteins. Exp Cell Res 1995, 221:187-196.
53. Caputi M, Mayeda A, Krainer AR, Zahler AM: hnRNP A/B proteins
are required for inhibition of HIV-1 pre-mRNA splicing.
EMBO J 1999, 18:4060-4067.
54. Caputi M, Zahler AM: SR proteins and hnRNP H regulate the
splicing of the HIV-1 tev-specific exon 6D. EMBO J 2002,
21:845-855.
55. Anderson L, Seilhamer J: A comparison of selected mRNA and
protein abundances in human liver. Electrophoresis 1997,
18:533-537.
56. Futcher B, Latter GI, Monardo P, McLaughlin CS, Garrels JI: A sam-
pling of the yeast proteome. Mol Cell Biol 1999, 19:7357-7368.
57. Griffin TJ, Gygi SP, Ideker T, Rist B, Eng J, Hood L, Aebersold R:
Complementary profiling of gene expression at the
transcriptome and proteome levels in Saccharomyces
cerevisiae. Mol Cell Proteomics 2002, 1:323-333.
58. Kawamoto S, Matsumoto Y, Mizuno K, Okubo K, Matsubara K:
Expression profiles of active genes in human and mouse
livers. Gene 1996, 174:151-158.
59. Brudno M, Gelfand MS, Spengler S, Zorn M, Dubchak I, Conboy JG:
Computational analysis of candidate intron regulatory ele-
ments for tissue-specific alternative pre-mRNA splicing.
Nucleic Acids Res 2001, 29:2338-2348.
60. Chou MY, Underwood JG, Nikolic J, Luu MH, Black DL: Multisite
RNA binding and release of polypyrimidine tract binding
protein during the regulation of c-src neural-specific splicing.
Mol Cell 2000, 5:949-957.
61. Chan RC, Black DL: The polypyrimidine tract binding protein
binds upstream of neural cell-specific c-src exon N1 to
repress the splicing of the intron downstream. Mol Cell Biol
1997, 17:4667-4676.
62. Grabowski PJ: Splicing regulation in neurons: tinkering with
cell-specific control. Cell 1998, 92:709-712.
63. Wollerton MC, Gooding C, Wagner EJ, Garcia-Blanco MA, Smith
CW: Autoregulation of polypyrimidine tract binding protein
by alternative splicing leading to nonsense-mediated decay.
Mol Cell 2004, 13:91-100.
64. Burd CG, Dreyfuss G: RNA binding specificity of hnRNP A1:
Genome Biology 2004, Volume 5, Issue 10, Article R74 Yeo et al. R74.15
comment reviews reports refereed researchdeposited research interactions information
Genome Biology 2004, 5:R74
significance of hnRNP A1 high-affinity binding sites in pre-
mRNA splicing. EMBO J 1994, 13:1197-1204.
65. Sirand-Pugnet P, Durosay P, Brody E, Marie J: An intronic (A/
U)GGG repeat enhances the splicing of an alternative intron
of the chicken beta-tropomyosin pre-mRNA. Nucleic Acids Res
1995, 23:3501-3507.
66. McCullough AJ, Berget SM: G triplets located throughout a class
of small vertebrate introns enforce intron borders and regu-
late splice site selection. Mol Cell Biol 1997, 17:4562-4571.
67. UCSC Genome Browser []
68. Mammalian Gene Collection (MGC) Initiative [http://
mgc.nci.nih.gov]
69. The I.M.A.G.E. Consortium [ />70. The Cancer Gene Anatomy Project []
71. GENOA file server [ />72. Florea L, Hartzell G, Zhang Z, Rubin GM, Miller W: A computer
program for aligning a cDNA sequence with a genomic DNA
sequence. Genome Res 1998, 8:967-974.
73. Berget SM: Exon recognition in vertebrate splicing. J Biol Chem
1995, 270:2411-2414.
74. Majewski J, Ott J: Distribution and characterization of regula-
tory elements in the human genome. Genome Res 2002,
12:1827-1836.
75. Glantz SA: Primer of Biostatistics 4th edition. New York: McGraw-Hill;
1997.
76. Burge lab: Additional data directory 1 [ />burgelab/Supplementary/yeo_holste04/Add_Datadir_1/]
77. Burge lab: Additional data directory 2 [ />burgelab/Supplementary/yeo_holste04/Add_Datadir_2/]