Báo cáo y học: "Genomic transcriptional response to loss of chromosomal supercoiling in Escherichia coli" doc
Bạn đang xem bản rút gọn của tài liệu. Xem và tải ngay bản đầy đủ của tài liệu tại đây (983.19 KB, 16 trang )
Genome Biology 2004, 5:R87
comment reviews reports deposited research refereed research interactions information
Open Access
2004Peteret al.Volume 5, Issue 11, Article R87
Research
Genomic transcriptional response to loss of chromosomal
supercoiling in Escherichia coli
Brian J Peter
*¥
, Javier Arsuaga
*†
, Adam M Breier
‡
, Arkady B Khodursky
§
,
Patrick O Brown
¶
and Nicholas R Cozzarelli
*
Addresses:
*
Department of Molecular and Cell Biology, University of California, Berkeley, CA 94720-3204, USA.
†
Mathematics Department,
University of California, Berkeley, CA 94720, USA.
‡
Graduate Group in Biophysics, University of California, Berkeley, CA 94720, USA.
§
Department of Biochemistry, Molecular Biology, and Biophysics, University of Minnesota, St. Paul, MN 55108, USA.
¶
Department of
Biochemistry and Howard Hughes Medical Institute, Stanford University, Stanford, CA 94305-5307, USA.
¥
Current address: Neurobiology
Division, MRC Laboratory of Molecular Biology, Cambridge CB2 2QH, UK.
Correspondence: Nicholas R Cozzarelli. E-mail:
© 2004 Peter et al.; licensee BioMed Central Ltd.
This is an Open Access article distributed under the terms of the Creative Commons Attribution License (
which permits unrestricted use, distribution, and reproduction in any medium, provided the original work is properly cited.
Transcriptional response to supercoiling in bacteria<p>Microarray analysis shows that transcription of 306 E. Coli genes is affected by changes in the level of chromosome supercoiling, sug-gesting that supercoiling transmits regulatory signals from the environment to many cellular pathways.</p>
Abstract
Background: The chromosome of Escherichia coli is maintained in a negatively supercoiled state,
and supercoiling levels are affected by growth phase and a variety of environmental stimuli. In turn,
supercoiling influences local DNA structure and can affect gene expression. We used microarrays
representing nearly the entire genome of Escherichia coli MG1655 to examine the dynamics of
chromosome structure.
Results: We measured the transcriptional response to a loss of supercoiling caused either by
genetic impairment of a topoisomerase or addition of specific topoisomerase inhibitors during log-
phase growth and identified genes whose changes are statistically significant. Transcription of 7% of
the genome (306 genes) was rapidly and reproducibly affected by changes in the level of
supercoiling; the expression of 106 genes increased upon chromosome relaxation and the
expression of 200 decreased. These changes are most likely to be direct effects, as the kinetics of
their induction or repression closely follow the kinetics of DNA relaxation in the cells.
Unexpectedly, the genes induced by relaxation have a significantly enriched AT content in both
upstream and coding regions.
Conclusions: The 306 supercoiling-sensitive genes are functionally diverse and widely dispersed
throughout the chromosome. We propose that supercoiling acts as a second messenger that
transmits information about the environment to many regulatory networks in the cell.
Background
The chromosome of Escherichia coli is a circular double-
stranded DNA molecule that is maintained in a negatively
supercoiled state. Supercoiling induces torsional tension in
the DNA, and thus can influence processes that involve the
opening of the double helix, such as replication initiation [1],
DNA looping [2] and transcription [3]. A number of external
stimuli, such as osmotic stress, oxygen tension, nutritional
shifts, and temperature change affect supercoiling (for review
see [4]), suggesting that supercoiling is a mechanism by
Published: 1 November 2004
Genome Biology 2004, 5:R87
Received: 11 August 2004
Revised: 1 October 2004
Accepted: 11 October 2004
The electronic version of this article is the complete one and can be
found online at />R87.2 Genome Biology 2004, Volume 5, Issue 11, Article R87 Peter et al. />Genome Biology 2004, 5:R87
which environmental changes could be communicated to the
transcriptional machinery.
In E. coli, supercoiling is maintained at a precise range during
log phase growth by the topoisomerases DNA gyrase, topoi-
somerase I (topo I), and topoisomerase IV (topo IV) [5-7].
DNA gyrase and topo IV are ATP-dependent type II topoi-
somerases that introduce negative supercoils and remove
positive supercoils, respectively [8-10], whereas topo I is a
type IA topoisomerase that removes negative supercoils [11].
Together, these activities remove the topological effects of
translocating proteins, such as RNA polymerase, that create
(+) supercoils in front and (-) supercoils behind the moving
protein [12,13]. The balanced activities of these enzymes
result in a steady-state level of negative supercoiling. In turn,
supercoiling modulates the expression of the genes for gyrase
(gyrA and gyrB), and for topo I (topA). Relaxation of the
chromosome upregulates gyrA and gyrB and downregulates
topA as a form of feedback control [14-16]. This dual response
also indicates that (-) supercoiling can promote, as well as
inhibit, gene expression. It is perhaps not surprising that
transcription of topoisomerase genes may be sensitive to
supercoiling changes. Yet transcription of other genes, such
as fis (a nucleoid-associated protein and transcriptional reg-
ulator), ilvG (an amino-acid synthase subunit) and cydAB (an
oxidase involved in aerobic respiration), has been found to be
sensitive to supercoiling [17-19], suggesting that a wider class
of genes whose expression is sensitive to supercoiling may
exist. Furthermore, a recent search for osmotic shock genes
found a cluster of genes with enhanced sensitivity to super-
coiling [20]. If supercoiling is used as a mechanism to sense
environmental changes, we predict that genes from many
functional classes would be affected by supercoiling, because
environmental changes such as temperature and osmotic
strength will affect many different reactions in the cell. Deter-
mining which genes are supercoiling sensitive may illuminate
principles of promoter activation, such as common sequence
characteristics in promoters and regulation of transcription
initiation [14,17,18].
In this study, we used cDNA microarrays [21,22] representing
nearly the entire E. coli K-12 genome to systematically iden-
tify those genes that respond to relaxation of the chromosome
during log-phase growth. We used antibiotics and mutations
in the topoisomerase genes to change supercoiling levels by
independent mechanisms and thus discerned the general
effects of chromosome relaxation. We classify supercoiling-
sensitive genes, or SSGs, according to their response to DNA
relaxation. Therefore, we call 'relaxation-induced genes'
those genes whose expression is increased upon DNA relaxa-
tion, and 'relaxation-repressed genes' those whose expression
is repressed by DNA relaxation.
An extensive statistical analysis of our experimental results
revealed 200 relaxation-repressed genes and 106 relaxation-
induced genes; in total, around 7% of all genes in the genome
were found to be significantly affected by supercoiling
changes. Many of these genes are more sensitive to supercoil-
ing than gyrA or topA, and their expression patterns corre-
lated with the supercoiling level of a reporter plasmid in the
cells. SSG transcripts have the same rates of RNA decay as
non-SSG transcripts, and thus the changes in expression were
due to a change in the rate of RNA synthesis, rather than RNA
decay.
We discovered that the sequences of the relaxation-induced
genes are significantly (p < 0.0001) AT-rich in their upstream
sequences, and also have AT-rich coding regions. Relaxation-
repressed genes had a corresponding preference for GC-rich
sequences. The SSGs are dispersed throughout the chromo-
some, and fall into many different functional classes. We pro-
pose that the large number and functional diversity of the
SSGs reflects the role of supercoiling as a second messenger
that responds to environmental changes and feeds into differ-
ent regulatory networks.
Results
Topoisomerase inhibition
We sought to determine the genes that are activated or
repressed by relaxation of the (-) supercoils in the chromo-
some. To isolate the expression changes due to the loss of
supercoiling from those due to the experimental approach, we
used three different methods to relax the chromosome. In two
of the methods we inhibited gyrase and topoIV with either
quinolone or coumarin antibiotics, and in the third we used a
temperature-sensitive strain in which gyrase is inhibited at
42°C. Because it is technically difficult to quantify the super-
coiling state of the bacterial chromosome, we used a plasmid,
pBR322, in the strains as a reference. Co-transcriptional
translation of the tetA gene in pBR322 anchors this plasmid
to the membrane [23], and thus this plasmid has been used as
a model for the chromosome [7]. The superhelical density, or
σ, of plasmids can be readily measured. Plasmid σ values for
all of the relaxation experiments are shown in Table 1.
Inhibition of topoisomerases by norfloxacin
The quinolone antibiotic norfloxacin selectively and immedi-
ately inhibits gyrase and topo IV [24-26]. We used isogenic
strains with resistance mutations in the genes for gyrase
(gyrA and gyrB) or topo IV (parC and parE) as controls, to
separate expression changes due to undiscovered drug targets
from those directly due to changes in supercoiling. When we
inhibited gyrase by treating gyrA
+
parC
R
cells with 15 µg/ml
norfloxacin, the reporter plasmid in the cells was rapidly
relaxed (Table 1). In a parallel experiment, plasmid DNA in a
drug resistant gyrA
R
parC
R
strain remained (-) supercoiled.
After 30 minutes, there was a 10
3
-fold drop in viability in the
sensitive strain, but only a 17% drop in the resistant strain. A
norfloxacin concentration of 50 µg/ml fully inhibited both
gyrase and topoisomerase IV in the wild-type strain (data not
shown), while the resistant strain retained wild type levels of
Genome Biology 2004, Volume 5, Issue 11, Article R87 Peter et al. R87.3
comment reviews reports refereed researchdeposited research interactions information
Genome Biology 2004, 5:R87
Table 1
Plasmid supercoiling measurements from relaxation experiments
Genotype Experimental treatment Plasmid σ Model ratio
gyrA
R
parC
R
15 µg/ml Nor, 0 min -0.057 1.0
gyrA
R
parC
R
15 µg/ml Nor, 2 min -0.057 1.0
gyrA
R
parC
R
15 µg/ml Nor, 5 min -0.057 1.0
gyrA
R
parC
R
15 µg/ml Nor, 10 min -0.057 1.0
gyrA
R
parC
R
15 µg/ml Nor, 20 min -0.060 1.0
gyrA
R
parC
R
15 µg/ml Nor, 30 min -0.060 0.9
gyrA
R
parC
R
50 µg/ml Nor, 0 min -0.057 1.0
gyrA
R
parC
R
50 µg/ml Nor, 2 min -0.057 1.0
gyrA
R
parC
R
50 µg/ml Nor, 5 min -0.057 1.0
gyrA
R
parC
R
50 µg/ml Nor, 10 min -0.058 1.0
gyrA
R
parC
R
50 µg/ml Nor, 20 min -0.059 1.0
gyrA
R
parC
R
50 µg/ml Nor, 30 min -0.061 0.9
gyrB
+
37°C -0.059 1.0
gyrB
+
42°C, 2 min -0.059 1.0
gyrB
+
42°C, 5 min -0.059 1.0
gyrB
+
42°C, 10 min -0.059 1.0
gyrB
+
42°C, 20 min -0.061 1.0
gyrB
TS
37°C -0.044 1.0
gyrB
TS
42°C, 2 min -0.023 1.6
gyrB
TS
42°C, 5 min -0.016 1.8
gyrB
TS
42°C, 10 min ND ND
gyrB
TS
42°C, 20 min 0.000 2.5
gyrA
+
parC
R
15 µg/ml Nor, 0 min -0.057 1.0
gyrA
+
parC
R
15 µg/ml Nor, 2 min -0.025 1.7
gyrA
+
parC
R
15 µg/ml Nor, 5 min -0.009 2.2
gyrA
+
parC
R
15 µg/ml Nor, 10 min -0.006 2.3
gyrA
+
parC
R
15 µg/ml Nor, 20 min -0.002 2.4
gyrA
+
parC
R
15 µg/ml Nor, 30 min 0.000 2.5
gyrA
+
parC
+
50 µg/ml Nor, 0 min -0.057 1.0
gyrA
+
parC
+
50 µg/ml Nor, 2 min -0.016 1.9
gyrA
+
parC
+
50 µg/ml Nor, 5 min -0.002 2.4
gyrA
+
parC
+
50 µg/ml Nor, 10 min 0.000 2.5
gyrA
+
parC
+
50 µg/ml Nor, 20 min 0.007 2.8
gyrA
+
parC
+
50 µg/ml Nor, 30 min 0.016 3.2
gyrA
+
parC
+
15 µg/ml Nor, 0 min -0.055 1.0
gyrA
+
parC
+
15 µg/ml Nor, 10 sec -0.048 1.1
gyrA
+
parC
+
15 µg/ml Nor, 25 sec -0.040 1.3
gyrA
+
parC
+
15 µg/ml Nor, 45 sec -0.032 1.5
gyrA
+
parC
+
15 µg/ml Nor, 1 min -0.027 1.6
gyrA
+
parC
+
15 µg/ml Nor, 1.5 min -0.022 1.7
gyrA
+
parC
+
15 µg/ml Nor, 2 min -0.017 1.9
gyrA
+
parC
+
15 µg/ml Nor, 3 min -0.012 2.1
gyrA
+
parC
+
15 µg/ml Nor, 4 min -0.008 2.2
gyrA
+
parC
+
15 µg/ml Nor, 5 min -0.003 2.4
R87.4 Genome Biology 2004, Volume 5, Issue 11, Article R87 Peter et al. />Genome Biology 2004, 5:R87
(-) supercoiling and showed only a slight drop (15%) in viabil-
ity, indicating that we did not overcome the drug resistance.
At bacteriocidal concentrations similar to these, quinolones
cause a decrease in the sedimentation coefficient of the nucle-
oid, indicating relaxation of the chromosomal supercoils [27].
The reference RNA sample was from cells removed immedi-
ately before addition of the drug (t = 0) and was labeled with
Cy3 (green). RNA samples taken 2, 5, 10, 20 and 30 minutes
after drug addition were labeled with Cy5 (red). The labeled
experimental and reference samples were mixed in equal
amounts before hybridization to a microarray.
Inhibition of topoisomerases by quinolones leads to double-
strand breaks in the chromosome [28]. Thus, norfloxacin not
only reduces supercoiling, but also induces the SOS response
to DNA damage [29]. We found that the induction of the SOS
response by norfloxacin was significantly slower and less
extensive than either the responses of the SSGs (see below) or
the SOS induction caused by UV treatment (see Additional
data file 1). We conclude that the induction of SOS by nor-
floxacin is not a significant impediment to our search for
SSGs.
Inhibition of topoisomerases by a coumarin antibiotic
We also relaxed the chromosome using novobiocin, a cou-
marin antibiotic that inhibits gyrase, and at a higher concen-
tration, topo IV [30,31]. Novobiocin inhibits the ATPase
activity of the enzyme [32,33], and the mechanism of inhibi-
tion is completely different from that of norfloxacin [34]. We
treated cells with 20, 50 and 200 µg/ml novobiocin for 5 min-
utes and measured the DNA relaxation by gel electrophoresis
(Table 1) and the gene-expression changes by microarray. In
addition to changes due to a loss of topoisomerase activity, we
saw changes in a set of non-overlapping genes between the
norfloxacin and novobiocin experiments, indicating that
there are also drug-specific transcriptional effects. Since we
focused our analysis on the genes that responded to super-
coiling independent of the relaxation method used, these
drug-specific changes were removed from consideration.
Inhibition of gyrase by mutation
We also used a mutant that is temperature-sensitive for
gyrase activity [35], which results in relaxation of the chromo-
some at the restrictive temperature [36]. We measured
expression changes in gyrB234 cells upon shift to the restric-
tive temperature and subsequent relaxation of the DNA
(Table 1). To control for the effects of the temperature shift on
gene expression, we compared the changes in the gyrB
TS
mutant to those in an identically treated isogenic wild-type
strain. The gyrB
TS
data were combined with the norfloxacin
and novobiocin data to make a body of experiments and con-
trols where the transcriptional effects of relaxation were iso-
lated from effects due to the method used to relax the
chromosome.
Identification of supercoiling-sensitive genes by
statistical analysis
We obtained a dataset from a total of 35 arrays. Fourteen of
the arrays were controls in which either drug was added to
resistant cells or the temperature was shifted for wild-type
cells. The supercoiling of the reporter plasmid did not change
in these controls (Table 1). The remaining 21 arrays repre-
sented experiments in which the DNA was relaxed by differ-
ent methods and over various time courses. This rich dataset
allowed us to use statistical methods to determine those genes
whose expression significantly varied with supercoiling
levels.
Using threshold ratio values (for example, requiring a twofold
change in expression) to determine which genes change sig-
nificantly during an experiment can bias expression analysis
towards genes with very low or variable expression levels
[37]. We used statistical methods to minimize the bias. To
assess the significance of the difference in gene expression
gyrA
+
parC
+
15 µg/ml Nor, 7 min 0.000 2.5
gyrA
+
parC
+
15 µg/ml Nor, 10 min 0.003 2.6
gyrA
+
parC
+
15 µg/ml Nor, 15 min 0.002 2.6
gyrA
+
parC
+
15 µg/ml Nor, 20 min 0.000 2.5
∆
acrA 0 µg/ml Novo, 0 min -0.057 1.0
∆
acrA 20 µg/ml Novo, 5 min -0.011 2.1
∆
acrA 50 µg/ml Novo, 5 min 0.005 2.7
∆
acrA 200 µg/ml Novo, 5 min 0.011 3.0
pBR322 plasmid DNA was isolated from cells and analyzed by electrophoresis. Experimental treatments in bold indicate samples taken immediately
before addition of drug or temperature shift, which were used as a reference for the following time points. Model ratios represent values derived
from plasmid σ by taking the ratio of σ in each time point and dividing by σ in the reference, and scaling that value such that a sigma of 0 corresponds
to a model ratio of 2.5. Nor, norfloxacin; Novo, novobiocin; SSG, supercoiling-sensitive gene; TS, temperature-sensitive. ND, not determined.
Table 1 (Continued)
Plasmid supercoiling measurements from relaxation experiments
Genome Biology 2004, Volume 5, Issue 11, Article R87 Peter et al. R87.5
comment reviews reports refereed researchdeposited research interactions information
Genome Biology 2004, 5:R87
between supercoiled and relaxed samples we used the
method described by Dudoit et al. [38]. Briefly, we performed
a t-test for each gene and corrected the obtained p-values for
multiple testing by a step-down procedure [39]. The cor-
rected p-value represents the probability that the differences
in gene expression between the controls and relaxation exper-
iments could have arisen by chance, after taking the expres-
sion of all genes into consideration. We obtained p-values
ranging from 0.000125 to 1.
As an independent metric of supercoiling sensitivity, we
measured how closely gene expression followed the level of
DNA supercoiling, by calculating the correlation of the
expression of each gene across all of the experiments with the
level of supercoiling in the reporter plasmid. Relaxation-
induced genes showed a positive correlation with plasmid
linking number (that is, as (-) supercoiling is lost, both linking
number and gene expression increase), up to a maximum
observed Pearson correlation coefficient of 0.91. Relaxation-
repressed genes showed a negative correlation with plasmid
linking number to a minimum Pearson coefficient of -0.88.
The majority of genes (3,190, or 80%) showed no strong cor-
relation with plasmid supercoiling, resulting in Pearson coef-
ficients between 0.5 and -0.5. The p-value represents the
robustness of the response to relaxation, whereas correlation
with plasmid supercoiling may represent sensitivity to
changes in supercoiling levels. For example, a gene that is
always completely repressed in response to relaxation will
have a low p-value, but may show little correlation with inter-
mediate levels of supercoiling. Similarly, a gene with more
variable expression may have a higher p-value, but may also
have a higher sensitivity to intermediate supercoiling levels.
Taken together, these metrics provide a detailed account of
supercoiling sensitivity.
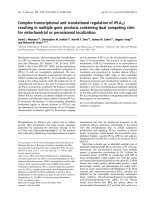
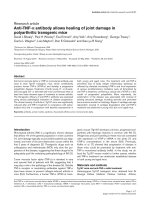
The p-values for all of the genes versus their correlation to
plasmid supercoiling are plotted in Figure 1a. The great
majority of the genes have both high p-values and little corre-
lation with plasmid supercoiling. Those genes with the lowest
p-values (and thus, the most significant expression change
upon relaxation) tended to be more strongly correlated (or
anticorrelated) to plasmid supercoiling. The data for all genes
can be found in Additional data file 2. Among all genes there
is a continuous variation in both p-value and correlation to
plasmid supercoiling. We found a total of 306 genes at p <
0.05, which we define as SSGs. Of these, 106 genes were
induced by DNA relaxation and have a positive correlation
with plasmid linking number, while 200 genes were
repressed by relaxation and these have a negative correlation
with plasmid linking number. The correlations of the SSGs
with plasmid supercoiling are shown in Figure 1b, which is an
expansion of the significant region of the plot in Figure 1a. All
the SSGs have a correlation with plasmid supercoiling with an
absolute value greater than 0.5, which validated our selection
on the basis of p-value. Just over half of the SSGs have high
significance, p < 0.005. The high redundancy of our data (21
arrays measuring responses to DNA relaxation, and 14 con-
trol arrays with negatively supercoiled DNA) minimized the
influence of any single array measurement. Thus we can be
confident that the genes we classed as SSGs have a reproduc-
ible response to supercoiling changes.
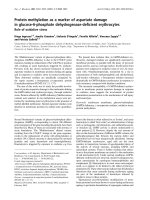
Figure 2a shows the expression changes in the 200 relaxa-
tion-repressed genes across the 35 conditions tested, with
each numbered column representing one array. Each row
represents the expression of one gene across all experiments,
ranked by p-value (from the top). Each colored entry in the
Significance versus correlation of gene expression and plasmid supercoiling values for all genes over all experimentsFigure 1
Significance versus correlation of gene expression and plasmid supercoiling
values for all genes over all experiments. For each gene we computed the
correlation coefficient between its gene expression ratios (base 2
logarithm) over all experiments with the superhelical density (σ) of a
reporter plasmid, as measured by gel electrophoresis. These values are
plotted against the p-value, which represents the chance that the
difference in expression between relaxation and control experiments
could have arisen randomly. (a) Scatter plot for all genes. There is a
general trend in which genes with low p-values showed very high
correlation (absolute value) between expression and plasmid supercoiling.
The points corresponding to the topoisomerase genes gyrA, gyrB, topA and
topB are indicated. (b) Expanded portion of (a) highlighting those genes
classified as significant (p < 0.05). Genes with very low p-values show high
positive or negative correlation between expression and plasmid
supercoiling.
p-value p-value
Correlation with plasmid supercoiling
Correlation with plasmid supercoiling
gyrB
topB
gyrB
topB
topA
gyrA
0
0.01
0.02
0.03
0.04
0.05
0
0.2
0.4
0.6
0.8
1
−1 −0.5 0 0.5 1
−1 −0.5 0 0.5 1
(a)
(b)
R87.6 Genome Biology 2004, Volume 5, Issue 11, Article R87 Peter et al. />Genome Biology 2004, 5:R87
Figure 2 (see legend on next page)
mcrB, 0.91
htrL, 0.90
b1983, 0.88
b1170, 0.86
deoC, 0.86
mcrC, 0.84
fixA, 0.83
b1330, 0.81
deoA, 0.80
yleB, 0.79
rfaI, 0.78
20 22
21 2723
26 28
2925
24 30 32
31 33 35
3410 12
11 1713
16 18
19
15
142
173
68
95
4
20 22
21 2723
26 28
2925
24 30 32
31 33 35
3410 12
11 1713
16 18
19
15
142
173
68
95
4
yraM, −0.88
dapA, −0.88
yraN, −0.88
pgi, −0.88
ribF, −0.87
ileS, −0.87
yhaJ, −0.87
crl, −0.87
pepA, −0.86
yihE, −0.85
yadF, −0.85
yfgA, −0.84
mukF, −0.84
ydiJ, −0.84
glmS, −0.84
gcvR, −0.83
pnp, −0.83
cpxA, −0.83
polA, −0.82
sbcB, −0.82
1:1
2:1
≥4:1
1:≥4
1:2
Repressed
Induced
No
change
Color key
p<0.0005
p<0.000125
p<0.001
p<0.002
p<0.005
p<0.01
p<0.02
p<0.05
p<0.002
p<0.005
p<0.01
p<0.02
p<0.05
(a) Relaxation-repressed genes
(b) Relaxation-induced genes
Genome Biology 2004, Volume 5, Issue 11, Article R87 Peter et al. R87.7
comment reviews reports refereed researchdeposited research interactions information
Genome Biology 2004, 5:R87
diagram corresponds to one spot on one array (that is,
expression of a gene for a point in a given experiment: red if
expression increased during the experiment, green if it
decreased). Conversely, these relaxation-repressed genes
should have low ratios (and black squares) in the control
experiments 1 to 14. The significant difference in SSG expres-
sion between the controls and relaxation experiments is
reflected by the sharp contrast between the mostly black con-
trols and the bright green relaxation experiments. At the top
we have shown a model expression profile representing the
supercoiling of the reporter plasmid in each experiment
(Table 1), with black indicating no change in plasmid super-
coiling and bright green indicating complete relaxation of the
plasmid. These plasmid relaxation data match very well the
expression data of the SSGs. The names of the top 10% of
genes (those with the lowest p-value) are listed, along with
their correlations to plasmid supercoiling levels.
The 106 genes that are induced by relaxation are similarly
shown in Figure 2b. Red squares indicate expression at a
higher level when the DNA is relaxed. Once again there is a
striking difference in color between the control and relaxation
experiments, and the SSGs show a strong similarity to the
model profile at the top (in this model profile, red color indi-
cates relaxation of the reporter plasmid). Several of the relax-
ation-induced genes are marginally repressed (shown by
green color) in some control experiments. This is due to the
fact that our statistical selection did not require the SSGs to be
unchanged in the controls, but only required a significant dif-
ference in expression between the controls and relaxation
experiments. However, this trend highlights the large expres-
sion change (from repression to induction) caused by chro-
mosomal relaxation. It is striking how many genes respond
significantly to a loss of chromosomal supercoiling (7% of the
total genes). The full list of SSGs, with their p-values, correla-
tions to supercoiling, and expression levels in each experi-
ment can be found in Additional data file 3.
Kinetic analysis of gene expression and supercoiling
We expected that changes in SSG expression that are a direct
effect of supercoiling changes (rather than mediated through
other genes) should respond quickly to relaxation. We used a
finer time-course experiment to determine which genes had
the fastest response to chromosomal relaxation. When 15 µg/
ml norfloxacin was added to gyrA
+
parC
+
cells, plasmid
supercoiling levels changed dramatically within the first
minute (Figure 3). Significant changes in gene expression fol-
lowed by 2 minutes (Figure 4). We ranked the SSGs according
to their correlation to plasmid supercoiling levels in this
experiment. Thus, genes with transcriptional changes that
match the kinetics of plasmid relaxation have high correla-
tions. About 90% of the SSGs had a correlation higher in
absolute value than 0.5, and more than half had correlations
better than 0.75. The expression profiles of all of the SSGs,
ranked by their correlation to plasmid supercoiling, are
shown in Figure 4. The correlation of the SSGs to plasmid
relaxation kinetics shows the sensitivity of gene expression to
changes in supercoiling, while the p-value is a good indicator
of the reproducibility of the response to supercoiling across
the different experimental conditions we tested.
The speed of the transcriptional response to relaxation, com-
bined with the strong correlations to supercoiling of the
reporter plasmid in the cells, is strong evidence that the SSGs
are directly regulated by supercoiling changes. Furthermore,
given that E. coli mRNAs have a mean half-life of 5.2 ± 0.3
minutes in LB media [40], RNA synthesis of the relaxation-
repressed genes must have slowed almost immediately upon
DNA relaxation, in order to produce the quick changes we
recorded (Figure 4). More than half of the relaxation-
repressed genes changed by twofold or more in the first 5
minutes of this experiment.
We found no correlation of p-value with the published values
of RNA half-life [40] and in general the mRNA half-lives of
Expression profiles of relaxation-induced and repressed genesFigure 2 (see previous page)
Expression profiles of relaxation-induced and repressed genes. The figure shows a cluster diagram ordered according to the p-value of each gene (from
0.000125 to 0.05). Each row represents a gene and each column an experiment. Therefore, each of the entries of the array shows the expression level for
a gene in a given experiment. (a) Relaxation-repressed genes; (b) relaxation-induced genes. The set of experiments labeled 1 to 14, to the left of the
vertical mark in (a and b), represents the control set in which plasmid supercoiling did not change. Experiments to the right of the vertical mark, labeled
from 15 to 35, are experiments in which the chromosome is relaxed. As experiments were done in a time-dependent fashion, red color means that gene
expression is higher at time points after relaxation of the chromosomes, while green means the opposite. Black indicates no change in expression during
the experiment. Columns 1-5, gene expression measured after addition of 15 µg/ml norfloxacin to a norfloxacin-resistant strain at times t = 2, 5, 10, 20 or
30 min; columns 19-27, gene expression measured after addition of 15 µg/ml norfloxacin to an isogenic wild-type strain at times t = 2, 3, 4, 5, 7, 10, 15, 20
or 30 min; columns 6-10, gene expression at times t = 2, 5, 10, 20 or 30 min after addition of 50 µg/ml norfloxacin to a norfloxacin-resistant strain;
columns 28-32, gene expression at these times after addition of the same concentration of norfloxacin to an isogenic wild-type strain; columns 15-18, gene
expression at times t = 2, 5, 10 or 20 min after temperature shift in a temperature-sensitive mutant strain; columns 11-14, gene expression at times t = 2,
5, 10 or 20 min after temperature shift in an isogenic wild-type strain; columns 33-35, gene expression at fixed time t = 5 min and varying concentrations
of novobiocin (Novo) = 20, 50 or 200 µg/ml on a wild-type strain. A total of 200 genes are repressed in response to DNA relaxation, while 106 genes are
induced. The top row is a model expression profile of the supercoiling of the reporter plasmid in each experiment (Table 1). p-values and correlation
coefficients with plasmid supercoiling levels for the top 10% of genes in each class are listed. The complete expression data for each gene can be found in
Additional data file 2.
R87.8 Genome Biology 2004, Volume 5, Issue 11, Article R87 Peter et al. />Genome Biology 2004, 5:R87
the SSGs were not significantly different from those from the
rest of the genome (data not shown). We conclude that the
changes in SSG expression are direct effects on transcription,
rather than an effect on RNA degradation.
Sequences surrounding the start codon of supercoiling
sensitive genes
We searched for a basis of supercoiling sensitivity at the
nucleotide sequence level by examining the AT content in and
around the SSGs. We considered only the first genes in an
operon. Whereas relaxation-repressed genes have a slightly
depleted AT content both upstream of their promoters and
within the coding sequence, relaxation-induced genes have
an emphatic elevation of AT content in similar regions. The
AT content of relaxation-induced genes from 800 nucleotides
before to 200 nucleotides after the start codon is 54.6%, com-
pared with 51.7% for non-SSGs. To illustrate the very low
probability of selecting by chance a set of genes with such an
elevated AT content, we randomly selected groups of first-in-
operon non-SSGs 50,000 times and calculated AT content
within the same window. We never found a set with an AT
content as high as the relaxation-induced genes (red circle,
Figure 5a). The difference in AT content is highly statistically
significant (p = 3E-4).
This is not the only region in which the AT content of SSGs
deviates from the rest of the genome. Figure 5b shows the
mean AT content in a 100-nucleotide window for relaxation-
induced, relaxation-repressed, and non-SSGs from 2 kilo-
bases (kb) upstream to 1.5 kb downstream of the start codon.
Nearly all genes, including non-SSGs, have elevated AT con-
tent upstream and just downstream of the start codon. The
relaxation-induced genes, however, have a higher maximum
AT richness and the elevated AT content extends over a wider
region. Also, the relaxation-repressed genes showed a highly
statistically significant reduction in AT content from -400 to
+1,000 relative to the start codon (p = 1E-6).
Striking as these differences in AT content are for SSGs as a
group, they are not sufficient to distinguish an individual SSG
from a non-SSG. That is, not all genes with high or low AT
content were supercoiling sensitive in our experiments.
Although such genes are rare in the non-SSG population, the
greater size of the pool of non-SSGs results in many genes
with wide variations in AT content. Also, supercoiling sensi-
tivity cannot solely be due to differences in AT content, as a
few SSGs were highly sensitive to supercoiling changes in
spite of having an AT content similar to the rest of the
genome.
Plasmid relaxation kineticsFigure 3
Plasmid relaxation kinetics. gyrA
+
parC
+
cells were treated with 15 µg/ml
norfloxacin for the indicated times before samples were removed for
DNA and microarray analysis. (a) pBR322 plasmid DNA was isolated and
run on a 1% agarose gel + 2.8 µg/ml chloroquine to provide an indicator of
topoisomerase activity in the cells. The positions of open circular (oc) and
relaxed (rel) marker plasmids on the gel are shown. The distribution of
native (-) supercoiled DNA is shown in lane 1. As the plasmid becomes
relaxed, the center of the distribution first moves toward the open
circular form and then moves down the gel to the relaxed position. The
calculated superhelical density values for the plasmids (σ) are shown at
bottom of each lane. (b) Graph of the average σ values from (a). Values of
σ stabilized around 0 for times greater than 10 min and are not shown.
σ
Time (min)
012345678910
Plasmid superhelical
density
oc
rel
Time
−0.055
−0.048
−0.040
−0.032
−0.027
−0.022
−0.017
−0.012
−0.008
−0.003
0.0
0.003
0.002
0.0
0 sec
10 sec
45 sec
25 sec
60 sec
1.5 min
2 min
3 min
4 min
5 min
7 min
10 min
15 min
20 min
−0.06
−0.05
−0.04
−0.03
−0.02
−0.01
0
0.01
(a)
(b)
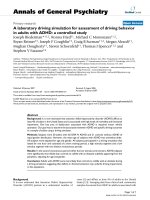
Kinetics of the expression changes of the supercoiling-sensitive genesFigure 4 (see following page)
Kinetics of the expression changes of the supercoiling-sensitive genes. Norfloxacin was added to wild-type E. coli cells and RNA was extracted from cells
removed from the culture at the time points shown (in minutes) above each column. This diagram illustrates the kinetics of the SSG responses, which are
ranked by their correlation to plasmid supercoiling levels in this experiment (see Figure 3). p-values and correlation coefficients for each gene are listed
(see Materials and methods for calculation). The model profiles shown at the top are colored representations of plasmid supercoiling levels, as in Figure 2.
Red squares indicate that a gene is induced during the experiment, green squares that a gene is repressed.
Genome Biology 2004, Volume 5, Issue 11, Article R87 Peter et al. R87.9
comment reviews reports refereed researchdeposited research interactions information
Genome Biology 2004, 5:R87
Figure 4 (see legend on previous page)
yqeF; corr=0.96; p=0.016
minC; corr=0.96; p=0.0001
aer; corr=0.94; p=0.001
yojN; corr=0.94; p=0.002
b1827; corr=0.94; p=0.002
ppk; corr=0.94; p=0.006
pnp; corr=0.93; p=0.0001
nmpC; corr=0.93; p=0.001
yceA; corr=0.93; p=0.008
b1832; corr=0.93; p=0.001
dxs; corr=0.93; p=0.0001
insB_3; corr=0.93; p=0.024
gmhA; corr=0.92; p=0.001
secE; corr=0.92; p=0.032
mukF; corr=0.92; p=0.0001
sohA; corr=0.92; p=0.016
gshA; corr=0.92; p=0.013
ushA; corr=0.92; p=0.001
ispA; corr=0.92; p=0.0001
polA; corr=0.91; p=0.0001
msbB; corr=0.91; p=0.022
ilvB; corr=0.91; p=0.001
uup; corr=0.91; p=0.046
yajK; corr=0.91; p=0.001
pepA; corr=0.91; p=0.0001
ycfD; corr=0.9; p=0.001
panD; corr=0.9; p=0.014
minD; corr=0.9; p=0.001
yraM; corr=0.9; p=0.0001
mukE; corr=0.9; p=0.001
smtA; corr=0.9; p=0.0001
ydgR; corr=0.9; p=0.002
fimC; corr=0.9; p=0.0004
ydjA; corr=0.9; p=0.02
yadF; corr=0.9; p=0.0001
yraL; corr=0.9; p=0.0001
yrbL; corr=0.89; p=0.011
yceC; corr=0.89; p=0.0002
ubiA; corr=0.89; p=0.005
ybhC; corr=0.89; p=0.036
yafJ; corr=0.89; p=0.0001
cpxA; corr=0.88; p=0.0001
smg; corr=0.88; p=0.001
b1085; corr=0.88; p=0.001
fpr; corr=0.88; p=0.038
glmS; corr=0.88; p=0.0001
serB; corr=0.88; p=0.002
smf_2; corr=0.88; p=0.024
panC; corr=0.87; p=0.0001
yraN; corr=0.87; p=0.0001
pgi; corr=0.87; p=0.0001
uspA; corr=0.87; p=0.002
dadA; corr=0.87; p=0.041
dapA; corr=0.87; p=0.0001
rng; corr=0.87; p=0.047
rimJ; corr=0.87; p=0.043
dniR; corr=0.86; p=0.006
ycbK; corr=0.86; p=0.0001
b2682; corr=0.86; p=0.016
rfe; corr=0.86; p=0.0002
ybcU; corr=0.86; p=0.0001
rcsB; corr=0.86; p=0.003
nusG; corr=0.86; p=0.019
yajD; corr=0.86; p=0.0001
b1840; corr=0.86; p=0.002
yebK; corr=0.85; p=0.038
ydiJ; corr=0.85; p=0.0001
ycgL; corr=0.85; p=0.0001
gppA; corr=0.85; p=0.002
yhbT; corr=0.85; p=0.0001
ppc; corr=0.85; p=0.002
gcvR; corr=0.85; p=0.0001
sbcB; corr=0.84; p=0.0001
mukB; corr=0.84; p=0.006
crl; corr=0.84; p=0.0001
yciI; corr=0.84; p=0.003
plsX; corr=0.84; p=0.002
yidQ; corr=0.84; p=0.0001
yraP; corr=0.84; p=0.0002
pepN; corr=0.83; p=0.0002
rna; corr=0.83; p=0.0001
insB_6; corr=0.83; p=0.0002
hcaR; corr=0.83; p=0.004
proC; corr=0.83; p=0.013
folX; corr=0.83; p=0.008
ycfP; corr=0.83; p=0.001
ribF; corr=0.82; p=0.0001
yieE; corr=0.82; p=0.048
yrdD; corr=0.82; p=0.001
ycbY; corr=0.82; p=0.048
yjaE; corr=0.82; p=0.003
yfgA; corr=0.82; p=0.0001
aas; corr=0.82; p=0.023
fimI; corr=0.82; p=0.006
recC; corr=0.81; p=0.0001
fabH; corr=0.81; p=0.016
topB; corr=0.81; p=0.002
gloB; corr=0.81; p=0.001
yihE; corr=0.81; p=0.0001
ubiC; corr=0.81; p=0.0001
ycfO; corr=0.8; p=0.011
ydiA; corr=0.8; p=0.007
yhaJ; corr=0.8; p=0.0001
mtlR; corr=0.8; p=0.002
ygdP; corr=0.79; p=0.001
ileS; corr=0.79; p=0.0001
yafK; corr=0.79; p=0.001
b1170; corr=0.91; p=0.0001
gyrB; corr=0.91; p=0.002
b1983; corr=0.91; p=0.0001
b1168; corr=0.91; p=0.002
pphB; corr=0.9; p=0.001
b2372; corr=0.9; p=0.016
yabJ; corr=0.89; p=0.001
yjeS; corr=0.88; p=0.005
recE; corr=0.88; p=0.014
mutM; corr=0.88; p=0.006
fixA; corr=0.88; p=0.0001
b1169; corr=0.88; p=0.002
atoA; corr=0.87; p=0.009
yheE; corr=0.87; p=0.028
mcrB; corr=0.87; p=0.0001
nhaA; corr=0.87; p=0.001
htrL; corr=0.87; p=0.0001
ubiH; corr=0.86; p=0.003
eaeH; corr=0.86; p=0.024
yiaU; corr=0.86; p=0.014
dcuC; corr=0.86; p=0.001
b0011; corr=0.85; p=0.021
ybbK; corr=0.85; p=0.001
yfaA; corr=0.85; p=0.022
rpoD; corr=0.84; p=0.007
b1330; corr=0.84; p=0.0001
xapB; corr=0.83; p=0.017
yhiJ; corr=0.82; p=0.005
dnaA; corr=0.82; p=0.006
mcrC; corr=0.82; p=0.0001
b2337; corr=0.82; p=0.018
emrY; corr=0.82; p=0.022
ykgG; corr=0.81; p=0.022
yagY; corr=0.81; p=0.001
gidA; corr=0.81; p=0.001
ybdN; corr=0.8; p=0.001
mazG; corr=0.8; p=0.001
ydeH; corr=0.8; p=0.007
yehX; corr=0.79; p=0.022
ybbW; corr=0.79; p=0.006
yeeS; corr=0.79; p=0.041
visC; corr=0.78; p=0.014
hofQ; corr=0.78; p=0.001
citA; corr=0.78; p=0.007
yleB; corr=0.78; p=0.0001
rfaP; corr=0.78; p=0.049
yeaI; corr=0.78; p=0.015
otsB; corr=0.78; p=0.014
b1628; corr=0.78; p=0.034
deoA; corr=0.77; p=0.0001
b2256; corr=0.77; p=0.014
deoC; corr=0.77; p=0.0001
dnaN; corr=0.76; p=0.019
yfcA; corr=0.76; p=0.02
yahK; corr=0.75; p=0.015
phnH; corr=0.74; p=0.049
b1721; corr=0.74; p=0.019
yaeF; corr=0.74; p=0.009
yghQ; corr=0.74; p=0.014
rfaI; corr=0.73; p=0.0001
nohA; corr=0.73; p=0.002
intE; corr=0.73; p=0.011
ydaJ; corr=0.73; p=0.049
b2255; corr=0.71; p=0.024
b2374; corr=0.71; p=0.001
fixC; corr=0.71; p=0.016
rfaZ; corr=0.7; p=0.028
gabP; corr=0.7; p=0.025
b2254; corr=0.69; p=0.02
yjiC; corr=0.69; p=0.027
ggt; corr=0.68; p=0.007
fixB; corr=0.68; p=0.002
narY; corr=0.68; p=0.012
tbpA; corr=0.68; p=0.019
crcA; corr=0.68; p=0.028
tdcR; corr=0.68; p=0.038
ydgO; corr=0.67; p=0.007
molR_3; corr=0.66; p=0.003
gadB; corr=0.65; p=0.001
leuD; corr=0.65; p=0.025
b2373; corr=0.64; p=0.002
b1627; corr=0.63; p=0.04
celF; corr=0.62; p=0.019
b2253; corr=0.62; p=0.005
caiE; corr=0.61; p=0.001
yfcS; corr=0.61; p=0.009
b1501; corr=0.6; p=0.003
yehP; corr=0.6; p=0.001
citC; corr=0.58; p=0.001
ygbI; corr=0.57; p=0.026
yleA; corr=0.57; p=0.006
yfcG; corr=0.55; p=0.003
htrE; corr=0.55; p=0.012
tdcB; corr=0.53; p=0.003
adhP; corr=0.52; p=0.006
sspB; corr=0.48; p=0.02
uxaB; corr=0.47; p=0.028
bfr; corr=0.45; p=0.003
yghR; corr=0.43; p=0.007
b1588; corr=0.43; p=0.01
htgA; corr=0.4; p=0.036
ybhH; corr=0.38; p=0.048
lrhA; corr=0.31; p=0.005
murE; corr=0.19; p=0.048
purC; corr=0.18; p=0.003
nrdG; corr=0.12; p=0.023
ansP; corr=0.05; p=0.034
gpsA; corr=0.79; p=0.024
pncB; corr=0.79; p=0.0001
cpdB; corr=0.79; p=0.002
yrdC; corr=0.79; p=0.012
metH; corr=0.78; p=0.001
yeeX; corr=0.78; p=0.001
b1841; corr=0.78; p=0.004
agaR; corr=0.78; p=0.001
hemN; corr=0.78; p=0.002
ycfL; corr=0.78; p=0.016
gsk; corr=0.77; p=0.001
tolR; corr=0.77; p=0.0001
panB; corr=0.77; p=0.001
ytfM; corr=0.77; p=0.001
gcpE; corr=0.77; p=0.001
b1604; corr=0.76; p=0.023
wecC; corr=0.76; p=0.034
mfd; corr=0.75; p=0.026
ytfB; corr=0.75; p=0.001
manA; corr=0.75; p=0.009
secB; corr=0.75; p=0.013
ydaR; corr=0.74; p=0.001
ygaH; corr=0.74; p=0.014
yidR; corr=0.74; p=0.001
bcp; corr=0.74; p=0.003
murB; corr=0.73; p=0.0002
cpxR; corr=0.73; p=0.001
insB_2; corr=0.72; p=0.0001
tolA; corr=0.72; p=0.002
tmk; corr=0.71; p=0.001
yjaD; corr=0.71; p=0.001
holC; corr=0.71; p=0.02
insB_1; corr=0.71; p=0.001
yacE; corr=0.7; p=0.0001
secD; corr=0.69; p=0.024
zwf; corr=0.69; p=0.039
yraO; corr=0.69; p=0.001
b1284; corr=0.68; p=0.003
grxC; corr=0.68; p=0.001
selD; corr=0.68; p=0.023
insB_4; corr=0.68; p=0.0002
kdsB; corr=0.68; p=0.024
b1809; corr=0.67; p=0.0001
holE; corr=0.67; p=0.024
yifE; corr=0.66; p=0.017
gpmA; corr=0.66; p=0.008
gloA; corr=0.65; p=0.03
cls; corr=0.64; p=0.0001
b1706; corr=0.64; p=0.014
tesB; corr=0.64; p=0.02
yqaB; corr=0.64; p=0.037
b0947; corr=0.63; p=0.036
pgpB; corr=0.63; p=0.002
insA_2; corr=0.62; p=0.041
yacL; corr=0.61; p=0.0001
yhcB; corr=0.61; p=0.001
hisS; corr=0.6; p=0.038
yciL; corr=0.6; p=0.017
nfnB; corr=0.6; p=0.024
yihA; corr=0.6; p=0.006
htpX; corr=0.59; p=0.018
aroH; corr=0.58; p=0.036
lspA; corr=0.57; p=0.002
yicH; corr=0.57; p=0.001
asnS; corr=0.57; p=0.043
msbA; corr=0.56; p=0.0001
yjbC; corr=0.55; p=0.0001
glmU; corr=0.53; p=0.0002
yfiC; corr=0.53; p=0.041
nrdA; corr=0.53; p=0.017
pmrD; corr=0.52; p=0.032
acnB; corr=0.49; p=0.037
ppiA; corr=0.48; p=0.035
eutB; corr=0.48; p=0.003
tolB; corr=0.47; p=0.005
xerD; corr=0.46; p=0.031
accA; corr=0.46; p=0.007
yibP; corr=0.45; p=0.0001
xseA; corr=0.44; p=0.0002
mdh; corr=0.41; p=0.039
yhcM; corr=0.39; p=0.038
pepD; corr=0.35; p=0.036
yggX; corr=0.32; p=0.04
recJ; corr=0.32; p=0.044
ycbG; corr=0.31; p=0.033
ynhG; corr=0.27; p=0.002
elaA; corr=0.27; p=0.026
yifK; corr=0.24; p=0.008
bglF; corr=0.23; p=0.001
yjiR; corr=0.21; p=0.046
thrA; corr=0.02; p=0.003
shiA; corr=0.01; p=0.012
Model profile
Model repression profile
Model repression profile
1
1.5
2
3
4
5
7
10
15
200.2
0.4
0.8
1
1.5
2
3
4
5
7
10
15
200.2
0.4
0.8
1
1.5
2
3
4
5
7
10
15
200.2
0.4
0.8
1:1 2:1 4:11: 4 1:2
Repressed InducedNo
change
R87.10 Genome Biology 2004, Volume 5, Issue 11, Article R87 Peter et al. />Genome Biology 2004, 5:R87
Discussion
In this analysis of supercoiling effects on transcription, we
identified 306 genes that quickly and reproducibly respond to
chromosomal relaxation. The comprehensive nature of our
investigation, with responses of 93% of the genome (4,003
protein-coding genes) in 21 different relaxation experiments
and 14 control experiments, allowed us to be more stringent
than previous studies in our definition of SSGs, and to iden-
tify those genes that had statistically significant changes after
the chromosome was relaxed by different methods. Genes
that are sensitive to relaxation but are also affected by tem-
perature shifts (including topA [41] and gyrA [42]) showed
changes in our control experiments, and thus had less signif-
icant p-values. Accordingly, although the topoisomerase
genes topA and gyrA both clearly respond to supercoiling
(see Figure 1 and [14-16]), they have p-values of 0.058 and
0.062, respectively (compared to the p-value of 0.001625 for
gyrB). The omission of these topoisomerase genes from our
list of SSGs reflects the conservative statistical approach we
used to define the list. There are probably other genes that
respond to supercoiling changes in different conditions from
those we tested (log-phase growth in rich media). Also, we
defined SSGs by focusing on the immediate effects of relaxa-
tion, and thus considered only primary transcriptional
changes, rather than downstream effects mediated by other
gene products (though we note that 14 of the SSGs encode
known transcriptional regulators). When downstream effects
are considered, changes in supercoiling are likely to affect
transcription of an even greater proportion of the genome.
There have been several previous attempts to measure the
effects of supercoiling on gene expression in E. coli. Two early
studies used either nylon membranes or two-dimensional
protein gels to compare topoisomerase mutants with slightly
different homeostatic levels of supercoiling, and neither study
found a large number of genes [43,44]. This could be due to
the lower sensitivity of these earlier studies and because they
measured steady-state gene expression, generations after the
initial mutations and subsequent adjustment to the new
supercoiling levels.
A more recent analysis by Church and colleagues used micro-
arrays to gauge the osmotic stress response of E. coli [20].
Surveying 2,146 genes that were above their threshold of
detection, the authors scored a subset of 30 genes that should
be significantly enriched for supercoiling-sensitive transcrip-
tion. Four of the genes identified are on our list of SSGs
(ynhG, yrbL, otsB and yifE). Seven others had p < 0.1 in our
relaxation experiments, and the rest had still higher p-values
in this study. It is possible that these genes are only respon-
sive to supercoiling changes in the context of osmotic stress.
Just as supercoiling is affected by many environmental
changes, such as osmotic shock, oxygen tension, nutrient
upshift and temperature change, so too do changes in super-
coiling affect genes in a large number of classes. Not surpris-
ingly, a substantial fraction (6.9%) of the SSGs encode genes
involved in DNA replication, recombination, modification
and repair. However, the SSGs span many other classes, and
thus are well positioned to feed into many different regulatory
Analysis of AT content in upstream regions of SSGsFigure 5
Analysis of AT content in upstream regions of SSGs. (a) The average
upstream AT content of 50,000 groups of 106 randomly selected genes.
The actual average upstream AT content of the group of 106 relaxation-
induced genes (red circle) lies well outside the distribution. (b) Average
AT content in a 100-nucleotide window is plotted against distance from
the start codon for relaxation-induced (red), relaxation-repressed (green)
and all other (black) genes for 300 nucleotides to either side of the
translation start site. The y-axis is drawn at the first nucleotide of the start
codon, and a horizontal line indicates 50% AT content. The relaxation-
induced genes show a significantly increased AT content relative to the
other sets of genes both before and after the start codon. The relaxation-
repressed genes show a milder depression of AT content over this region,
which is still significantly different from the rest of the genome. We found
no significant differences outside the region shown.
50 51 52 53 54
Frequency
−2,000 −1,000 0 1,000
AT content (%)
Relaxation-induced
Relaxation-repressed
Non-SSG
0
2,000
4,000
6,000
45
50
55
60
AT content (%)
Position (nucleotides)
(a)
(b)
Genome Biology 2004, Volume 5, Issue 11, Article R87 Peter et al. R87.11
comment reviews reports refereed researchdeposited research interactions information
Genome Biology 2004, 5:R87
networks. Thus, supercoiling can act as a second messenger
that quickly translates environmental changes to
transcriptional programs, inducing and repressing specific
genes independently of protein synthesis.
Several of the SSGs warrant further inspection. For example,
the repression of the smtAmukBEF operon on loss of super-
coiling is intriguing, given the importance of mukB, mukE
and mukF in chromosome supercoiling and segregation
[45,46]. Consistent with this, the XerC site-specific recombi-
nase, which is needed for proper chromosome partitioning, is
also repressed by relaxation. As (-) supercoiling promotes
chromosome segregation in E. coli [47], these genes may rep-
resent part of a supercoiling 'checkpoint' that senses whether
supercoiling levels are sufficient for proper chromosome seg-
regation. Thus, if there is insufficient (-) supercoiling to sup-
port chromosome segregation, transcription of these genes
may be suppressed until supercoiling is re-established.
Another relaxation-repressed gene that may be involved in
chromosomal maintenance is yrdD, a 'putative topoisomer-
ase'. yrdD encodes a 19 kilodalton (kDa) protein 30-40%
identical to the carboxy-terminal domain of topoisomerase I
from Bacillus subtilis, Helicobacter pylori and Methanococ-
cus jannaschii. The function of YrdD is unknown, but the
repression by chromosomal relaxation provides an intriguing
lead.
Chromosomal relaxation leads to the repression of cls (cardi-
olipin synthase) and ileS (isoleucine tRNA synthetase), which
is consistent with the earlier discovery that these genes were
involved in sensitivity to gyrase inhibitors [48]. Also, we
noted that the nucleotide salvage genes deoA and deoC are
induced on relaxation. For these genes, DNA relaxation may
be a signal of DNA damage, and their induction would allow
the cell to recycle nucleotides necessary for DNA repair.
Finally, the induction of rpoD, the σ
70
subunit of RNA
polymerase, may help the cell compensate for the increased
difficulty of melting the relaxed DNA template.
What is the basis of supercoiling sensitivity? Most of the well
controlled analyses of supercoiling-sensitive promoters,
notably of the lacp
s
and ilv
G
P [18,49-51], were done on plas-
mids in vitro. The more relevant issue is promoter regulation
on chromosomes in vivo, where other factors may dominate.
The CRP protein increases lac operon transcription at the low
to moderate superhelicities found in vivo, and the nucleoid-
associated protein IHF is implicated in the supercoiling sen-
sitivity of the ilvGMEDA operon [52]. Also, the relative levels
of the nucleoid-associated proteins IHF, H-NS and,
especially, Fis, can influence the local topology of DNA and
accordingly affect transcription of nearby promoters [53-55].
We found no significant enrichment of genes regulated by
IHF, H-NS, or Fis in our list of SSGs. However, we found that
chromosomal relaxation affected different promoters to vary-
ing extents, and it is possible that the effect of changes in
supercoiling may be amplified or attenuated at specific
promoters by the actions of DNA-binding proteins. Finally,
the proximity of genes to surrounding promoters and other
barriers to supercoil diffusion may affect the response to
supercoiling. For example, the modulation of the Salmonella
leu-500 promoter by supercoiling requires that the promoter
is either on the chromosome or on a plasmid anchored to the
cell membrane by transcription and translation of a gene such
as tetA [23]. Further analysis of supercoiling-sensitive pro-
moters will be more straightforward with the set of genes
identified in this paper and our finding that relaxation-
induced genes have an enriched AT content in the promoter
and initially transcribed sequences.
It is striking that there are so many relaxation-induced genes
that are relatively repressed when the chromosome is (-)
supercoiled. This is surprising because (-) supercoiling
should favor formation of an open promoter complex. The
promoter regions of many of the genes induced by relaxation
are AT rich, which will make it easier to form an open pro-
moter complex even when the DNA is relaxed and the energy
required is greater. Alternatively, the difference in AT content
could reflect structural features such as curvature or flexibil-
ity. Curved sequences of DNA can influence the position of
plectonemic supercoils, and thus could serve to localize a pro-
moter sequence to the apex of a superhelical loop [56]. We
note that the AT richness for the relaxation-induced genes
extends on both sides of the transcriptional start site. It has
been previously shown that promoter activity can be regu-
lated by the initial transcribed sequence [57,58]. Moreover, in
their analysis of the gyrA and gyrB promoters, Menzel and
Gellert [14] found that base-pairs downstream of the tran-
scriptional start were important for the supercoiling sensitiv-
ity of these promoters. These authors proposed that promoter
clearance may be the rate-limiting step during relaxation-
induced transcription of gyrA and gyrB. Promoter clearance
has also been invoked in the mechanism of supercoiling sen-
sitivity of some promoters in vitro [51]. As our group of relax-
ation-induced genes is AT rich over this region, we can extend
this hypothesis to transcription of many relaxation-induced
genes in vivo, and propose that promoter clearance is gener-
ally a key regulatory step for supercoiling sensitive
transcription.
The AT-rich regions of our relaxation-induced genes extend
downstream of the translational start site, and thus may
involve transcription elongation in addition to promoter
clearance. There is growing appreciation of the regulation of
transcription elongation [59-61]. The AT-rich regions deep
within the coding sequence of relaxation-induced genes may
reflect such regulation; easily melted regions of DNA may
facilitate the continued movement of RNA polymerase along
a relaxed, covalently closed template. At a given level of (-)
supercoiling, there is likely to be an optimum AT content that
facilitates both unwinding and subsequent closure of the
transcription bubble. This hypothesis is strengthened by the
R87.12 Genome Biology 2004, Volume 5, Issue 11, Article R87 Peter et al. />Genome Biology 2004, 5:R87
fact that the genes with the opposite response, the relaxation-
repressed genes, have a significantly depressed AT content
over the same region.
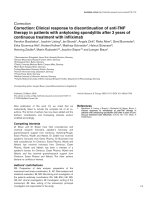
The SSGs are useful as topological probes of the chromosome
in living cells. While the SSGs are scattered throughout the
chromosome, they are not evenly spread, but rather have
regions of high and low density. The SSGs are plotted on a
chromosomal map in Figure 6. The density of SSGs as a per-
centage of all genes in a 20-kb region varies from 2% to more
than 20%. The regions with high SSG density may reflect spa-
tial covariations in transcription which were recently
described in the E. coli chromosome [62]. The distribution of
the SSGs may also be influenced by the organization of the
chromosome into topologically separate domains of super-
coiling. We have already used the SSGs as local reporters of
supercoiling to test the domains hypothesis. In recent work,
we monitored expression from the SSGs after cleaving the
chromosome with a restriction enzyme, and found that the
SSGs accurately reported the resulting relaxation of the chro-
mosome [63]. Relaxation diminished rapidly with distance
from a restriction site, indicating that there are about 450
topologically separate domains in the chromosome. We also
monitored transcription from the SSGs during replication in
synchronized cells [64]. Here we found that the relaxation-
induced and relaxation-repressed genes reported that super-
coiling is re-established very quickly after the passage of the
replication fork, again consistent with a large number of
topological domains. Thus, the SSGs are not only a useful tool
to study promoter regulation and the physiological effects of
supercoiling changes, but also can lead to new findings about
chromosome structure.
Chromosomal map of SSGsFigure 6
Chromosomal map of SSGs. Supercoiling-sensitive genes were mapped across the E. coli genome. Relaxation-induced genes are colored red and
relaxation-repressed genes are in green. Genes are dispersed through the entire chromosome, making them good sensors for local changes of supercoiling
of the chromosome.
Genome Biology 2004, Volume 5, Issue 11, Article R87 Peter et al. R87.13
comment reviews reports refereed researchdeposited research interactions information
Genome Biology 2004, 5:R87
Conclusions
We have shown that supercoiling acts as a transcription fac-
tor, with positive and negative effects on specific genes while
leaving the majority of the genome unchanged. Like other
transcription factors such as TrpR [65] and ArcA-P [66],
supercoiling affects transcription from a wider array of genes
than at first anticipated. The 306 genes that we identified as
robust SSGs are classified into many different functional
groups [67], including transcriptional regulators and genes in
the SOS, PhoB and stringent-response regulons [68]. Tran-
scriptional changes from the SSGs will affect a variety of tran-
scriptional and regulatory networks, and thus supercoiling
level is a global regulator that can affect a wide array of proc-
esses in the cell. As the topology of the chromosome is
affected by anoxia, ionic strength and growth conditions, the
cell can use supercoiling levels both to sense the environment
and to effect appropriate transcriptional responses.
Materials and methods
PCR materials and conditions
Amino- and carboxy-terminal primers for protein-coding
open reading frames (ORFs) of E. coli K-12, strain MG1655
(Sigma-Genosys), were generously supplied by Fred Blattner
(University of Wisconsin) and Carol Gross (University of Cal-
ifornia San Francisco). ORFs were amplified from MG1655
genomic DNA using ExTaq polymerase (PanVera) and failed
PCR reactions were attempted again using Platinum Taq
(Invitrogen) or previous successful reactions as the DNA tem-
plate. Ninety-six percent of the ORFs were successfully
amplified. PCR conditions were set according to those sup-
plied with the primers. DNA was precipitated with isopropa-
nol and prepared for microarray printing as described in [69].
We did not include the RNA-coding genes on the arrays
because primers for these genes were not initially available,
though we note that some genes, such as tyrT, have been
shown to respond to changes in supercoiling [70].
Microarray printing and processing
Detailed instructions on slide preparation, microarray print-
ing and processing microarrays can be found online [69].
384-well plates were dried down between prints and resus-
pended in deionized water each time after the first print.
RNA preparation and microarray hybridization
E. coli cells were grown with shaking in LB media to an OD
600
= 0.45-0.55 at 37°C, or at 30°C for temperature-sensitive
strains. Samples of cells were withdrawn at intervals and
added to a 1/10 volume of either 95% ethanol plus 5% phenol
or 2 M NaN
3
to stop transcription. Cells were then quickly
harvested by centrifugation in a microcentrifuge. The super-
natant was aspirated and the pellets frozen in liquid N
2
. Total
RNA was prepared using the Qiagen RNeasy mini kit, except
that 4 mg/ml lysozyme and a 30 sec incubation was used in
the first step. For each microarray, 20 µg total RNA was
primed with 1-2 µg of random hexamers and labeled by
reverse transcription in the presence of Cy3- and Cy5-conju-
gated dUTP (Amersham Biosciences). For each experiment or
condition, a Cy5-labeled experimental sample was combined
with a Cy3-labeled reference sample and hybridized to a proc-
essed microarray as described [69]. After 5-7 h hybridization,
microarrays were washed and scanned at 10 µm resolution
with a GenePix 4000A scanner (Axon Instruments).
Image processing
Scanned array images were visually inspected, and non-uni-
form spots were excluded from further analysis. The back-
ground was subtracted from the images that were then
(median) normalized using the Scanalyze 2.0 program, v. 1.44
(Michael Eisen, Lawrence Berkeley National Laboratory)
such that the total fluorescence in each channel was equal.
Data analysis
We tested several methods of imputation to estimate the val-
ues of spots missing due to hybridization defects (described in
[71]), and after error analysis of the different methods we
chose the weighted mean of K-nearest neighbors for K = 20.
With this method we obtained a total of 4,003 genes, or 93%
of the total number of E. coli genes, that could be considered
for further study. Because we were interested in changes in
expression levels due to variations in supercoiling rather than
to drug or genetic effects, we used a two-sample comparison
approach (comparing the mean over all relaxation experi-
ments with that of the control experiments) rather than a fac-
torial analysis approach. We tested two commonly used
methods to determine differentially expressed genes in the
comparison of two samples. We found that the method of
Dudoit et al [38], which controls the family-wise error (that
is, the probability of finding at least one false positive) was
slightly more stringent for our data than that developed by
Tusher et al [37].
Northern analysis
Samples were run on formaldehyde-MOPS 1% agarose gels
and blotted onto a nylon membrane [72].
32
P-labeled DNA
probes for gyrB and asnB (as a loading control) were
synthesized from their respective PCR products, and radioac-
tivity was quantified by a phosphorimager.
Assays of DNA topology
Plasmid DNA was extracted from cells by the alkaline lysis
method [72] or the Qiagen spin miniprep kit. The nor-
floxacin-resistant mutants and the gyrB234 mutant are in a
C600 strain background, but all strains used have been
described in greater detail elsewhere [26,35,73]. To increase
the intracellular concentration of novobiocin, we used a
∆
acrA strain that greatly slows drug efflux [74]. The superhe-
lical density, σ, of pBR322 was determined by band counting
[75] from the mean of the topoisomer distributions to a
relaxed, covalently closed reference plasmid (σ = 0) which
had been relaxed with calf thymus topoI. σ of pBR322 was
calculated with the formula σ =∆ Lk/Lk
0
, where Lk
0
for
R87.14 Genome Biology 2004, Volume 5, Issue 11, Article R87 Peter et al. />Genome Biology 2004, 5:R87
pBR322 = 4,361 bp/10.5 bp/turn = 415. Samples were run on
parallel 20-cm gels containing 0, 2.8 or 10 µg/ml chloroquine
for 18-26 h at 48-52 V with constant buffer recirculation,
which allowed visualization of the entire distribution of topoi-
somers. Gels were southern blotted [72], and hybridized with
a
32
P-labeled probe made from random priming of pBR322.
Radioactive blots were quantified using a phosphorimager.
Microarray validation
We tested the validity of our microarrays in three ways. First,
we compared gene expression ratios measured with microar-
rays to values obtained by northern hybridization. We meas-
ured induction ratios for gyrB by both methods 5 min after
addition of the gyrase inhibitor novobiocin to
∆
acrA cells at 5,
20, 50 and 200 µg/ml. The microarray ratios for these con-
centrations were 2.3, 4.8, 4.9 and 6.3, respectively, while the
ratios from northern hybridizations were 2.8, 4.7, 4.7 and 5.1.
Second, as an internal control we compared the transcription
of genes in 153 known polycistronic operons. We found no
operons with genes that changed expression more than 1.5-
fold in opposite directions (data not shown). Third, we com-
pared two identically grown cultures with the same microar-
ray (see Additional data file 4). We used two strains that were
isogenic, except that one had point mutations conferring nor-
floxacin resistance on gyrase and topo IV. The correlation
coefficient of the gene-expression levels was 0.982, indicating
the negligible variation between the cultures. In contrast,
when we treated cells with the gyrase inhibitor norfloxacin
(see Additional data file 4), the correlation coefficient with
respect to the untreated cells was only 0.391 and hundreds of
genes showed large differences in expression. We conclude
that gene-expression changes resulting from slight genotypic
changes or experimental repeats were negligible compared
with the changes resulting from topoisomerase inhibition,
and that the E. coli microarrays are a reliable method for
quantifying these changes.
Selection of supercoiling-sensitive genes
We limited the list of SSGs to those whose expression differ-
ence between treatments and controls was statistically signif-
icant (p-values < 0.05) over a total of 35 experiments, in
which DNA gyrase was inhibited with novobiocin, norfloxacin
or by a mutation that rendered gyrase temperature-sensitive.
Next we determined the correlation of gene expression with
the σ of a reference plasmid in the same cells. To calculate the
correlation of gene expression to plasmid supercoiling, we
created a model profile made up of the ratio of plasmid σ in
each experiment to plasmid σ in the (supercoiled) reference
for that experiment (Table 1). The maximum ratio was scaled
to 2.5, representing a σ of 0 (complete relaxation) and the
minimum ratio was scaled to 1, representing native supercoil-
ing levels (-0.06). The model repression profile is simply the
inverse of the model induction profile. Changes of the arbi-
trary scaling values did not alter the results. Correlation coef-
ficients in Figure 4 were calculated with respect to those 13
arrays only.
Additional data files
The following additional data files are available with the
online version of this paper: Additional data file 1 contains
data on the induction of the SOS response to DNA damage;
Additional data file 2 contains gene-expression ratios for all
genes across all experiments; Additional data file 3 contains
gene-expression ratios for supercoiling-sensitive genes across
all experiments; Additional data file 4 contains data on the
reproducibility of microarray measurement of RNA levels.
Additional data file 1Data on the induction of the SOS response to DNA damageData on the induction of the SOS response to DNA damageClick here for additional data fileAdditional data file 2Gene-expression ratios for all genes across all experimentsGene-expression ratios for all genes across all experimentsClick here for additional data fileAdditional data file 3Gene-expression ratios for supercoiling-sensitive genes across all experimentsGene-expression ratios for supercoiling-sensitive genes across all experimentsClick here for additional data fileAdditional data file 4Data on the reproducibility of microarray measurement of RNA levelsData on the reproducibility of microarray measurement of RNA levelsClick here for additional data file
Acknowledgements
We thank Carol Gross, Wonchul Suh, and Joe DeRisi for sharing PCR prim-
ers, technical assistance and useful discussion. We also thank Sydney Kustu
and Dan Zimmer for assistance with array printing and databases. Finally we
thank Lisa Postow for help with data processing and Figure 6, and S. Dudoit,
T. Speed and members of the Cozzarelli lab for useful discussion. This work
was supported by NIH grants to N.R.C. J.A. was partially supported by NSF
grant DMS-9971169. A.M.B. is supported by a Howard Hughes Medical
Institute Predoctoral Fellowship. P.O.B. is an associate investigator of the
Howard Hughes Medical Institute.
References
1. Funnell BE, Baker TA, Kornberg A: In vitro assembly of a prep-
riming complex at the origin of the Escherichia coli chromo-
some. J Biol Chem 1987, 262:10327-10334.
2. Lia G, Bensimon D, Croquette V, Allemand JF, Dunlap D, Lewis DE,
Adhya S, Finzi L: Supercoiling and denaturation in Gal repres-
sor/heat unstable nucleoid protein (HU)-mediated DNA
looping. Proc Natl Acad Sci USA 2003, 100:11373-11377.
3. Wang JC, Lynch AS: Effects of DNA supercoiling on gene
expression. Regulation of Gene Expression in Escherichia coli Edited by:
Lin ECC, Lynch AS Austin. TX: R.G. Landes Company; 1996:127-147.
4. Rui S, Tse-Dinh YC: Topoisomerase function during bacterial
responses to environmental challenge. Front Biosci 2003,
8:d256-d263.
5. Pruss GJ, Manes SH, Drlica K: Escherichia coli DNA topoisomer-
ase I mutants: increased supercoiling is corrected by muta-
tions near gyrase genes. Cell 1982, 31:35-42.
6. DiNardo S, Voelkel KA, Sternglanz R, Reynolds AE, Wright A:
Escherichia coli DNA topoisomerase I mutants have compen-
satory mutations in DNA gyrase genes. Cell 1982, 31:43-51.
7. Zechiedrich EL, Khodursky AB, Bachellier S, Schneider R, Chen D, Lil-
ley DM, Cozzarelli NR: Roles of topoisomerases in maintaining
steady-state DNA supercoiling in Escherichia coli. J Biol Chem
2000, 275:8103-8113.
8. Wang JC: Moving one DNA double helix through another by
a type II DNA topoisomerase: the story of a simple molecu-
lar machine. Q Rev Biophys 1998, 31:107-144.
9. Khodursky AB, Peter BJ, Schmid MB, DeRisi J, Botstein D, Brown PO,
Cozzarelli NR: Analysis of topoisomerase function in bacterial
replication fork movement: use of DNA microarrays. Proc
Natl Acad Sci USA 2000, 97:9419-9424.
10. Crisona NJ, Strick TR, Bensimon D, Croquette V, Cozzarelli NR:
Preferential relaxation of positively supercoiled DNA by E.
coli topoisomerase IV in single-molecule and ensemble
measurements. Genes Dev 2000, 14:2881-2892.
11. Champoux JJ: DNA topoisomerases: structure, function, and
mechanism. Annu Rev Biochem 2001, 70:369-413.
12. Lynch AS, Wang JC: Anchoring of DNA to the bacterial cyto-
plasmic membrane through cotranscriptional synthesis of
polypeptides encoding membrane proteins or proteins for
export: a mechanism of plasmid hypernegative supercoiling
in mutants deficient in DNA topoisomerase I. J Bacteriol 1993,
175:1645-1655.
13. Wang JC: Cellular roles of DNA topoisomerases: a molecular
perspective. Nat Rev Mol Cell Biol 2002, 3:430-440.
14. Menzel R, Gellert M: Fusions of the Escherichia coli gyrA and
gyrB control regions to the galactokinase gene are inducible
by coumermycin treatment. J Bacteriol 1987, 169:1272-1278.
15. Pruss GJ, Drlica K: DNA supercoiling and prokaryotic
Genome Biology 2004, Volume 5, Issue 11, Article R87 Peter et al. R87.15
comment reviews reports refereed researchdeposited research interactions information
Genome Biology 2004, 5:R87
transcription. Cell 1989, 56:521-523.
16. Tse-Dinh YC, Beran RK: Multiple promoters for transcription
of the Escherichia coli DNA topoisomerase I gene and their
regulation by DNA supercoiling. J Mol Biol 1988, 202:735-742.
17. Schneider R, Travers A, Muskhelishvili G: The expression of the
Escherichia coli fis gene is strongly dependent on the superhe-
lical density of DNA. Mol Microbiol 2000, 38:167-175.
18. Sheridan SD, Benham CJ, Hatfield GW: Activation of gene expres-
sion by a novel DNA structural transmission mechanism
that requires supercoiling-induced DNA duplex destabiliza-
tion in an upstream activating sequence. J Biol Chem 1998,
273:21298-21308.
19. Bebbington KJ, Williams HD: A role for DNA supercoiling in the
regulation of the cytochrome bd oxidase of Escherichia coli.
Microbiology 2001, 147:591-598.
20. Cheung KJ, Badarinarayana V, Selinger DW, Janse D, Church GM: A
microarray-based antibiotic screen identifies a regulatory
role for supercoiling in the osmotic stress response of
Escherichia coli. Genome Res 2003, 13:206-215.
21. DeRisi JL, Iyer VR, Brown PO: Exploring the metabolic and
genetic control of gene expression on a genomic scale. Science
1997, 278:680-686.
22. Wodicka L, Dong H, Mittmann M, Ho MH, Lockhart DJ: Genome-
wide expression monitoring in Saccharomyces cerevisiae. Nat
Biotechnol 1997, 15:1359-1367.
23. Chen D, Bowater R, Lilley DM: Topological promoter coupling
in Escherichia coli : delta topA-dependent activation of the
leu-500 promoter on a plasmid. J Bacteriol 1994, 176:3757-3764.
24. Gellert M, Mizuuchi K, O'Dea MH, Itoh T, Tomizawa JI: Nalidixic
acid resistance: a second genetic character involved in DNA
gyrase activity. Proc Natl Acad Sci USA 1977, 74:4772-4776.
25. Sugino A, Peebles CL, Kreuzer KN, Cozzarelli NR: Mechanism of
action of nalidixic acid: purification of Escherichia coli nalA
gene product and its relationship to DNA gyrase and a novel
nicking-closing enzyme. Proc Natl Acad Sci USA 1977,
74:4767-4771.
26. Khodursky AB, Zechiedrich EL, Cozzarelli NR: Topoisomerase IV
is a target of quinolones in Escherichia coli. Proc Natl Acad Sci
USA 1995, 92:11801-11805.
27. Chen CR, Malik M, Snyder M, Drlica K: DNA gyrase and topoi-
somerase IV on the bacterial chromosome: quinolone-
induced DNA cleavage. J Mol Biol 1996, 258:627-637.
28. Snyder M, Drlica K: DNA gyrase on the bacterial chromosome:
DNA cleavage induced by oxolinic acid. J Mol Biol 1979,
131:287-302.
29. Chaudhury AM, Smith GR: Role of Escherichia coli RecBC
enzyme in SOS induction. Mol Gen Genet 1985, 201:525-528.
30. Drlica K, Snyder M: Superhelical Escherichia coli DNA: relaxa-
tion by coumermycin. J Mol Biol 1978, 120:145-154.
31. Hardy CD, Cozzarelli NR: Alteration of Escherichia coli topoi-
somerase IV to novobiocin resistance. Antimicrob Agents
Chemother 2003, 47:941-947.
32. Gellert M, O'Dea MH, Itoh T, Tomizawa J: Novobiocin and cou-
mermycin inhibit DNA supercoiling catalyzed by DNA
gyrase. Proc Natl Acad Sci USA 1976, 73:4474-4478.
33. Gormley NA, Orphanides G, Meyer A, Cullis PM, Maxwell A: The
interaction of coumarin antibiotics with fragments of DNA
gyrase B protein. Biochemistry 1996, 35:5083-5092.
34. Hooper DC: Quinolone mode of action. Drugs 1995, 49:10-15.
35. Orr E, Staudenbauer WL: An Escherichia coli mutant thermo-
sensitive in the B subunit of DNA gyrase: effect on the struc-
ture and replication of the colicin E1 plasmid in vitro. Mol Gen
Genet 1981, 181:52-56.
36. Steck TR, Pruss GJ, Manes SH, Burg L, Drlica K: DNA supercoiling
in gyrase mutants. J Bacteriol 1984, 158:397-403.
37. Tusher VG, Tibshirani R, Chu G: Significance analysis of micro-
arrays applied to the ionizing radiation response. Proc Natl
Acad Sci USA 2001, 98:5116-5121.
38. Dudoit S, Yan YH, Speed TP, Callow MJ: Statistical methods for
identifying differentially expressed genes in replicated cDNA
microarray experiments. Statistica Sinica 2002, 12:111-139.
39. Westfall PH, Young SS: Resampling-Based Multiple Testing: Examples
and Methods for p-Value Adjustment New York: J. Wiley and Sons;
1993.
40. Bernstein JA, Khodursky AB, Lin PH, Lin-Chao S, Cohen SN: Global
analysis of mRNA decay and abundance in Escherichia coli at
single-gene resolution using two-color fluorescent DNA
microarrays. Proc Natl Acad Sci USA 2002, 99:9697-9702.
41. Richmond CS, Glasner JD, Mau R, Jin H, Blattner FR: Genome-wide
expression profiling in Escherichia coli K-12. Nucleic Acids Res
1999, 27:3821-3835.
42. Jones PG, Krah R, Tafuri SR, Wolffe AP: DNA gyrase, CS7.4, and
the cold shock response in Escherichia coli. J Bacteriol 1992,
174:5798-5802.
43. Chuang SE, Daniels DL, Blattner FR: Global regulation of gene
expression in Escherichia coli. J Bacteriol 1993, 175:2026-2036.
44. Steck TR, Franco RJ, Wang JY, Drlica K: Topoisomerase muta-
tions affect the relative abundance of many Escherichia coli
proteins. Mol Microbiol 1993, 10:473-481.
45. Yamanaka K, Ogura T, Niki H, Hiraga S: Identification of two new
genes, mukE and mukF, involved in chromosome partitioning
in Escherichia coli. Mol Gen Genet 1996, 250:241-251.
46. Weitao T, Nordstrom K, Dasgupta S: Escherichia coli cell cycle
control genes affect chromosome superhelicity. EMBO Rep
2000, 1:494-499.
47. Sawitzke JA, Austin S: Suppression of chromosome segregation
defects of Escherichia coli muk mutants by mutations in
topoisomerase I. Proc Natl Acad Sci USA 2000, 97:1671-1676.
48. Jovanovic M, Lilic M, Janjusevic R, Jovanovic G, Savic DJ, Milija J: tRNA
synthetase mutants of Escherichia coli K-12 are resistant to
the gyrase inhibitor novobiocin. J Bacteriol 1999, 181:2979-2983.
49. Borowiec JA, Gralla JD: All three elements of the lac ps pro-
moter mediate its transcriptional response to DNA
supercoiling. J Mol Biol 1987, 195:89-97.
50. Sheridan SD, Opel ML, Hatfield GW: Activation and repression of
transcription initiation by a distant DNA structural
transition. Mol Microbiol 2001, 40:684-690.
51. Lim HM, Lewis DE, Lee HJ, Liu M, Adhya S: Effect of varying the
supercoiling of DNA on transcription and its regulation. Bio-
chemistry 2003, 42:10718-10725.
52. Parekh BS, Hatfield GW: Transcriptional activation by protein-
induced DNA bending: evidence for a DNA structural trans-
mission model. Proc Natl Acad Sci USA 1996, 93:1173-1177.
53. Schneider R, Lurz R, Luder G, Tolksdorf C, Travers A, Muskhelishvili
G: An architectural role of the Escherichia coli chromatin pro-
tein FIS in organising DNA. Nucleic Acids Res 2001, 29:5107-5114.
54. Rimsky S, Zuber F, Buckle M, Buc H: A molecular mechanism for
the repression of transcription by the H-NS protein. Mol
Microbiol 2001, 42:1311-1323.
55. Opel ML, Aeling KA, Holmes WM, Johnson RC, Benham CJ, Hatfield
GW: Activation of transcription initiation from a stable RNA
promoter by a Fis protein-mediated DNA structural trans-
mission mechanism. Mol Microbiol 2004, 53:665-674.
56. Pedersen AG, Jensen LJ, Brunak S, Staerfeldt HH, Ussery DW: A
DNA structural atlas for Escherichia coli. J Mol Biol 2000,
299:907-930.
57. Chan CL, Gross CA: The anti-initial transcribed sequence, a
portable sequence that impedes promoter escape, requires
sigma70 for function. J Biol Chem 2001, 276:38201-38209.
58. Kammerer W, Deuschle U, Gentz R, Bujard H: Functional dissec-
tion of Escherichia coli promoters: information in the
transcribed region is involved in late steps of the overall
process. EMBO J 1986, 5:2995-3000.
59. Mooney RA, Artsimovitch I, Landick R: Information processing by
RNA polymerase: recognition of regulatory signals during
RNA chain elongation. J Bacteriol 1998, 180:3265-3275.
60. Mooney RA, Landick R: Tethering sigma70 to RNA polymerase
reveals high in vivo activity of sigma factors and sigma70-
dependent pausing at promoter-distal locations. Genes Dev
2003, 17:2839-2851.
61. Holmes SF, Erie DA: Downstream DNA sequence effects on
transcription elongation. Allosteric binding of nucleoside tri-
phosphates facilitates translocation via a ratchet motion. J
Biol Chem 2003, 278:35597-35608.
62. Jeong KS, Ahn J, Khodursky AB: Spatial patterns of transcrip-
tional activity in the chromosome of Escherichia coli. Genome
Biol 2004, 5:R86.
63. Postow L, Hardy CD, Arsuaga J, Cozzarelli NR: Topological
domain structure of the Escherichia coli chromosome. Genes
Dev 2004, 18:1766-1779.
64. Peter BJ: The Structure of Replicating DNA in Escherichia coli Berkeley,
CA: University of California, Berkeley; 2000.
65. Khodursky AB, Peter BJ, Cozzarelli NR, Botstein D, Brown PO,
Yanofsky C: DNA microarray analysis of gene expression in
response to physiological and genetic changes that affect
tryptophan metabolism in Escherichia coli. Proc Natl Acad Sci
R87.16 Genome Biology 2004, Volume 5, Issue 11, Article R87 Peter et al. />Genome Biology 2004, 5:R87
USA 2000, 97:12170-12175.
66. Liu X, De Wulf P: Probing the ArcA-P modulon of Escherichia
coli by whole-genome transcriptional analysis and sequence-
recognition profiling. J Biol Chem 2004, 279:12588-12597.
67. Blattner FR, Plunkett G 3rd, Bloch CA, Perna NT, Burland V, Riley M,
Collado-Vides J, Glasner JD, Rode CK, Mayhew GF, et al.: The com-
plete genome sequence of Escherichia coli K-12. Science 1997,
277:1453-1474.
68. Salgado H, Gama-Castro S, Martinez-Antonio A, Diaz-Peredo E,
Sanchez-Solano F, Peralta-Gil M, Garcia-Alonso D, Jimenez-Jacinto V,
Santos-Zavaleta A, Bonavides-Martinez C, Collado-Vides J: Regu-
lonDB (version 4.0): transcriptional regulation, operon
organization and growth conditions in Escherichia coli K-12.
Nucleic Acids Res 2004, 32 (Database issue):D303-D306.
69. microarrays.org [ />70. Free A, Dorman CJ: Escherichia coli tyrT gene transcription is
sensitive to DNA supercoiling in its native chromosomal
context: effect of DNA topoisomerase IV overexpression on
tyrT promoter function. Mol Microbiol 1994, 14:151-161.
71. Troyanskaya O, Cantor M, Sherlock G, Brown P, Hastie T, Tibshirani
R, Botstein D, Altman RB: Missing value estimation methods for
DNA microarrays. Bioinformatics 2001, 17:520-525.
72. Ausubel FM, Brent R, Kingston RE, Moore DD, Seidman JG, Smith JA,
Struhl K: Current Protocols in Molecular Biology New York, NY: Wiley-
Interscience; 1989.
73. Zechiedrich EL, Khodursky AB, Cozzarelli NR: Topoisomerase IV,
not gyrase, decatenates products of site-specific recombina-
tion in Escherichia coli. Genes Dev 1997, 11:2580-2592.
74. Nikaido H, Thanassi DG: Penetration of lipophilic agents with
multiple protonation sites into bacterial cells: tetracyclines
and fluoroquinolones as examples. Antimicrob Agents Chemother
1993, 37:1393-1399.
75. Keller W: Determination of the number of superhelical turns
in simian virus 40 DNA by gel electrophoresis. Proc Natl Acad
Sci USA 1975, 72:4876-4880.