Báo cáo y học: "Genome-wide patterns of carbon and nitrogen regulation of gene expression validate the combined carbon and nitrogen (CN)-signaling hypothesis in plants" pptx
Bạn đang xem bản rút gọn của tài liệu. Xem và tải ngay bản đầy đủ của tài liệu tại đây (272.54 KB, 15 trang )
Genome Biology 2004, 5:R91
comment reviews reports deposited research refereed research interactions information
Open Access
2004Palencharet al.Volume 5, Issue 11, Article R91
Research
Genome-wide patterns of carbon and nitrogen regulation of gene
expression validate the combined carbon and nitrogen
(CN)-signaling hypothesis in plants
Peter M Palenchar
*
, Andrei Kouranov
†
, Laurence V Lejay
‡
and
Gloria M Coruzzi
§
Addresses:
*
Department of Chemistry, Rutgers University, Camden, NJ 10003, USA.
†
Center for Bioinformatics, University of Pennsylvania,
423 Guardian Drive, Philadelphia, PA 19104, USA.
‡
Laboratoire de Biochimie et physiologie moleculaire des plantes, 2 Place Viala, 34060
Montpellier Cedex 1, France.
§
Department of Biology, New York University, 100 Washington Square East, New York, NY 10003, USA.
Correspondence: Gloria M Coruzzi. E-mail:
© 2004 Pelenchar et al.; licensee BioMed Central Ltd.
This is an Open Access article distributed under the terms of the Creative Commons Attribution License (
which permits unrestricted use, distribution, and reproduction in any medium, provided the original work is properly cited.
Genome-wide patterns of carbon and nitrogen regulation of gene expression validate the combined carbon and nitrogen (CN)-signaling hypothesis in plants<p>Microarray analysis and the 'InterAct class' method were used to study interactions between carbon and nitrogen signaling in <it>Ara-bidopsis</it>.</p>
Abstract
Background: Carbon and nitrogen are two signals that influence plant growth and development.
It is known that carbon- and nitrogen-signaling pathways influence one another to affect gene
expression, but little is known about which genes are regulated by interactions between carbon
and nitrogen signaling or the mechanisms by which the different pathways interact.
Results: Microarray analysis was used to study global changes in mRNA levels due to carbon and
nitrogen in Arabidopsis thaliana. An informatic analysis using InterAct Class enabled us to classify
genes on the basis of their responses to carbon or nitrogen treatments. This analysis provides in
vivo evidence supporting the hypothesis that plants have a carbon/nitrogen (CN)-sensing/regulatory
mechanism, as we have identified over 300 genes whose response to combined CN treatment is
different from that expected from expression values due to carbon and nitrogen treatments
separately. Metabolism, energy and protein synthesis were found to be significantly affected by
interactions between carbon and nitrogen signaling. Identified putative cis-acting regulatory
elements involved in mediating CN-responsive gene expression suggest multiple mechanisms for
CN responsiveness. One mechanism invokes the existence of a single CN-responsive cis element,
while another invokes the existence of cis elements that promote nitrogen-responsive gene
expression only when present in combination with a carbon-responsive cis element.
Conclusion: This study has allowed us to identify genes and processes regulated by interactions
between carbon and nitrogen signaling and take a first step in uncovering how carbon- and
nitrogen-signaling pathways interact to regulate transcription.
Background
Carbon and nitrogen are two major macronutrients required
for plant growth and development. Specific carbon and nitro-
gen metabolites act as signals to regulate the transcription of
genes encoding enzymes involved in many essential proc-
esses, including photosynthesis, carbon metabolism,
Published: 29 October 2004
Genome Biology 2004, 5:R91
Received: 7 July 2004
Revised: 31 August 2004
Accepted: 23 September 2004
The electronic version of this article is the complete one and can be
found online at />R91.2 Genome Biology 2004, Volume 5, Issue 11, Article R91 Palenchar et al. />Genome Biology 2004, 5:R91
nitrogen metabolism, and resource allocation [1-5]. For
example, studies have shown that carbon sources (for exam-
ple, glucose or sucrose) affect the expression of genes
involved in nitrogen metabolism, including genes encoding
nitrate transporters and nitrate reductase [6,7]. Conversely,
nitrogen sources (such as nitrate) have been shown to affect
the expression of genes involved in carbon metabolism,
including genes encoding PEP carboxylase and ADP-glucose
synthase [8]. Responses to carbon and nitrogen result in
important changes at the growth/phenotypic level as well.
For example, carbon and nitrogen treatments have antago-
nistic effects on lateral root growth [9], while their effect on
cotyledon size, chlorophyll content and endogenous sugar
levels appear to be synergistic [10].
In plants, there are multiple carbon-responsive signaling
pathways [11-13], and progress has been made in uncovering
parts of the sugar-sensing mechanisms in plants, including
the identification of a putative glucose sensor, hexokinase
[14]. However, our current knowledge of the mechanisms by
which genes and biological processes are regulated by carbon
signaling in plants and how they are regulated at the level of
transcription is still limited. For example, a search of the
PlantCare [15,16] and TRANSFAC [17] databases revealed
only seven plant cis elements that have been shown to be car-
bon-responsive cis elements (C-elements) and none has been
identified from studies in Arabidopsis thaliana. Although
much less is known concerning the mechanisms controlling
nitrogen signaling, microarray analysis has been used to
identify nitrogen-responsive genes [8,18]. It has recently
been proposed that glutamate receptor 1.1 (AtGLR1.1) func-
tions as a regulator of carbon and nitrogen metabolism in A.
thaliana [19], but a global understanding of the genes and
processes that are regulated by carbon and nitrogen signaling
in plants and the mechanism by which this occurs is still
lacking.
Previously, microarrays were used to identify genes and bio-
logical processes regulated by interactions between carbon
and light signaling in A. thaliana, including the identification
of a putative cis regulatory element that is responsive to either
light or carbon signals [13]. In this study, we present a
genome-wide analysis of the effects of transient carbon and/
or nitrogen treatments on mRNA levels, with a particular
focus on genes whose mRNA levels are affected by the carbon
and nitrogen (CN) treatment. This study has enabled us to
evaluate a number of models for intersections between car-
bon and nitrogen signaling (Figure 1) and to identify genes
and biological processes that are regulated by the interactions
between carbon and nitrogen signaling pathways. In addi-
tion, we have identified putative cis elements that may be
responsible for coordinating a gene's responses to both these
signaling pathways.
Results
Testing models of carbon and nitrogen regulation
The goal of this study was to use a genomic approach to test
the hypothesis that carbon and nitrogen signaling pathways
interact to regulate the expression of genes in Arabidopsis.
We predicted six general models that could describe the pos-
sible modes of gene regulation due to carbon, nitrogen and
CN together. Three of these models do not involve interac-
tions between carbon and nitrogen signaling. The 'No effect'
model includes genes not regulated by carbon, nitrogen and/
or CN. The 'C-only' model includes genes regulated only by
carbon. Finally, the 'N-only' model includes genes regulated
only by nitrogen. Three additional models are needed to
describe the regulation of genes affected by interactions
between carbon and nitrogen signaling (Figure 1a). Model 1
(CN independent) depicts a gene W, for which carbon and
nitrogen signals act as independent pathways, so that the
effects of carbon and nitrogen are additive. Model 2 (CN
dependent) depicts a gene X, for which regulation requires
carbon and nitrogen, and neither carbon alone nor nitrogen
alone has an effect. Model 3 (CN dependent/independent)
incorporates both an independent and a dependent compo-
nent to the interactions of carbon and nitrogen signaling. For
gene Y, carbon alone has an independent inductive effect,
while nitrogen has a carbon-dependent effect as it can
enhance the effect of carbon, but has no effect on its own
(Model 3 CN-enhanced). For gene Z, nitrogen alone has an
independent inductive effect, while carbon has a nitrogen-
dependent effect. These general models can be broken down
into more descriptive sub-models. For example, Model 2 can
be broken into two sub-models for which CN results in either
an inductive or repressive effect.
To test the in vivo significance of the above models, a micro-
array analysis of RNA from plants treated transiently with
distinct carbon and nitrogen treatments was carried out, and
the results were analyzed to determine the carbon and nitro-
gen regulation of different genes. For this study, we analyzed
RNA isolated from Arabidopsis seedlings exposed to four dif-
ferent transient carbon and/or nitrogen treatments (-C/-N,
+C/-N, -C/+N, and +C/+N) (Figure 2) using Affymetrix
whole-genome microarray chips. Analysis of gene expression
across these treatments was performed on the whole genome
using InterAct Class [13,20], an informatic tool that enabled
us to classify genes into each of the above models based on
their relative responses to carbon and/or nitrogen treat-
ments. The analysis of the microarray data with InterAct
Class enabled us to group genes whose relative responses to
carbon, nitrogen and CN were similar to each other. In this
case, each InterAct class is made up of four values listed in the
following order: value 1 = the expression due to carbon; value
2 = the expression due to nitrogen, value 3 = the expression
due to carbon and nitrogen supplied as a combined treatment
(CN); and value 4 = the synthetic expression of C+N calcu-
lated by adding the expression due to carbon plus the expres-
sion due to nitrogen, which is a 'virtual' treatment.
Genome Biology 2004, Volume 5, Issue 11, Article R91 Palenchar et al. R91.3
comment reviews reports refereed researchdeposited research interactions information
Genome Biology 2004, 5:R91
InterAct Class is a ranking system used to qualitatively com-
pare gene-expression profiles across multiple treatments. For
each gene, each treatment is assigned a value representing the
effect of the treatment on the expression of that gene. Treat-
ments that result in repression of a gene are assigned a nega-
tive number, treatments that do not significantly affect a gene
are assigned zero, and treatments that cause induction are
assigned a positive number. If more than one treatment
causes induction or repression, the treatments are ranked so
that the treatment that causes the most induction or repres-
sion will be assigned the number furthest from zero. The four
hypothetical genes in Figure 1a (W, X, Y and Z) were classified
by InterAct Class (Figure 1b), demonstrating that, with this
program it becomes easy to determine whether the regulation
of a gene is due to a complex (non-additive) interaction
between carbon and nitrogen signaling. For such genes, the
value assigned to CN (the third InterAct Class number) will be
higher or lower than the value assigned to C+N (the fourth
InterAct Class number). These genes will fall into Models 2
and 3 (Figure 1b, genes X, Y and Z).
Out of 23,000 genes on the Affymetrix chip, 3,652 passed our
stringent filtering criteria for reproducibility among
treatment replicates and were assigned an InterAct class. Our
subsequent analysis of the expression patterns of these 3,652
genes validated the existence of 60 different InterAct classes
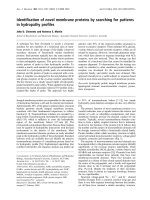
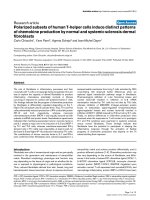
Transcriptional regulation by carbon and nitrogen interactionsFigure 1
Transcriptional regulation by carbon and nitrogen interactions. (a) Interactions between carbon (C) and nitrogen (N) signaling can be explained by three
models, and an example(s) of each is given. Model 1, carbon and nitrogen regulation are independent and therefore are additive. Model 2, carbon and
nitrogen are dependent, as both are required for an effect. Model 3, there is a dependent and independent component to carbon and nitrogen regulation.
Two examples of Model 3 are shown (genes Y and Z). For gene Y, nitrogen only has an effect in the presence of carbon, while for gene Z, carbon only has
an effect in the presence of nitrogen. (b) The assignment of genes W, X, Y, and Z to InterAct classes.
Model 2 Model 3Model 1
(CN independent)
Gene W Gene X Gene Y Gene Z
(CN dependent) (CN dependent/independent)
CC CCN
AND
N
AND
N
AND
Model 3
(CN dependent/independent)
N
AND
InterAct class Gene
C N CN C+N
X1122
W1122
Y0010
Z1021
(a)
(b)
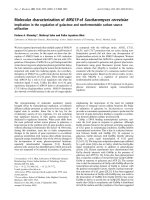
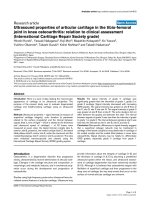
Treatments for carbon and nitrogen interaction studiesFigure 2
Treatments for carbon and nitrogen interaction studies. +C, -C, with and
without carbon, respectively. +N, -N, with and without nitrogen,
respectively.
6 mM N
0 mM C
0 mM N
30 mM C
−N +C
−N −C
+N +C
+N −C
Treatment 1
Treatment 2
Treatment 4
Treatment 3
R91.4 Genome Biology 2004, Volume 5, Issue 11, Article R91 Palenchar et al. />Genome Biology 2004, 5:R91
Table 1
InterAct classes that contain more than one gene
CN model Number of genes InterAct class
C N CN C+N
No effect 1,1670000
C-only Inductive 1,0111011
Repressive 596 -1 0 -1 -1
N-only Repressive 4 0 -1 -1 -1
C dominates 187 1 -1 1 1
156 -1 1 -1 -1
142 2122
140 -2 -1 -2 -2
Model 1 (independent) N dominates 3 -1 1 1 1
Equal effect 145 -1 -1 -1 -1
63 1111
Antagonistic 6 2 -1 1 1
3 -2 1 -1 -1
Inductive 4 2133
3 1122
Repressive 3 -1 -1 -2 -2
2-2-1-3-3
Model 2 (dependent)Inductive 7 0010
Repressive 2 0 0-10
Model 3 (dependent/ independent)CN-enhanced92 1021
25 2132
13 -1 -1 -1 -2
11 -2 -1 -2 -3
82-121
81-121
40-10-1
30-11-1
2 2143
2-3-1-2-3
CN-suppressed 46 -2 1 -2 -1
17 -11-10
9-12-11
9 -1 0 -2 -1
9 1112
8-11-11
Genome Biology 2004, Volume 5, Issue 11, Article R91 Palenchar et al. R91.5
comment reviews reports refereed researchdeposited research interactions information
Genome Biology 2004, 5:R91
(Table 1 and Additional data file 1). These 60 InterAct classes
represent a broad spectrum of expression patterns that vali-
date each of the six general models for gene regulation. This
analysis shows that of the 3,652 genes in the analysis, the vast
majority (2,485) is responsive to carbon and/or nitrogen
treatment. Moreover, almost half of these genes (1,175 genes)
are regulated by an interaction between carbon and nitrogen
signaling (Table 1). For example, there are 175 genes that are
in Model 3 CN-enhanced, for which expression due to CN is
greater than expression due to C+N (Table 1 and Additional
data file 1). This suggests that an interaction between carbon
and nitrogen signaling affects the expression of this set of
genes.
MIPS funcat analysis uncovers biological processes that
are regulated by carbon and/or nitrogen
The InterAct classes were assigned to one of the six general
models. To identify biological processes that contain a signif-
icant number of genes regulated by carbon, nitrogen and/or
CN, we determined which Munich Information Center for
Protein Sequences (MIPS) functional categories (funcats)
[21,22] were statistically under-represented in the No effect
model (InterAct class 0000), compared to all the genes
assigned an InterAct class (Table 2) (not to all the genes in the
genome; this takes into account any bias that may have
occurred as a result of the filtering process before InterAct
class analysis). Under-representation of a biological process
in the No effect model means that for that particular funcat,
there are fewer genes in the No effect model than expected on
the basis of how all the genes assigned to an InterAct class
behave. This means that processes under-represented in the
0000 InterAct class contain a significant number of genes
that respond to carbon and/or nitrogen treatments compared
to the general population of genes in the analysis.
For example, 31.6% (1,089/3,447) of the genes assigned to an
InterAct class and a funcat are assigned to the No effect model
(Table 2). This percentage was used as a basis of comparison
to determine if genes in any specific funcat varied signifi-
cantly from the general population. For example, if genes in
the metabolism funcat are not regulated by carbon and/or
nitrogen in a significant fashion, the number of genes
expected to be in the No effect model would be equal to the
total number of genes in the metabolism funcat that are
assigned an InterAct class (496) times 0.316, which would
equal 156.7 genes. However, the actual number of metabolism
genes in the No effect model is 120, which is significantly less
than 156.7 (p-value = 6.0 × 10
-4
). Therefore, the metabolism
funcat is under-represented in the No effect model, showing
that metabolism displays significant regulation by carbon
and/or nitrogen. This analysis revealed several primary
funcats (01 = metabolism, 02 = energy and 05 = protein syn-
thesis) that are significantly under-represented in the No
effect model (Table 2). Thus, a significant number of genes
6 0101
6 2012
3 2123
211-11
2 -1101
2 1213
2 1001
21-1-11
201-11
Table 2
Funcats that are statistically under-represented in InterAct class 0000 (the No effect model)
Funcats Number of genes assigned an InterAct class Number of InterAct class 0000 genes p-value
All funcats 3,447 1,089 -
Metabolism 496 120 6.0 × 10
-4
Protein synthesis 218 55 2.6 × 10
-2
Energy 125 21 1.34 × 10
-4
Table 1 (Continued)
InterAct classes that contain more than one gene
R91.6 Genome Biology 2004, Volume 5, Issue 11, Article R91 Palenchar et al. />Genome Biology 2004, 5:R91
involved in metabolism, protein synthesis and energy
respond to carbon, nitrogen and/or CN.
For the funcats that are under-represented in the No effect
model, this type of analysis was extended to examine the reg-
ulation of these funcats in all of the sub-models. This analysis
enabled us to determine into which sub-models the genes
from these funcats fell and to determine whether the genes in
these funcats are under- and over-represented (-S and +S
respectively) in these sub-models (Table 3) (see Additional
data file 1 for the p-value, and the funcat analysis extended to
every sub-model and every funcat).
Identification of cis elements associated with CN-
regulated genes
To begin to elucidate the mechanisms that control gene regu-
lation in response to carbon and nitrogen treatments, we
sought to identify putative cis elements that might be respon-
sible for regulating genes in Model 3 CN-enhanced (Table 1).
These genes are likely to contain cis elements involved in
interactions between carbon and nitrogen signaling because
the expression due to CN is greater than that due to C+N. Pre-
viously, genes that are biologically related and similarly
expressed were used to find putative cis-regulatory elements
involved in carbon and/or light regulation [13]. For this
study, to identify related genes in metabolism, we added a
new statistical functionality to the informatic tool PathEx-
plore [23], which enabled us to identify metabolic pathways
that contain more genes than expected in a list of genes [24].
As used here, PathExplore is useful to find functionally
related genes from analyses that combine data from multiple
microarray chips (for example, InterAct Class and clustering).
In this case, we searched for pathways that contained more
than the expected number of genes in Model 3 CN-enhanced,
compared to the general population. Three genes involved in
ferredoxin metabolism were found to be over-represented in
Model 3 CN-enhanced (p-value = 0.022) (Table 4a). These
genes were also found to be induced in roots and shoots of
nitrate-treated plants [18], and the protein products of these
genes are all predicted to be localized to the chloroplast [25],
further suggesting that they are biologically related and co-
regulated.
As we found that genes in the funcat protein synthesis are
over-represented in Model 3 CN-enhanced (Table 3), we
selected a set of genes in protein synthesis that are in Model 3
CN-enhanced for additional cis search analysis. Four nuclear
genes encoding ribosomal proteins predicted to be localized
to the mitochondria [25] were assigned to InterAct class 1021
(Table 4b). These four genes meet the criteria of being biolog-
ically related and having similar expression patterns and were
also analyzed for potential cis-regulatory elements. Over-rep-
resented motifs in the promoters of the four protein synthesis
genes or the three ferredoxin metabolism genes were identi-
fied using AlignAce [26,27] (AlignAce motifs).
We predicted two general mechanisms for which we might be
able to identify cis-regulatory elements by which carbon and
nitrogen can have a non-additive effect (for example, Model 3
CN-enhanced) on the transcription of a gene (Figure 3).
These models predict that because the genes used for cis dis-
covery are induced by carbon alone, there must be a tran-
scription factor (and cognate cis element) that responds to
carbon alone. Such carbon-responsive cis elements (C-ele-
ments) can be identified because they should also be over-
represented in the promoters of genes that are induced by
carbon alone (the C-only inductive model). From this analy-
sis, a number of the AlignAce motifs identified from the ferre-
doxin metabolism and protein synthesis genes in the Model 3
CN-enhanced were also shown to be associated with C-only
inductive model genes (Table 5; C1-C11). The simplest model
that could result in the expression due to CN being greater
than C+N is depicted in Figure 3a. In this model, the
promoters that contain a C-element are also regulated by a
completely independent transcription factor (and cognate cis
element) that responds specifically to a CN-signaling pathway
(Figure 3a). If such a CN-responsive cis element (CN-ele-
ment) exists, it would be predicted to be over-represented in
the promoters of genes in Model 3 CN-enhanced, but would
not be over-represented in the C-only inductive model. Two
Table 3
Sub-models that are misrepresented in the metabolism, protein synthesis and energy funcats
Funcats No effect (1,089) C-only CN interactions
Model 1 Model 3
Inductive (675) Repressive (567) Equal effect (195) CN suppressed (127) CN enhanced (163)
Metabolism 120 -S 141 +S 62 -S 19 -S 34 +S 20
Protein synthesis 55 -S 81 +S 13 -S 4 -S 2 -S 32 +S
Energy 21 -S 32 29 +S 3 8 5
+S, sub-model over-represented; -S, sub-model under-represented. See text for details.
Genome Biology 2004, Volume 5, Issue 11, Article R91 Palenchar et al. R91.7
comment reviews reports refereed researchdeposited research interactions information
Genome Biology 2004, 5:R91
of the AlignAce motifs fit this pattern (motifs CN1 and CN2,
Table 5), suggesting that they are CN-elements.
If CN1 and CN2 regulate gene expression, they might be
expected to be evolutionarily conserved. Unfortunately, A.
thaliana and/or Oryza sativa have multiple genes encoding
ferredoxin and ferrodoxin reductase, and as such, the true
orthologs of the genes used for this analysis can not be con-
clusively identified for a promoter analysis (the same is true
for the ribosomal genes used for analysis). Another prediction
is that if CN1 and CN2 regulate gene expression, biologically
related genes might also contain CN1 and CN2. Interestingly,
ferredoxin-dependent nitrite reductase (At2g15620) contains
three copies of CN1 and one copy of CN2 in its promoter. This
gene is in Model 3 CN-enhanced (InterAct class 1021), its pro-
tein product is localized to the chloroplast [25] and its expres-
sion is induced in shoot and roots of nitrate-treated plants
[8], suggesting that the gene is biologically related to and co-
Table 4
Genes used to drive cis analysis
Gene Enzyme Class
C N CN C+N
(a) Genes from pathways that are over-represented in Model 3 CN enhanced
At2g27510 Ferredoxin 1 0 2 1
At1g30510 Ferredoxin-NADP
+
reductase1021
At4g05390 Ferredoxin-NADP
+
reductase2132
(b) Genes involved in protein synthesis were also used to drive the cis analysis
At1g07070 60S Ribosomal protein L35a 1 0 2 1
At2g36620 60S Ribosomal protein L24 1 0 2 1
At5g07090 40S Ribosomal protein S4 1 0 2 1
At5g58420 40S Ribosomal protein S4 1 0 2 1
Table 5
Motifs that are over-represented in Model 3 CN-enhanced or in the C-only inductive model
Motif C-only inductive p-value Model 3 CN-enhanced p-value Element name
Ferredoxin-related motifs
RGAAVMANA NS 0.0262 CN1
GNAANVMGAHNM NS 0.0089 CN2
GAWYTGA 0.0073 NS C1
ARNNGANNCAA 0.00049 NS C2
KMSAGAG 0.0322 NS C3
WMNCHGAANC 0.0091 NS C4
GAGARRDDG 0.0375 NS C5
Protein-synthesis related motifs
WKGGGCC <0.0001 <0.0001 C6
GGCCSAW <0.0001 <0.0001 C7
AAACYCNA 0.0375 0.0038 C8
WTBGGCY 0.0022 0.011 C9
GDNTTGKAM 0.0359 NS C10
AAGAAAA 0.0344 NS C11
Nucleotide abbreviations: R; A or G, Y; C or T, W; A or T, S; G or C, M; A or C, K; G or T, H; A, C or T, B; G, C or T, V; G, A or C, D; G, A or
TC, N; G, A, C or T.
R91.8 Genome Biology 2004, Volume 5, Issue 11, Article R91 Palenchar et al. />Genome Biology 2004, 5:R91
regulated with the ferredoxin and ferredoxin reductase genes
used for this analysis. We next tested if finding three copies of
CN1 and one copy of CN2 in the promoter of ferredoxin-
dependent nitrite reductase was statistically likely by testing
randomized versions of the promoter. We found that three
copies of CN1 were unlikely (p-value = 0.0364), but it would
not be unlikely to find one copy of CN2 (p-value = 0.200). In
addition, a total of four copies of CN1 and CN2 was very
unlikely (p-value = 0.018) in any combination (for example,
three CN1 and one CN2, two CN1 and two CN2, or one CN1
and two CN2, and so on).
As A. thaliana has only one copy of ferredoxin-dependent
nitrite reductase, we searched the O. sativa genome sequence
for ferredoxin-dependent nitrite reductase genes. Again, we
found only one gene [28]. BLAST [29] did not find enough
similarity between the promoters of the A. thaliana ferre-
doxin-dependent nitrite reductase gene and the O. sativa
gene for an alignment. Despite this lack of similarity, we
tested for the presence of CN1 and CN2 in the promoter of this
gene; three copies of CN1 (p-value = 0.052) and one copy of
CN2 (p-value = 0.389) were found. Again, it was very unlikely
that a total of four copies of CN1 and CN2 (p-value = 0.045)
would occur in the promoter sequence.
Identification of nitrogen-dependent enhancers of
carbon regulation (NDEs)
A second mechanism by which the expression due to CN
could be greater than C+N could involve a nitrogen-respon-
sive cis element that alone has little or no effect on gene reg-
ulation, but when present in combination with a C-element,
enhances the induction caused by carbon and is dependent on
a carbon-responsive transcription factor (Figure 3b). Other
regulatory modules in plants have been identified in which
the regulation due to one cis element requires the presence of
another [30]. In the example examined here, the nitrogen-
dependent cis element enhances the induction caused by the
C-element, making it a nitrogen-dependent enhancer of car-
bon regulation (NDE). To identify NDEs, our strategy for cis
element identification was modified. NDEs would be
expected to be over-represented in the promoters of Model 3
CN-enhanced genes, but only when present in combination
with a separate C-element, as both elements are required to
give the enhanced expression due to CN. However, some of
the AlignAce motifs are potentially involved in regulating
expression due to the carbon treatment in cooperation with
the already identified C-elements. These cis elements would
be similar to NDEs as they would be over-represented in
genes induced by carbon in combination with the already
identified C-elements. As these motifs are not NDEs, we
sought to identify them and remove them from the analysis.
AlignAce motifs were tested to determine whether they are
over-represented in the promoters of genes whose promoters
contain any of the C-elements and are in the C-only inductive
model. Those that were found to be over-represented were
eliminated from further analysis because these motifs are
potentially involved in carbon regulation and are not NDEs.
Next, the remaining 33 AlignAce motifs were tested to deter-
mine if any are NDEs by determining whether they are over-
represented in combination with a C-element within the pro-
moters of the Model 3 CN-enhanced genes. Seven of the
potential NDEs are over-represented (p-value < 0.05) with at
least one C-element in the promoters of the Model 3 CN-
enhanced genes, resulting in 12 significant combinations
between putative NDEs and C-elements (that is, some of the
potential NDEs are over-represented with more than one C-
element; data not shown).
To determine if this approach resulted in an enrichment of
NDEs, the promoter sequence of each gene was randomized,
and the same test was performed. This enabled us to
determine whether the remaining 33 AlignAce motifs were
over-represented in combination with each C-element in the
randomized promoters of the Model 3 CN-enhanced genes.
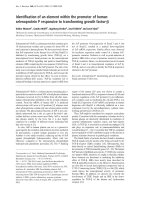
Two general mechanisms that would result in CN expression being greater than C+NFigure 3
Two general mechanisms that would result in CN expression being
greater than C+N. (a) Carbon (C) and CN regulatory elements are
independent and do not interact. The data do not allow us to rule out the
possibility that the C-element is inactive in the presence of CN and that
the CN-element alone results in more expression than the C-element. (b)
CN and carbon regulation are dependent. The increase in expression due
to CN requires two interacting cis elements, one of which is a C-element
and the other a nitrogen-dependent enhancer of carbon regulation (NDE).
1
N treatment
0
CN treatment
2
C+N 1
Dependent
C treatment
Independent
C treatment
C-element NDE
NDE
NDE
C-element
C-element
1
N treatment
0
CN treatment
2
C+N 1
C-element
CN-element
C-element
C-element
CN-element
CN-element
InterAct
class
InterAct
class
(a)
(b)
Genome Biology 2004, Volume 5, Issue 11, Article R91 Palenchar et al. R91.9
comment reviews reports refereed researchdeposited research interactions information
Genome Biology 2004, 5:R91
Sets of the randomized promoters (200 sets) were tested, and
none of them had as many significant pairs of potential nitro-
gen-dependent enhancers of carbon regulation and C-ele-
ments than the 12 found in the actual promoters. This
randomization proves that our approach successfully
enriched for NDEs in the actual promoters of the Model 3 CN-
enhanced genes and that all the observed significant combi-
nations cannot be due to false positives (p-value < 0.005).
Not surprisingly, each of the seven potential NDEs was found
to be over-represented with C-elements using the rand-
omized promoters. This shows that false positives can occur
in testing for NDEs. The results from the randomized pro-
moters were used to identify which potential NDEs are over-
represented with more C-elements than expected (that is, all
the combinations for that NDE cannot be explained by false
positives). Two NDEs (N1 and N2) were found to be
associated with C-elements (Table 5; C3, C6, C7 and C10) in
six (N1C6, N1C7, N2C3, N2C6, N2C7 and N2C10) of the 12
significant combinations between the 33 remaining AlignAce
motifs and the C-elements. N1 and N2 are involved in more
significant combinations than expected on the basis of the
randomization study (Table 6; last column).
If N1 or N2 work with the C-elements (C3, C6, C7 and C10) to
regulate gene expression in response to CN, then genes that
contain both motifs and are in Model 3 CN-enhanced should
be misrepresented in certain functional groups as these genes
are truly co-regulated. This misrepresentation should occur
not only with respect to the genome, but also with respect to
the genes in Model 3 CN-enhanced. This result is expected
because these genes are more closely related to each other
than to the other genes in Model 3 CN-enhanced, and because
their CN regulation is the result of the action of the same
transcription factor(s). Funcat analysis was used to deter-
mine if any functional categories were misrepresented in the
genes whose promoters contain N1C6, N1C7, N2C3, N2C6,
N2C7 or N2C10 and are in Model 3 CN-enhanced. As the
genes used to derive most of the pertinent cis motifs encode
proteins that are localized to mitochondria, we also tested to
see if these genes were misrepresented in the predicted
localization of the proteins they encode with respect to the
Table 6
Potential NDEs
NDEs Element name Ferredoxin C-
elements
Protein synthesis C-elements Total p-value
KMSAGAG (C3) WKGGGCC (C6) GGCCSAW (C7) GDNTTGKAM (C10)
Ferredoxin-related motifs
CHHNAACHRA N1 NS 0.0222 0.0344 NS 0.046
N1C6 N1C7
Protein synthesis related motifs
TNNDNVNACAACA N2 0.0281 0.0207 0.0268 0.0037 <0.005
N2C3 N2C6 N2C7 N2C8
For nucleotide abbreviations see the foonote for Table 5.
Table 7
Misrepresentation of genes that are potentially regulated by a combination of a C-element and N1 or N2
Gene set Protein synthesis funcat Genes predicted to be localized to the mitochondria
InterAct Class genes (3,652) 370 393
Model 3 CN enhanced (127) 32 +S 21
N1C6 (45) 14 +S 9
N1C7 (49) 15 +S 9
N2C3 (27) 5 4
N2C6 (16) 8 +S 7 +S
N2C7 (17) 9 +S 7 +S
N2C10 (15) 3 4
+S, sub-model over-represented; -S, sub-model under-represented. See text for details.
R91.10 Genome Biology 2004, Volume 5, Issue 11, Article R91 Palenchar et al. />Genome Biology 2004, 5:R91
genes in Model 3 CN-enhanced. For the genes whose promot-
ers contain N1C6, N1C7, N2C3, N2C6, N2C7, or N2C10 and
are in Model 3 CN-enhanced, only the 'protein synthesis' fun-
cat was found to be misrepresented amongst the primary fun-
cats as compared to all the genes in Model 3 CN-enhanced
(Table 7). The genes predicted to encode mitochondria-local-
ized proteins are over-represented for some combinations,
but genes localized to the cytoplasm or chloroplast are never
misrepresented (Table 7). Two combinations (N2C3 and
N2C8) do not show over-representation in protein synthesis
and/or genes encoding mitochondria-localized proteins, sug-
gesting they are false positives. All the others show over-rep-
resentation in some category, further suggesting the potential
biological relevance of these cis elements (Table 7).
Discussion
This report contains the one of the first genome-wide investi-
gations of carbon- and nitrogen-signaling interactions in A.
thaliana [31]. While the focus of our analysis is related to
genes controlled by carbon and nitrogen interactions, infor-
mation from this study can also be used to globally identify
genes and processes responsive to regulation by carbon or
nitrogen alone. This type of analysis reveals that carbon is a
more ubiquitous regulator of the genome compared to nitro-
gen. The most obvious manifestation of this is the number of
genes assigned an InterAct class that are regulated by C-only
(1,310) versus N-only (4) (Table 1). This result is not
surprising, because carbon plays a major part in many biolog-
ical processes and is therefore a major regulator of those
processes. However, our studies show that nitrogen has a sig-
nificant role in modifying the effect of carbon on gene expres-
sion. In particular, it is noteworthy that many genes show a
response to CN (208 genes) treatment that is different from
plants treated with carbon alone (Table 1 and Additional data
file 1). This analysis demonstrates that nitrogen does have an
effect on gene expression, but that in the vast majority of
cases, the nitrogen effect is largely carbon-dependent. The
carbon dependence of nitrogen regulation may reflect the
metabolic interdependence of carbon and nitrogen. For
example, carbon skeletons are required on which to assimi-
late nitrogen into amino acids.
Biological processes containing genes that respond signifi-
cantly to carbon, nitrogen and/or CN were initially identified
by finding MIPS funcats [21,22] that contained genes that
were under-represented in InterAct class 0000 (the No effect
model) (Table 2). Funcats under-represented in the No effect
model have a significant number of genes regulated by carbon
and/or nitrogen. It is not surprising that processes like
metabolism, protein synthesis, and energy are under-repre-
sented in the No effect model. These processes control metab-
olism or require energy generated by metabolism, and
therefore expression of genes involved in these processes are
likely to change in response to changes in levels of carbon,
nitrogen and/or CN caused by external feeding or depletion
after starvation. Protein synthesis regulation might be
because it is a downstream process responding to an increase
of amino acids as a result of feeding carbon, nitrogen and/or
CN.
To gain a better understanding of how the metabolism,
energy and protein synthesis funcats are regulated by carbon
and/or nitrogen, the sub-models in which they are misrepre-
sented were identified (Table 3). This analysis revealed that
the energy funcat is over-represented in InterAct classes that
correspond to repression by carbon. It has been shown that
carbon sources repress the expression of genes involved in
photosynthesis [32]. As photosynthesis genes are part of the
energy funcat, the photosynthesis sub-funcat (02.40) was
tested and found to be over-represented in the C-only repres-
sive model, in agreement with the previously observed
repression of photosynthesis genes by carbon [32].
Surprisingly, metabolism is over-represented in Model 3 CN-
suppressed, indicating that many of the genes involved in
metabolism show less expression due to CN than expected.
The majority of the genes (28 out of 34) were repressed by
carbon, induced by nitrogen and repressed by CN, and were
assigned to InterAct classes such as -21-2-1 (see Additional
data file 1). Several of these genes encode enzymes involved in
the catabolism of complex carbohydrates, including β-fructo-
furanosidase (At1g12240), β-amylase (At3g23920) and β-glu-
cosidase (At3g60130 and At3g60140). ASN1 (At3g47340),
which has been proposed to be involved in producing aspar-
agine for the transport of nitrogen when carbon levels are low
and has been shown to be repressed by carbon [32], was
assigned Model 3 CN-suppressed (-21-2-1). In addition,
GDH1 (At5g18170), which has been proposed to be involved
in ammonia assimilation when ammonia levels are high, is
repressed by carbon, and induced by nitrogen [33], and was
assigned InterAct class -21-2-1, again a Model 3 CN-sup-
pressed class. These genes therefore seem to be regulated as a
result of decreased levels of carbon, increased levels of nitro-
gen or an imbalance between carbon and nitrogen. For exam-
ple, when carbon sources are limiting (nitrogen is in excess),
ASN1 is induced because it is involved in shifting the excess
nitrogen to asparagine, as asparagine is an efficient way to
store and transport nitrogen with respect to carbon [34].
However, when carbon is in excess or carbon and nitrogen are
balanced, ASN1 is repressed. The regulation of these genes
demonstrates the exquisite control of metabolic genes
required to balance carbon and nitrogen availability.
Our studies also showed that protein synthesis is one of the
processes most affected by the interactions between carbon
and nitrogen signaling (Table 3). In addition, the funcat enti-
tled 'protein with binding function or cofactor requirement'
(structural or catalytic) is also over-represented in Model 3
CN-enhanced (see Additional data file 1), partly due to genes
that encode proteins involved in translation, including
At4g10450 (putative ribosomal protein L9 cytosolic; InterAct
Genome Biology 2004, Volume 5, Issue 11, Article R91 Palenchar et al. R91.11
comment reviews reports refereed researchdeposited research interactions information
Genome Biology 2004, 5:R91
class 2132) and At4g25740 (putative ribosomal protein S10;
InterAct class 1021) (see Additional data file 1). This suggests
that protein synthesis is regulated by carbon (see above), but
also by complex interactions between carbon and nitrogen
signaling.
Little work has been done on the transcriptional control of
protein synthesis by carbon and/or nitrogen signaling in
plants. However, it has been shown in yeast that genes encod-
ing ribosomal proteins are induced by nitrogen in the pres-
ence of carbon; whether this induction by nitrogen requires
carbon to be present was not addressed in the yeast study
[35]. Furthermore, in the fungus Trichoderma hamatum, the
gene for ribosomal protein L36 is regulated by interactions
between carbon and nitrogen, as it is induced only by CN, and
not by carbon or nitrogen alone [36]. Our studies of carbon
and nitrogen regulation of gene expression in plants, com-
bined with the studies in fungi, suggest that transcriptional
regulation of genes involved in protein synthesis by carbon
and nitrogen signaling interactions is evolutionarily
conserved.
Finally, we sought to identify the cis-regulatory mechanisms
involved in carbon and nitrogen signaling interactions. We
hypothesized that there could be two general transcriptional
mechanisms that would result in the expression due to CN
being greater than that due to C+N (Figure 3). In one case, the
regulation due to carbon and the regulation due to CN are
completely independent (Figure 3a), and in the other case,
the regulation due to nitrogen is dependent on a carbon-
responsive transcription factor and cis element (Figure 4b).
Since CN1 and CN2 (Table 5) are over-represented in Model
3 CN-enhanced genes (for example, InterAct class 1021) inde-
pendently of a C-element, we propose that CN1 and CN2
regulate gene expression due to CN that is independent of a C-
element (Figure 3a). This hypothesis is supported because
CN1 and CN2 were found in the ferredoxin-related genes,
which contain no C-elements that are over-represented in
Model 3 CN-enhanced. However, we cannot rule out the pos-
sibility that CN1 and CN2 are promiscuous NDEs (Figure 3b)
that interact with many C-elements, which might result in
over-representation of CN1 and CN2 in Model 3 CN-
enhanced genes, but not in over-representation of a specific
C-element.
Further analysis suggests that CN1 is involved in regulating
the expression of ferredoxin-dependent nitrite reductase.
Finding three copies of CN1 in the promoter of the A. thaliana
ferredoxin-dependent nitrite reductase gene is statistically
unlikely (p-value = 0.0364), and while three copies in the pro-
moter of the O. sativa gene did not reach the 0.05 cutoff, this
might represent some small change in the specificity of the
regulating factor between O. sativa and A. thaliana. The fail-
ure of BLAST to detect any similarity between the promoters
of these two genes suggests that their transcriptional regula-
tors share very little sequence specificity, so a slight change in
specificity is not unexpected. The same analysis suggests that
CN2 is a false positive because it is not over-represented in
the promoters of ferredoxin-dependent nitrite reductase
genes. However, we cannot rule out the possibility that the
combination of CN1 and CN2 is what is important in regulat-
ing these genes, as having a total of four copies of CN1 and
CN2 is unlikely in the promoters of both genes. One possibil-
ity is that there is a positional relationship between the copies
of CN1 and CN2 that is important. From a quick visual inspec-
tion, there does not appear to be a conserved relationship
between the three copies of CN1 and one copy of CN2 in the
A. thaliana and O. sativa promoters. These issues will have to
be resolved by further experimental work; however, these
results do suggest that ferredoxin, ferredoxin reductase and
ferredoxin-dependent nitrite reductase are co-regulated by
carbon and nitrogen due to CN1 and/or CN2. CN1 and/or
CN2 therefore might act to link nitrogen reduction and
energy metabolism.
Our analysis found CN-elements in the promoters of the
ferredoxin-related genes (Table 4a), but not in those of the
nuclear-encoded ribosomal mitochondrial protein genes
(Table 4b). Also none of the C-elements found in the ferre-
doxin-related genes (C1 through C5) is over-represented in
the Model 3 CN-enhanced genes, suggesting that these ele-
ments have no role in CN regulation and that the CN and car-
bon signaling are independent (Table 5). In contrast, most of
the C-elements in the promoters of the ribosomal protein
genes are also over-represented in the promoters of the
Model 3 CN-enhanced genes (C6 through C9), suggesting that
they have a role in carbon and CN regulation. In addition, the
majority of the C-elements (C6, C7 and C10) found to be over-
represented in combination with NDEs (N1 and N2), and the
most statistically significant of these enhancers (N2), was
found in the promoters of the ribosomal proteins (Table 6).
This suggests that the CN transcriptional regulation of genes
for ribosomal proteins is primarily due to NDEs (Figure 3b).
Thus, it is not surprising that many of the genes potentially
regulated by the combination of C-elements and NDEs are
involved in protein synthesis (Table 7). However, the putative
NDEs most probably regulate genes involved in a number of
different biological processes. For example, genes that con-
tain the combination N1C7 and are in Model 3 CN-enhanced
include metabolic genes (for example, At3g25900 (homo-
cysteine S-methyltransferase), At2g30970 (aspartate ami-
notransferase) and At3g52940 (C-14 sterol reductase)),
histone-related proteins (for example, At1g54690 (histone
H2A) and At2g27840 (histone deacetylase-related)), and
putative signaling/regulatory proteins (for example,
At4g39990 (Ras-related GTP-binding protein BG3),
At5g38480 (14-3-3 protein) and At3g18130 (guanine nucle-
otide-binding protein)).
This analysis represents a first step in understanding how
carbon and nitrogen signaling interact to control gene expres-
sion and has identified genes and putative cis elements that
R91.12 Genome Biology 2004, Volume 5, Issue 11, Article R91 Palenchar et al. />Genome Biology 2004, 5:R91
are responsive to carbon and nitrogen signaling interactions.
It is noteworthy that the putative CN-elements and NDEs
represent cis elements that have not been previously identi-
fied and as such may represent novel components of the CN
regulatory circuit. Further study of the identified genes and
cis elements is required to bring about a complete under-
standing of interactions between carbon and nitrogen
signaling.
Materials and methods
Plant growth and treatment for analysis
Arabidopsis thaliana seeds of the Columbia ecotype were
surface-sterilized and plated on designated media and vernal-
ized for 48 h at 8°C. Plants were grown semi-hydroponically
under 16-h-light (70 E/m
2
/sec)/8-h-dark cycles at a constant
temperature of 23°C on basal Murashige and Skoog (MS)
medium (Life Technologies) supplemented with 2 mM KNO
3
,
2 mM NH
4
NO
3
and 30 mM sucrose [37]. Two-week-old seed-
lings were transferred to fresh MS media without nitrogen
(KNO
3
and NH
4
NO
3
) or carbon (sucrose) and dark-adapted
for 48 h. To perform specific metabolic treatments, 25 dark-
adapted seedlings were transferred to fresh MS medium con-
taining 0% or 1% (w/v) sucrose and/or 2 mM KNO
3
and 2 mM
NH
4
NO
3
or no nitrogen, and illuminated with white light for
an additional 8 h (70 E/m
2
/s
1
). Following these transient car-
bon and nitrogen treatments, whole seedlings were
harvested, immediately frozen in liquid nitrogen, and stored
at -80°C before RNA extraction.
RNA isolation and microarray analysis
RNA was isolated from whole seedlings using a phenol extrac-
tion protocol as previously described [38]. Double-stranded
cDNA was synthesized from 8 µg total RNA using a T7-Oligo
(dT) promoter primer and reagents recommended by
Affymetrix. Biotin-labeled cRNA was synthesized using the
Enzo BioArray High Yield RNA Transcript Labeling Kit. The
concentration and quality of cRNA was estimated through an
A260/280 nm reading and running 1:40 of a sample on a 1%
(w/v) agarose gel. cRNA (15 µg) was used for hybridization
(16 h at 42°C) to the Arabidopsis ATH1 Target (Affymetrix).
Washing, staining and scanning were carried out as recom-
mended by the Affymetrix instruction manual. Expression
analysis was performed with the Affymetrix Microarray Suite
software (version 5.0) set at default values with a target inten-
sity set to 150. Three biological replicates for each treatment
were carried out.
Using Affymetrix probes to assign genes to InterAct
classes
Only Affymetrix probes representing genes that were deemed
to be expressed in all treatments and replicates were used for
subsequent analysis by InterAct Class [13,20]. For a gene to
be considered expressed, the absolute call made by Affyme-
trix Microarray Suite 5.0 must be 'present' (P) for each of
three replicates for each of four treatments (12 chips total).
These genes have reliable values assigned to them that can be
used for further analysis, while the proper InterAct Class
assignment of a gene with an A ('absent') call would not be
ensured. It should also be noted that the always P genes are
less noisy than the genes that have an A call (data not shown).
In the InterAct Class analysis, four values were assigned to
each gene on the basis of its response to carbon and/or nitro-
gen. The first three values are the expression due to carbon
(the expression in treatment 2 minus the expression in treat-
ment 1; see Figure 2), the expression due to nitrogen (the
expression in treatment 2 minus the expression in treatment
1; see Figure 2), and the expression due to CN (the expression
in treatment 4 minus the expression in treatment 1; see Fig-
ure 2). The fourth InterAct Class value represents the
expected expression due to C+N, which was calculated by
adding the expression due to carbon to the expression due to
nitrogen. The expression due to carbon, the expression due to
nitrogen, the expression due to CN and the C+N values were
calculated for each replicate and then analyzed with InterAct
Class without binning [20].
Statistical analysis of InterAct Classes and functional
categories
p-values were calculated for the MIPS functional categories
(funcats) [21,22] analysis as described previously [13].
Briefly, the number of genes assigned to the funcat being ana-
lyzed and any InterAct class was used as n; p was the number
of genes assigned to the specific model being analyzed divided
by the number of genes assigned to an InterAct class and fun-
cat; k was the number of genes in the funcat being analyzed
and assigned to the model being analyzed. This analysis, with
the baseline being all the genes assigned an InterAct class,
accounts for any biases that may have been caused by discard-
ing all the absent genes. The one-tailed p-value was consid-
ered when the Poisson approximation of binomial
probabilities was used. For the binomial-ratio and the exact
binomial probability test, the p-value for k or more out of n
was used.
Identification of putative cis-regulatory elements in
promoters of CN-regulated genes
Pathways whose genes are over-represented in Model 3 CN-
enhanced were identified using the informatic tool PathEx-
plore [23] function 13 [24]; the methodology is described in
pages at these websites. Briefly, a binomial test is used, and
the genes assigned an InterAct class were used as the parent
list, n was the number of genes in Model 3 CN-enhanced (the
child list), k was the number of genes in the pathway being
analyzed and in the child list, and p was the number of genes
in the pathway being analyzed and in the parent list divided
by the number of genes in the parent list. We limited our
search to pathways that contained more than two genes in the
Model 3 CN-enhanced list. To identify cis-regulatory ele-
ments involved in regulating genes in Model 3 CN-enhanced
and protein synthesis, we used genes involved in protein syn-
thesis that were assigned Model 3 CN-enhanced, to drive the
Genome Biology 2004, Volume 5, Issue 11, Article R91 Palenchar et al. R91.13
comment reviews reports refereed researchdeposited research interactions information
Genome Biology 2004, 5:R91
cis search: At1g07070 (60S ribosomal protein L35a),
At2g36620 (60S ribosomal protein L24), At5g07090 (ribos-
omal protein S4), and At5g58420 (ribosomal protein S4 like).
The methodology used to identify putative carbon and CN
regulatory elements was carried out as described previously
[11]. RSA tools was used to extract the A. thaliana promoters
for every gene [39,40]; AlignAce was then used to identify
over-represented motifs in the promoters of the genes being
analyzed (AlignAce motifs) [24]. To determine if a motif is
over-represented in the promoters of genes in a particular
sub-model, the sequence extracted from RSA tools and its
reverse complement were searched to determine how many
promoters contained the AlignAce motif and in what copy
number. Then a binomial test was used to determine if the
number promoters that contain the motif in the proper
number of copies are over-represented in a particular sub-
model. For this analysis, the number of genes with the Alig-
nAce motif being analyzed in their promoter is n, p is the
number of genes in the sub-model (for example, Model 3 CN-
enhanced) divided by the total number of genes assigned an
InterAct class, and k is the number of genes whose promoters
contain the AlignAce motif being analyzed (in a specific copy
number) and that is in the particular sub-model being tested.
A p-value was only calculated if k is greater than nine. In each
case, the lowest p-value is given. Cis elements over-repre-
sented in the C-only inductive model are considered to be
putative C-elements, and cis elements that are over-repre-
sented in the promoters of Model 3 CN-enhanced genes and
are not over-represented in the promoters of C-only inductive
genes, are considered to be putative CN-elements (Table 5).
To identify interacting elements, a similar analysis was used.
For example, to identify motifs interacting with a C-element
(Table 5) in regulating induction due to carbon (C-associated
elements), genes whose promoters contain the C-element
were identified. The promoters of these genes were then
checked for a second motif. The number of genes that con-
tained the C-element being analyzed and the second motif
was used as n. The number of genes in the C-only inductive
model that contained the C-element being analyzed divided
by the number of genes assigned an InterAct class and that
contained the C-element being analyzed was used as p. The
number of genes whose promoters contain that C-element
and the second motif being analyzed (in a specified copy
number) and that are in the C-only inductive model was used
as k. In this example, the analysis will determine if the genes
that contain the second motif and the C-element being ana-
lyzed are over-represented in the C-only inductive model
compared to the genes that just contain the C-element. The
same approach was used to identify NDEs as described below.
Further analysis for NDEs
The 33 motifs (13 motifs from ribosomal proteins plus 20
motifs from ferredoxin-related proteins (data not shown))
that are not N-, CN- or C-associated elements were tested to
determine whether they are potential NDEs. They were tested
to see whether genes whose promoters contained these motifs
plus a C-element (Table 5) are over-represented in Model 3
CN-enhanced, as compared to all the genes whose promoters
contain the C-element as described above. If a p-value less
than 0.05 is obtained, the C-element and potential NDE are a
significant combination and are likely to regulate carbon and
nitrogen interactions. As each motif is tested with each of the
11 C-elements, two steps were taken to control for the multi-
ple tests. First, single strands of the promoter sequences of
the A. thaliana genes were randomized 200 times, the reverse
complement of the randomized strand was determined, and
the number of times the 33 remaining AlignAce motifs were
found to be over-represented (p-value < 0.05) with the C-ele-
ments was determined and compared to the number of signif-
icant combinations (p-value < 0.05) between the 33
remaining motifs and the C-elements when the actual pro-
moters were used. In no set of the randomized promoters
were the potential NDEs found to form more significant com-
binations with the 11 C-elements than the actual promoter
sequences (p-value < 1/200 = 0.005). In the second control
step, the number of significant combinations that each of the
33 remaining AlignAce motifs was involved in was deter-
mined and compared to the number of significant combina-
tions found with the 200 sets of randomized promoters. For
one motif, if one random set is significant with as many C-ele-
ments as the real promoters the p-value would be 0.005 (1/
200).
Further analysis of CN1 and CN2
The promoter for At2g15620 was extracted from RSA tools
[39,40]. The reverse complement of the strand from RSA
tools was determined to identify the occurrence of CN1 and
CN2 in either strand of the promoter as described above to
determine over-representation of the AlignAce motifs in the
promoters of the genes in Model 3 CN-enhanced. To deter-
mine whether CN1 and CN2 occur more times than expected
in the promoter, the sequence from RSA tools [39,40] was
randomized 5,000 times and the above procedure was
repeated. The number of times CN1 and/or CN2 were found
in the randomized versions as many or more times than the
actual promoter was determined and used to calculate a p-
value (that is, if 50 random cases do as well as or better than
the actual case p-value = 50/5,000 (0.05))
The sequence database was searched using BLAST [29] for a
gene similar to At2g15620 in the O. sativa sequence. Only one
hit was found. This gene is annotated as a ferredoxin-depend-
ent nitrate reductase [28]. The 1,000 base-pairs upstream of
this gene were taken and 'BLAST align two sequences' was
used to determine whether this sequence is similar to the pro-
moter of At2g15620. BLAST did not find enough similarity to
create an alignment. The sequence was then subjected to the
same test described above for the promoter of At2g15620.
R91.14 Genome Biology 2004, Volume 5, Issue 11, Article R91 Palenchar et al. />Genome Biology 2004, 5:R91
Funcat analysis of the NDEs
Funcat analysis of the genes whose promoters contain spe-
cific cis elements was performed similarly to the approach
described above. Briefly, the number of genes assigned to the
funcat being analyzed and Model 3 CN-enhanced was used as
n; p was the number of genes assigned to Model 3 CN-
enhanced and the funcat being analyzed divided by the
number of genes assigned to Model 3 CN-enhanced and a
funcat; k was the number of genes in the funcat being ana-
lyzed that was assigned to the Model 3 CN-enhanced category
and containing the combination of C- and N-element being
analyzed.
Statistical significance of localization was calculated simi-
larly. The only difference being that instead of genes assigned
a funcat, genes whose protein products are predicted to be
localized in the compartment being analyzed were used. Pre-
dicted protein localizations were extracted from the TAIR
web page [25].
Additional data files
The following additional data are available with the online
version of this paper: Additional data file 1 containing a table
listing the Affymetrix probe ID, gene, and InterAct class for
all the Affymetrix probes assigned an InterAct class;
Additional data file 2 listing the data from 12 Affymetrix
microarray chips used in this study.
Additional data file 1A table listing the Affymetrix probe ID, gene, and InterAct class for all the Affymetrix probes assigned an InterAct classA table listing the Affymetrix probe ID, gene, and InterAct class for all the Affymetrix probes assigned an InterAct classClick here for additional data fileAdditional data file 2The data from 12 Affymetrix microarray chips used in this studyThe data from 12 Affymetrix microarray chips used in this studyClick here for additional data file
Acknowledgements
This work was supported by the National Institutes of Health (grant
number GM32877 to G.M.C) and a National Research Service Reward
(grant number GM65690 to P.M.P).
References
1. Raab TK, Terry N: Nitrogen source regulation of growth and
photosynthesis in Beta vulgaris L. Plant Physiol 1994,
105:1159-1166.
2. Scheible WR, Gonzalex-Fontes A, Lauerer M, Muller-Rober B, Cabo-
che M, Stitt M: Nitrate acts as a signal to induce organic acid
metabolism and repress starch metabolism in tobacco. Plant
Cell 1997, 9:783-798.
3. Sitt M, Muller C, Matt P, Gibon Y, Carillo P, Morcuende R, Scheible
WR, Krapp A: Steps towards an integrated view of nitrogen
metabolism. J Exp Bot 2002, 53:959-970.
4. Coruzzi GM, Zhou L: Carbon and nitrogen sensing and signal-
ing in plants: emerging 'matrix effects'. Curr Opin Plant Biol 2001,
4:247-253.
5. Foyer CH, Parry M, Noctor H: Markers and signals associated
with nitrogen assimilation in higher plants. J Exp Bot 2003,
54:585-593.
6. Lejay L, Tillard P, Lepetit M, Olife F, Filleur S, Daniel-Vedele F, Gojon
A: Molecular and functional regulation of two NO3- uptake
systems by N- and C-status of Arabidopsis plants. Plant J 1999,
18:509-519.
7. Hoff T, Truong HN, Caboche M: The use of mutants and trans-
genic plants to study nitrate assimilation. Plant, Cell Environ
1994, 17:489-506.
8. Wang R, Okamoto M, Xing X, Crawford NM: Microarray analysis
of the nitrate response in Arabidopsis roots and shoots
reveals over 1,000 rapidly responding genes and new link-
ages to glucose, trehalose-6-phosphate, iron, and sulfate
metabolism. Plant Physiol 2003, 132:556-567.
9. Signora L, De Smet I, Foyer CH, Zhang H: ABA plays a central role
in mediating the regulatory effects of nitrate on root branch-
ing in Arabidopsis. Plant J 2001, 28:655-662.
10. Martin T, Oswald O, Graham IA: Arabidopsis seedling growth,
storage lipid mobilization, and photosynthetic gene expres-
sion are regulated by carbon:nitrogen availability. Plant Physiol
2002, 128:472-481.
11. Rolland F, Moore B, Sheen J: Sugar sensing and signaling in
plants. Plant Cell 2002, 14:S185-S205.
12. Thum KE, Shasha DE, Lejay LV, Coruzzi GM: Light- and carbon-
signaling pathways. Modeling circuits of interactions. Plant
Physiol 2003, 132:440-452.
13. Thum KE, Shin MJ, Palenchar PM, Kouranov A, Coruzzi GM:
Genome-wide investigation of light and carbon signaling
interactions in Arabidopsis. Genome Biol 2004, 5:R10.
14. Moore B, Zhou L, Rolland F, Hall Q, Cheng WH, Liu YX, Hwang I,
Jones T, Sheen J: Role of the Arabidopsis glucose sensor HXK1
in nutrient, light, and hormonal signaling. Science 2003,
300:332-336.
15. PlantCARE, a database of plant promoters and their cis-reg-
ulatory elements [:8080/PlantCARE/]
16. Lescot M, Dehais P, Thijs G, Marchal K, Moreau Y, Van de Peer Y,
Rouze P, Rombauts S: PlantCARE, a database of plant cis-acting
regulatory elements and a portal to tools for in silico analysis
of promoter sequences. Nucleic Acids Res 2002, 30:325-327.
17. Matys V, Fricke E, Geffers R, Gößling E, Haubrock M, Hehl R, Hor-
nischer K, Karas D, Kel AE, Kel-Margoulis OV, et al.: TRANSFAC:
transcriptional regulation, from patterns to profiles. Nucleic
Acids Res 2003, 31:374-378.
18. Wang R, Guegler K, LaBrie ST, Crawford NM: Genomic analysis of
a nutrient response in Arabidopsis reveals diverse expression
patterns and novel metabolic and potential regulatory genes
induced by nitrate. Plant Cell 2000, 12:1491-1509.
19. Kang J, Turano FJ: The putative glutamate receptor 1.1
(AtGLR1.1) functions as a regulator of carbon and nitrogen
metabolism in Arabidopsis thaliana. Proc Natl Acad Sci USA 2003,
100:6872-6877.
20. Details on microarray gene expression classification using
InterAct Class [ />plain.html]
21. MAtDB entry page [ />22. Schoof H, Zaccaria P, Gundlach H, Lemcke K, Rudd S, Kolesov G,
Arnold R, Mewes HW, Mayer FX: MIPS Arabidopsis thaliana data-
base (MAtDB): an integrated biological knowledge resource
based on the first complete plant genome. Nucleic Acids Res
2002, 30:91-93.
23. PathExplore homepage [ />24. Pathway stats [ />stats.html]
25. TAIR: bulk protein search [ />bulk/protein/index.jsp]
26. ATLAS: AlignACE homepage []
27. Roth FP, Hughes JD, Estep PW, Church GA: Finding DNA regula-
tory motifs within unaligned noncoding sequences clustered
by whole-genome mRNA quantitation. Nat Biotechnol 1998,
16:939-945.
28. Sasaki T, Matsumoto T, Yamamoto K, Sakata K, Baba T, Katayose Y,
Wu J, Niimura Y, Cheng Z, Nagamura Y, et al.: The genome
sequence and structure of rice chromosome 1. Nature 2002,
420:312-316.
29. Altschul SF, Gish W, Miller W, Myers EW, Lipman DJ: Basic local
alignment search tool. J Mol Biol 1990, 215:403-410.
30. Wu C-Y, Washida H, Onodera Y, Harda K, Takaiwa F: Quantitative
nature of the Prolamin-box, ACGT and AACA motifs in a
rice glutelin gene promoter: minimal cis-element require-
ments for endosperm-specific gene expression. Plant J 2000,
23:415-421.
31. Price J, Laxmi A, St Martin KS, Jang J-C: Global transcription pro-
filing reveals multiple sugar signal transduction mechanisms
in Arabidopsis. Plant Cell 2004, 16:2128-2150.
32. Koch KE: Carbohydrate-modulated gene expression in plants.
Annu Rev Plant Physiol Plant Mol Biol 1996, 47:509-540.
33. Lam HM, Peng SS, Coruzzi GM: Metabolic regulation of the gene
encoding glutamine-dependent asparagine synthetase in
Arabidopsis thaliana. Plant Physiol 1994, 106:1347-1357.
34. Melo-Oliveira R, Oliveira IC, Coruzzi GM: Arabidopsis mutant
analysis and gene regulation define a nonredundant role for
glutamate dehydrogenase in nitrogen assimilation. Proc Natl
Genome Biology 2004, Volume 5, Issue 11, Article R91 Palenchar et al. R91.15
comment reviews reports refereed researchdeposited research interactions information
Genome Biology 2004, 5:R91
Acad Sci USA 1996, 93:4718-4723.
35. Backhus LE, DeRisi J, Brown PO, Bisson LF: Functional genomic
analysis of a commercial wine strain of Saccharomyces cerevi-
siae under differing nitrogen conditions. FEMS Yeast Res 2001,
1:111-125.
36. Fekete C, Posta K, Hornok L: Primary structure and transcrip-
tion patterns of RPL36, a ribosomal protein-encoding gene of
the mycoparasitic fungus, Trichoderma hamatum. Curr Genet
2001, 39:183-189.
37. Oliveira IC, Coruzzi GM: Carbon and amino acids reciprocally
modulate the expression of glutamine synthetase in Arabi-
dopsis. Plant Physiol 1999, 121:301-310.
38. Lobreaux S, Massenet O, Briat JF: Iron induces ferritin synthesis
in maize plantlets. Plant Mol Biol 1992, 19:563-572.
39. Regulatory sequence analysis tools [ />40. van Helden J: Regulatory sequence analysis tools. Nucleic Acids
Res 2003, 31:3593-3596.