Báo cáo y học: "GOToolBox: functional analysis of gene datasets based on Gene Ontology" pptx
Bạn đang xem bản rút gọn của tài liệu. Xem và tải ngay bản đầy đủ của tài liệu tại đây (2.24 MB, 8 trang )
Genome Biology 2004, 5:R101
comment reviews reports deposited research refereed research interactions information
Open Access
2004Martinet al.Volume 5, Issue 12, Article R101
Software
GOToolBox: functional analysis of gene datasets based on Gene
Ontology
David Martin
*
, Christine Brun
*
, Elisabeth Remy
†
, Pierre Mouren
*
,
Denis Thieffry
*
and Bernard Jacq
*
Addresses:
*
Laboratoire de Génétique et Physiologie du Développement, IBDM, CNRS/INSERM/Université de la Méditerranée, Parc
Scientifique de Luminy, case 907, 13288 Marseille, France.
†
Institut de Mathématiques de Luminy, Parc Scientifique de Luminy, 13288
Marseille, France.
Correspondence: David Martin. E-mail:
© 2004 Martin et al; licensee BioMed Central Ltd.
This is an Open Access article distributed under the terms of the Creative Commons Attribution License (
which permits unrestricted use, distribution, and reproduction in any medium, provided the original work is properly cited.
GOToolBox: functional analysis of gene datasets based on Gene Ontology<p>Tools are presented to identify Gene Ontology terms that are over- or under-represented in a dataset, to cluster genes by function and to find genes with similar annotations.</p>
Abstract
We have developed methods and tools based on the Gene Ontology (GO) resource allowing the
identification of statistically over- or under-represented terms in a gene dataset; the clustering of
functionally related genes within a set; and the retrieval of genes sharing annotations with a query gene.
GO annotations can also be constrained to a slim hierarchy or a given level of the ontology. The
source codes are available upon request, and distributed under the GPL license.
Rationale
Since complete genome sequences have become available, the
amount of annotated genes has increased dramatically. These
advances have allowed the systematic comparison of the gene
content of different organisms, leading to the conclusion that
organisms share the majority of their genes with only rela-
tively few species-specific genes. On this basis, one can
develop strategies to infer gene annotations from model spe-
cies to less experimentally tractable organisms. However,
such functional inferences require the definition of species-
independent annotation policies.
In this regard, the Gene Ontology consortium [1] has been
created to develop a unified view of gene functional annota-
tions for different model organisms. Three structured vocab-
ularies (or ontologies) have been proposed, which allow the
description of molecular functions, biological processes and
cellular locations of any gene product, respectively. Whereas
the majority of GO terms are common to several organisms,
some of them are specific to a few organisms only, enabling
the description of some aspects of gene function which are
specific to few lineages only. Within each of these ontologies,
the terms are organized in a hierarchical way, according to
parent-child relationships in a directed acyclic graph (DAG).
This allows a progressive functional description, matching
the current level of experimental characterization of the cor-
responding gene product. The hierarchical organization of
the gene ontology is particularly well adapted to computa-
tional processing and is used for the functional annotations of
gene products of several model organisms such as budding
yeast [2], Drosophila [3], mouse [4], nematode [5] and Ara-
bidopsis [6]. More recently, GO annotations for human genes
have been proposed in the context of the GOA project [7].
In parallel, the recent development of new high-throughput
methods has generated an enormous amount of functional
data and has motivated the development of dedicated analy-
sis tools. For instance, one might wonder whether genes
detected as being coexpressed in a DNA chip experiment are
related in terms of molecular or cellular function. In practical
Published: 26 November 2004
Genome Biology 2004, 5:R101
Received: 13 April 2004
Revised: 31 August 2004
Accepted: 25 October 2004
The electronic version of this article is the complete one and can be
found online at />R101.2 Genome Biology 2004, Volume 5, Issue 12, Article R101 Martin et al. />Genome Biology 2004, 5:R101
terms, we address here the following generic questions. First,
are there statistically over- or under-represented GO terms
associated with a given gene set, compared to the distribution
of these terms among the annotations of the complete
genome? Second, among a particular gene set, are there
closely functionally related gene subsets? And third, are there
genes having GO similarities with a given probe gene?
To formulate such questions properly in a well defined math-
ematical framework, we have developed a set of methods and
tools, collectively called GOToolBox, to process the GO anno-
tations for any model organism for which they are available
(Figure 1).
All the programs are written in PERL and use the CGI and
DBI modules. All the ontology data and the gene-GO terms
associations are taken from the GO consortium website.
These data are structured in a PostGreSQL relational data-
base, which is updated monthly. Statistics are calculated
using the R statistical programming environment. The web
implementation of the GOToolBox is accessible at [8].
Features
In this section, we describe the five main functionalities of the
GOToolBox suite. Two of them (GO-Proxy and GO-Family)
are not encompassed by any other GO-processing tool cur-
rently available (see also 'Comparison of the GOToolBox with
other GO-based analysis programs').
Dataset creation
The first step in analyzing gene datasets consists in retrieving,
for each individual gene of the dataset, all the corresponding
GO terms and their parent terms using the Dataset creation
program. The genomic frequency of each GO term associated
with genes present in the dataset is then calculated. The
resulting information is structured and stored in a data file,
available for download on the GOToolBox server for one
week. This file contains also the counts of terms within a ref-
erence gene dataset (genome or user-defined), and can then
be used as an input for the GO-Stats and GO-Proxy programs
described below.
Ontology options
An optional tool, GO-Diet, allows either the reduction of the
term dataset to a slim GO hierarchy (either one proposed by
the GO consortium or a user-defined one) or the restriction of
the considered terms to a chosen depth of the ontology. It is
also possible to filter terms based on the way these have been
assigned to the gene products (evidence code). This tool is
useful to decrease the number of GO terms associated with a
gene dataset, thereby facilitating the analysis of the results of
programs described below, particularly when the input gene
list and/or the number of associated GO terms is large. Note
that the GO-Diet program can generate a gene-term associa-
tion file in the TLF format, allowing the use of GO terms as
gene labels with the TreeDyn tree drawing program [9]. The
GO-Diet options are proposed in the Dataset-Creation form.
GO term statistics
Frequencies of terms within the dataset are calculated and
compared with reference frequencies (for example with
genomic frequencies or with the frequencies of these terms in
the complete list of genes spotted on an array). This proce-
dure allows the delineation of enrichments or depletions of
specific terms in the dataset. The probability of obtaining by
chance a number k of annotated genes for a given term among
a dataset of size n, knowing that the reference dataset con-
tains m such annotated genes out of N genes, is then calcu-
lated. This test follows the hypergeometric distribution
described in Equation 1:
where the random variable X represents the number of genes
within a given gene subset, annotated with a given GO term.
Implemented in the GO-Stats tool, this formula permits the
automatic ranking of all annotation terms, as well as the eval-
uation of the significance of their occurrences within the data-
set. An illustration of such an approach is given in 'Mining
biological data'. A typical GO-Stats output is presented in Fig-
ure 2.
GO-based gene clustering
The goal of the GO-Proxy tool is to group together function-
ally related genes on the basis of their GO terms. The rationale
sustaining our method is that the more genes have common
GO terms, and the less they have specific associated terms,
the more likely they are to be functionally related. For any two
genes of the gene set, the program calculates an annotation-
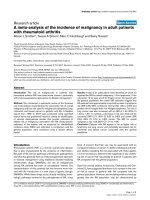
Flowchart of the GOToolBox programsFigure 1
Flowchart of the GOToolBox programs.
Gene name/ID list
Gene name/ID
Associated terms
and parents
Slimmed GO
annotation set
Functionally
related genes
Terms sorted
by relevance
Genes clustered
by function
Dataset
creation
GO-Diet
GO-
Family
GO-Stats
GO-Proxy
User input
Result
Program
P()rX k
m
k
Nm
nk
N
n
=
{}
=
−
−
1
Genome Biology 2004, Volume 5, Issue 12, Article R101 Martin et al. R101.3
comment reviews reports refereed researchdeposited research interactions information
Genome Biology 2004, 5:R101
based distance between genes, taking into account all GO
terms that are common to the pair and terms which are spe-
cific to each gene. Indeed, any two genes can have 0, 1 or sev-
eral shared GO terms (common terms) and a variable number
of terms specific for each gene (specific terms). This distance
is based on the Czekanowski-Dice formula (Equation 2):
In this formula, x and y denote two genes, Terms(x) and
Terms(y) are the lists of their associated GO terms, # stands
for 'number of ' and ∆ for the symmetrical difference between
the two sets. This distance formula emphasizes the impor-
tance of the shared GO terms by giving more weight to simi-
larities than to differences. Consequently, for two genes that
do not share any GO terms, the distance value is 1, the highest
possible value, whereas for two genes sharing exactly the
same set of GO terms, the distance value is 0, the lowest pos-
sible value. All possible binary pairs of genes from the dataset
are considered, resulting in a distance matrix.
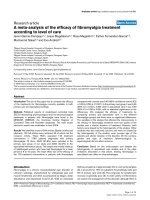
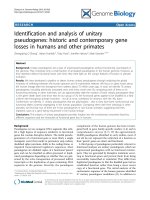
Typical output from the GO-Stats programFigure 2
Typical output from the GO-Stats program. From the input of a group of Drosophila genes, GO-stat returns a series of GO terms associated with them
(columns 1 and 3). The terms are ranked according to a P-value representing their statistical relevance (column 8). The output also lists additional useful
information: column 2 describes the depth at which a given GO term is found in the GO hierarchy (note that some terms can be found at several levels
simultaneously; for example, GO:0009586). Columns 4 and 6 list the numbers of genes annotated for a given term in the reference and the user sets,
respectively. Columns 5 and 7 list the corresponding occurrence frequencies. Finally, the last column indicates whether a given GO term is enriched (E) or
depleted (D), based on the term frequency ratio (column 7/column 5). Note that hyperlinks to GO terms definitions by the GO consortium are provided
(underlined in column 3). In such an output, all GO terms associated with the input genes are listed in the table. To visualize the hierarchy between these
terms, an interactive functional feature is provided with GO-Stats: by clicking on a term (radio button on the left of GO terms list), all its parent terms in
the list are highlighted. Finally, when working in the program, moving the mouse pointer on the GO ID column will make all the genes associated with a
given GO term appear in a box.
Dist x y
Terms x Terms y
[ Terms x Terms y Term
(,)
#( ( ) ( ))
#( ( ) ( )) #(
=
∪+
∆
ssx Termsy ]() ())
()
∩
2
R101.4 Genome Biology 2004, Volume 5, Issue 12, Article R101 Martin et al. />Genome Biology 2004, 5:R101
Next this matrix is processed with a clustering algorithm,
such as the WPGMA algorithm, and a functional classification
tree is drawn, in which the leaves correspond to input genes.
On the basis of this tree, classes can be defined, for instance
by using partition rules, and the statistical relevance of the
terms associated with each class is calculated using the
method described for GO-Stats. The Czekanowski-Dice dis-
tance and the corresponding clustering have already proved
their effectiveness in delineating protein functional classes
derived from the analysis of protein-protein interaction
graphs [10].
Finding GO-related genes
A last tool, GO-Family, aims at finding genes having shared
GO terms with a user-entered gene, on the basis of a func-
tional similarity calculation. It searches the genomes either of
one or several supported species (five at the moment). Given
an input gene name, the program retrieves the associated GO
terms and compares them with those of all other genes by cal-
culating a functional similarity percentage. The program then
returns the list of similar genes, sorted by score. By similar
genes, we mean either genes having more than one common
associated term, or genes which have different associated
terms but one or more common parent terms.
When measuring the similarity percentage S between the
input gene A and another gene G, one can identify terms that
are common to the two genes (Tc), and terms that are specific
to A (Ta) and G (Tg). Three different similarity measures have
been implemented and proposed to the user:
Si = (Tc/(Ta+Tc)) × 100 (3)
Sp = (Tc/(Ta+Tg+Tc)) × 100 (4)
Scd = (1 - ((Ta+Tg)/(Ta+Tg+2Tc))) × 100 (5)
respectively called similarity percentage relative to the input
gene (Si), similarity percentage relative to the pair of genes
(Sp) and Czekanowski-Dice proximity percentage (Scd). The
results are then ranked by decreasing similarity values. A typ-
ical GO-Family output is presented in Figure 3.
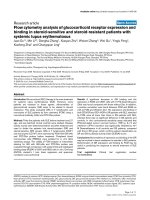
Typical output from the GO-Family programFigure 3
Typical output from the GO-Family program. In this figure, we have asked for all the genes from human, mouse and nematode that share more than 45%
functional similarity with an input gene: the Drosophila gene engrailed. The output is composed of four columns: rank, name of similar gene, percentage of
similarity and species from which the similar gene is issued.
Genome Biology 2004, Volume 5, Issue 12, Article R101 Martin et al. R101.5
comment reviews reports refereed researchdeposited research interactions information
Genome Biology 2004, 5:R101
Mining biological data with the GOToolBox
In this section, we provide two examples showing how combi-
nations of several GO analysis tools can be used to validate or
further delineate gene functional classifications.
Application of GOToolBox to the study of protein-
protein interaction networks
PRODISTIN [10] is a functional classification method for
proteins, based on the analysis of a protein-protein interac-
tion network, that aims to compare and predict a cellular role
for proteins of unknown function. Given a set of proteins and
a list of interactions between them, a distance is calculated
between all possible pairs of proteins. A distance matrix is
then generated, to which the NJ clustering algorithm is
applied. A classification tree is then built, within which func-
tional classes are defined, based on the annotation terms
associated with the proteins involved in known biological
processes. GO-Diet and GO-Stats are useful at two steps of the
analysis (Figure 4a).
The first is to generate the GO annotation set necessary to
define the functional classes of proteins. In this particular
study devoted to the yeast interactome, the term dataset was
fitted to the fourth ontology level using GO-Diet. We chose to
work at this particular level because it was previously shown
to provide a good representation of the complexity of the cel-
lular functions of the proteins described by the biological
process annotations [10]. The second step is to estimate the
relevance of the annotations associated with the resulting
classes using associated GO terms. The GO-Stats program can
be used in this framework, using as reference dataset the list
of proteins given as an input to PRODISTIN (Figure 4b).
As shown in Table 1, the classes issued from PRODISTIN can
be associated to one or to several GO terms. In the latter case,
the calculated annotation biases emphasize the most relevant
terms for the functional assignment of the class (first row in
Table 1), allowing the ranking of the annotation terms. When
the class is associated with a single GO term (second and third
rows in table 1), GO-Stats estimates the probability of obtain-
ing a class with the same size and functional coherence asso-
ciated by chance with this GO term. For instance, in Table 1,
the term 'RNA metabolism' is clearly over-represented in the
second class, whereas this is certainly not true in the case of
the 'cell cycle' class.
Functional clustering of sets of transcriptional factor
targets
GO can also be used to split gene sets into coherent functional
subclasses on the basis of shared annotation terms. As an
illustration, we have analyzed a gene set encompassing puta-
tive targets of the Engrailed transcription factor in Dro-
sophila melanogaster. These genes were identified on the
basis of in vivo UV cross-linking and chromatin immunopre-
cipitation experiments (X-ChIP) [11]. These experiments led
to the cloning and sequencing of several hundreds of DNA
fragments, allowing the computational identification of a well
conserved DNA pattern, which was closely related to the
known engrailed consensus. In order to delineate potential
functional biases among engrailed targets, we have used Go-
Diet and Go-Proxy to cluster the corresponding genes on the
basis of 'Biological Processes' GO annotations.
In the first step, the set of putative target genes has been fed
to the dataset-creation program and slimmed down by cut-
ting the annotations to the fourth level of the Gene Ontology,
using GO-Diet. This eliminates the poorly informative terms.
In a second step, the resulting dataset has been processed
with GO-Proxy, leading to 11 classes as shown in Table 2.
Finally, for each of these classes, the probability of obtaining
it by chance has been calculated, enabling the evaluation of
the significance of the corresponding class relative to the ini-
tial gene dataset. In this analysis, the GOToolBox suite has
proved to be very useful to define different functionally
related sub-groups within a set of genes harbouring different
functions (D.M., F. Maschat and B.J., unpublished work).
Use of the GOToolBox programs in the PRODISTIN frameworkFigure 4
Use of the GOToolBox programs in the PRODISTIN framework. (a)
Flowchart of the programs used in the PRODISTIN pipeline. The 'Dataset
creation' program and GO-Diet are used to generate a slimmed protein
annotation file in a suitable format (tlf). This tlf file can be used as input
both for PRODISTIN and for the tree-visualization program TreeDyn (not
shown in the figure). In a second step, when functional classes have been
generated by PRODISTIN, the GO-Stats tool allows the evaluation of the
relevance of the class annotation term. (b) Histograms showing the
distribution of the relevance values for the 79 classes issued from
PRODISTIN (probability is described in the Features section).
Interacting protein list
PRODISTIN
Dataset
creation
GO-Diet
Functional
classes
GO-Stats
Relevance of
the classes
Slimmed GO
annotation set
40
Distribution of the relevance of the classes
10E-10 > P 10E-5 > P 0.01 > P
P-value of the most relevant term in the class
0.05 > P 0.05 > P
35
Number of classes
30
25
20
15
10
5
0
(a)
(b)
R101.6 Genome Biology 2004, Volume 5, Issue 12, Article R101 Martin et al. />Genome Biology 2004, 5:R101
Comparison of GOToolBox with other GO-
based analysis programs
In this study, we have described the GOToolBox suite, which
performs five main tasks: gene dataset creation, selection and
fitting of ontology level (GO-Diet), statistical analysis of terms
associated with gene sets (GO-Stats), GO-based gene cluster-
ing (GO-Proxy), and gene retrieval based on GO annotation
similarity (GO-Family). Recently, several web-based GO-
processing tools have been developed to display, query or
process GO annotations. In this section, we are interested in
comparing GOToolBox to several GO-processing programs.
As shown in Table 3, comparisons were performed with 12
web-based programs listed on the official GO site [12].
Functionalities unique to the GOToolBox suite
First, it should be highlighted that, to the best of our knowl-
edge, no other program performing all five functions pro-
posed in GOToolBox exists at present. Furthermore, the GO-
Proxy and GO-Family tasks are unique to GOToolBox. These
two functionalities are potentially very useful to the biologist.
Indeed, on the one hand, the GO-Proxy implementation of a
gene-to-gene distance calculation based on several GO terms
allows the determination of classes consisting of functionally
related genes. This feature should prove useful in all cases
where the user wishes to identify functional subgroups within
a list of genes of interest. On the other hand, the ability to
search for genes similar to a user-defined gene on the basis of
related GO terms (GO-Family) is also unique among all GO
processing tools. When used to find functionally similar
genes within a given species, the GO-Family program is often
able to find paralogs as well as other genes with related func-
tions, independently of sequence similarities. Similarly, when
used to find functionally similar genes in other species, the
program can successfully identify genes with related func-
tions, including orthologs. In addition, the GO-Family pro-
gram could be very valuable in the context of genome
annotation: it could be used by database annotators to verify
the coherence of the annotations of genes with known related
Table 1
Examples of class relevance evaluation
Original class annotations Most relevant term
among class
annotations
Associated
probability
Number of
proteins in
the class
Number of class
proteins annotated
for the term
Number of proteins
annotated for the term
in the reference set
Conjugation with cellular fusion; perception of abiotic
stimulus; cell surface receptor linked signal
transduction; sensory perception; response to
pheromone during conjugation with cellular fusion
Conjugation with
cellular fusion
3.85E-09 11 8 32
RNA metabolism RNA metabolism 2.76E-09 32 17 70
Cell cycle.Cell cycle0.0738
3
63115
The second and third columns are the results of the GO-Stats program, whereas all other columns are the results of a PRODISTIN analysis (see text
for details).
Table 2
Classes found by GO-Proxy in a set of transcriptional putative targets and their statistical evaluation
Class-associated term Number of genes in the class Probability
Neurophysiological process 8 5.642e-9
Nucleobase, nucleoside, nucleotide and nucleic acid metabolism 7 2.609e-8
Cell growth and/or maintenance 14 1.011e-7
Protein metabolism 7 0.000001
Organismal movement 5 0.000006
Organogenesis 6 0.000030
Phosphorus metabolism 4 0.000110
Cell adhesion 3 0.000302
Response to external stimulus 3 0.001510
Signal transduction 5 0.002765
Signal transduction 3 0.034355
Genome Biology 2004, Volume 5, Issue 12, Article R101 Martin et al. R101.7
comment reviews reports refereed researchdeposited research interactions information
Genome Biology 2004, 5:R101
functions, which if correctly annotated, would indeed be
expected to be detected by the program.
Because of the presence of these two programs in our suite,
we are inclined to think that GOToolBox represents a major
improvement over other GO-based Web tools.
Comparison of statistical analyses performed by all
GO-based Web tools
Numerous programs have been developed to provide statisti-
cal evaluation of the occurrence of GO terms (Table 3). We
compared these programs to GO-Stats at two levels: the sta-
tistics used to calculate the enrichment/depletion of GO
terms, and the availability of different features, such as the
output types and the GO terms filtering utilities to create the
gene dataset.
As shown in Table 3 (column 3), four different approaches to
calculating the probability of having x genes annotated for a
given GO category have been implemented in various dedi-
cated programs: hypergeometric distribution, binomial dis-
tribution, Fisher exact test and Chi-square test.
The two latter are non-parametric tests and are therefore less
powerful than P-value calculations obtained with both the
hypergeometric and the binomial distributions. In particular,
the Chi-square test seems to be the less efficient, because it
only gives valid results for large gene datasets, and it does not
distinguish between over and under-represented terms [13].
The binomial distribution permits us to calculate the proba-
bility of obtaining x genes annotated for a given GO category
when randomly picking k times one gene among N genes,
leaving the possibility that one gene can be picked many
times, which is not the correct situation in our case. It is
important to note that when N is large, the hypergeometric
distribution tends to give the same results as the binomial dis-
tribution. On average, the hypergeometric distribution seems
to be both the most adapted model and the most powerful sta-
tistical test.
To compare the results obtained with the different methods
for P-value calculation, we have implemented these methods
in the GO-Stats module of GOToolBox, excepted the Chi-
square test for reasons explained above. The implementation
of these tests in GO-Stats permits us to compare the methods
without having to deal with problems due to program-specific
input formats, data update, and supported/unsupported
organism species, as is often the case when using different
programs. In addition, this gives great flexibility to the user,
allowing he or she to use different statistical methods. We
verified that (as might be expected) different programs using
the same statistical methods give the same results. This was
essentially true, with slight variations probably due to the use
of different versions of GO by some programs (data not
shown). Therefore, the comparison between programs
mainly relies on the number of possible statistical tests that
are available. As shown in Table 3, three programs (GOTool-
Box, GFINDer [13] and CLENCH [14]) propose the same
three possible statistical tests, whereas all other programs
have implemented only one method.
Table 3
Summary of the functionalities offered by GOToolBox and other GO processing tools
Program References Statistics Multiple testing correction Output Ontology options
eGOn [18] Fisher exact test - TAB/RANK/TREE ALL/EVID
CLENCH [14] Hypergeometric Binomial Chi Square - TAB/RANK ALL/SLIM
FatiGO [19] Fisher exact test Westfall/Benjamini/Yekutieli TAB/RANK/TREE LEVEL
FuncAssociate [20] Fisher exact test P-value adjustment TAB/RANK ALL
FuncSpec [21] Hypergeometric Bonferroni TAB/RANK ALL
GeneMerge [22] Hypergeometric Bonferroni TAB/RANK ALL
GFINDer [13] Hypergeometric Fisher exact test Binomial - TAB/RANK ALL
GoMiner [15] Fisher exact test - TAB/DAG/TREE ALL
Gostat [23] Fisher exact test Holm/Benjamini/Yekutieli TAB/RANK LEVEL
GO Term-Finder (CPAN) [17] Hypergeometric Bonferroni/Benjamini TAB/RANK/DAG ALL
GO Term-Finder (SGD) [17] Binomial - TAB/RANK/DAG ALL
GOTM [16] Hypergeometric - TAB/TREE/DAG ALL
GOToolBox This paper Hypergeometric Fisher exact test Binomial Bonferroni TAB/RANK ALL/SLIM/ LEVEL/EVID
In the output column, TREE, DAG, RANK and TAB refer respectively to tree-based output, directed acyclic graph visualization, P-value based ranking
of terms, and results organized in a table. In the Ontology options column, terms listed refer to the way a gene set-GO term association can be built:
ALL stands for 'all terms are taken into account (including parent terms)'; SLIM for 'mapping of the terms on a slim ontology'; LEVEL for 'fit the terms
to a given depth of the ontology'; and EVID for 'filter terms according to the type of evidence which indicates how annotation has been associated to
the gene'. See text for more details.
R101.8 Genome Biology 2004, Volume 5, Issue 12, Article R101 Martin et al. />Genome Biology 2004, 5:R101
However, among these three programs, GOToolBox is the
only one in which a multiple testing correction is imple-
mented to adjust P-values and provide a correction for the
occurrence of false positives. We choose the Bonferroni cor-
rection since it appears to be the most stringent in assessing
the significance of enrichment/depletion
Comparison of other features proposed by GO-based
web tools
In addition to the statistical tests used by the different pro-
grams, the presence of functional features offering flexibility
to the end-user can also be considered as a criterion for pro-
gram comparison. Features such as the GO terms filtering
utilities and output types proposed by different programs are
worth comparing (Table 3, last two columns).
The GO terms filtering functions allows one to restrict the
number of GO terms associated with each gene in the dataset,
to facilitate interpretation of the results. Many ways to per-
form this restriction are possible: either mapping the terms
on a slim ontology or fitting the terms to a given level (depth)
of the ontology hierarchy. As shown in Table 3, only GOTool-
Box allows the use of both these filtering methods. They have
been implemented and are accessible under the 'Create Data-
set' form. In addition, in GOToolBox it is possible to restrict
the number of terms associated with each gene, by taking into
account only terms inferred in a particular way (for instance,
terms inferred from direct assay) and to combine the filtering
methods with the slim mapping or the level fitting described
above.
As far as the output types are concerned, several programs
propose a tabulated output file with terms ranked according
to their P-values, (with the exception of GoMiner [15] and
GOTM [16], therefore precluding the interpretation of the
results in these cases). However, a positive attribute of GO
Term Finder [17], GOTM and GoMiner over GOToolBox is
that they propose directed acyclic graph (DAG) graphics for
visualization of results. At the moment, GO-Stats allows the
visualization of relationships between terms in tabulated out-
put only, but a future version of GOToolBox will also incorpo-
rate a DAG graphical output option.
In conclusion, the GOToolBox is a multipurpose, flexible and
evolvable software suite that compares favorably to all exist-
ing GO-based web-analysis programs. Its two unique fea-
tures, GO-Proxy and GO-Family, enable new kinds of
analyses to be carried out, based on the functional annota-
tions of gene datasets These new functionalities are likely to
be very useful to many biologists wanting to extract novel and
meaningful biological information from gene datasets.
Acknowledgements
The authors would like to thank Badih Ghattas for helpful discussions. This
project is supported by two grants from the Action Bioinformatique inter-
EPST, awarded to D.T. and B.J., respectively. D.M. and C.B. are respectively
indebted to the French Ministère de l'Education, de la Recherche et de la
Technologie, and to the Fondation pour la Recherche Médicale for financial
support.
References
1. Ashburner M, Ball CA, Blake JA, Botstein D, Butler H, Cherry JM,
Davis AP, Dolinski K, Dwight SS, Eppig JT, et al.: Gene ontology:
tool for the unification of biology. The Gene Ontology
Consortium. Nat Genet 2000, 25:25-29.
2. Cherry JM, Adler C, Ball C, Chervitz SA, Dwight SS, Hester ET, Jia Y,
Juvik G, Roe T, Schroeder M, et al.: SGD: Saccharomyces
Genome Database. Nucleic Acids Res 1998, 26:73-79.
3. The FlyBase database of the Drosophila Genome Projects
and community literature. The FlyBase Consortium. Nucleic
Acids Res 1999, 27:85-88.
4. Blake JA, Eppig JT, Richardson JE, Davisson MT: The Mouse
Genome Database (MGD): expanding genetic and genomic
resources for the laboratory mouse. The Mouse Genome
Database Group. Nucleic Acids Res 2000, 28:108-111.
5. Stein L, Sternberg P, Durbin R, Thierry-Mieg J, Spieth J: WormBase:
network access to the genome and biology of Caenorhabditis
elegans. Nucleic Acids Res 2001, 29:82-86.
6. Huala E, Dickerman AW, Garcia-Hernandez M, Weems D, Reiser L,
LaFond F, Hanley D, Kiphart D, Zhuang M, Huang W, et al.: The Ara-
bidopsis Information Resource (TAIR): a comprehensive
database and web-based information retrieval, analysis, and
visualization system for a model plant. Nucleic Acids Res 2001,
29:102-105.
7. Camon E, Barrell D, Lee V, Dimmer E, Apweiler R: The Gene
Ontology Annotation (GOA) Database - an integrated
resource of GO annotations to the UniProt Knowledgebase.
In Silico Biol 2004, 4:5-6.
8. GOToolBox [ />9. TreeDyn, a dynamic graphics editor for exploring phyloge-
netic or classification trees [ />10. Brun C, Chevenet F, Martin D, Wojcik J, Guenoche A, Jacq B: Func-
tional classification of proteins for the prediction of cellular
function from a protein-protein interaction network. Genome
Biol 2003, 5:R6.
11. Solano PJ, Mugat B, Martin D, Girard F, Huibant JM, Ferraz C, Jacq B,
Demaille J, Maschat F: Genome-wide identification of in vivo
Drosophila Engrailed-binding DNA fragments and related
target genes. Development 2003, 130:1243-1254.
12. GO Tools [ />13. Masseroli M, Martucci D, Pinciroli F: GFINDer: Genome Function
Integrated Discoverer through dynamic annotation, statisti-
cal analysis, and mining. Nucleic Acids Res 2004, 32:W293-W300.
14. CLENCH [ />Clench]
15. Zeeberg B, Feng W, Wang G, Wang M, Fojo A, Sunshine M, Narasim-
han S, Kane D, Reinhold W, Lababidi S, et al.: GoMiner: a resource
for biological interpretation of genomic and proteomic data.
Genome Biol 2003, 4:R28.
16. Zhang B, Schmoyer D, Kirov S, Snoddy J: GOTree Machine
(GOTM): a web-based platform for interpreting sets of inter-
esting genes using Gene Ontology hierarchies. BMC
Bioinformatics 2004, 5:16.
17. GO Term finder [ />GO/goTermFinder]
18. eGOn [ />19. Al-Shahrour F, Diaz-Uriarte R, Dopazo J: FatiGO: a web tool for
finding significant associations of Gene Ontology terms with
groups of genes. Bioinformatics 2004, 20:578-580.
20. FuncAssociate [ />ate]
21. Robinson M, Grigull J, Mohammad N, Hughes T: FunSpec: a web-
based cluster interpreter for yeast. BMC Bioinformatics 2002,
3:35.
22. Castillo-Davis CI, Hartl DL: GeneMerge - post-genomic analysis,
data mining, and hypothesis testing. Bioinformatics 2003,
19:891-892.
23. Beissbarth T, Speed TP: GOstat: find statistically overrepre-
sented Gene Ontologies within a group of genes. Bioinformatics
2004, 20:1464-1465.