Báo cáo y học: "Global expression changes resulting from loss of telomeric DNA in fission yeast" pps
Bạn đang xem bản rút gọn của tài liệu. Xem và tải ngay bản đầy đủ của tài liệu tại đây (957.39 KB, 15 trang )
Genome Biology 2004, 6:R1
comment reviews reports deposited research refereed research interactions information
Open Access
2004Mandellet al.Volume 6, Issue 1, Article R1
Research
Global expression changes resulting from loss of telomeric DNA in
fission yeast
Jeffrey G Mandell
*
, Jürg Bähler
†
, Thomas A Volpe
‡
, Robert A Martienssen
‡
and Thomas R Cech
*
Addresses:
*
Department of Chemistry and Biochemistry and Howard Hughes Medical Institute, University of Colorado, Boulder, CO 80309-
0215, USA.
†
The Wellcome Trust Sanger Institute, Cambridge, CB10 1SA, UK.
‡
Cold Spring Harbor Laboratory, Cold Spring Harbor, NY 11724,
USA.
Correspondence: Thomas R Cech. E-mail:
© 2004 Mandell et al.; licensee BioMed Central Ltd.
This is an Open Access article distributed under the terms of the Creative Commons Attribution License (
which permits unrestricted use, distribution, and reproduction in any medium, provided the original work is properly cited.
Profiling yeast telomere shortening<p>Gene expression profiling of the response to <it>Schizosaccharomyces pombe </it>cells to loss of the catalytic subunit of telomerase (<it>trt1</it><sup>+</sup>) identified two waves of altered gene expression and a continued up-regulation of Core Environmental stress Response (CESR) genes.</p>
Abstract
Background: Schizosaccharomyces pombe cells lacking the catalytic subunit of telomerase
(encoded by trt1
+
) lose telomeric DNA and enter crisis, but rare survivors arise with either circular
or linear chromosomes. Survivors with linear chromosomes have normal growth rates and
morphology, but those with circular chromosomes have growth defects and are enlarged. We
report the global gene-expression response of S. pombe to loss of trt1
+
.
Results: Survivors with linear chromosomes had expression profiles similar to cells with native
telomeres, whereas survivors with circular chromosomes showed continued upregulation of core
environmental stress response (CESR) genes. In addition, survivors with circular chromosomes had
altered expression of 51 genes compared to survivors with linear chromosomes, providing an
expression signature. S. pombe progressing through crisis displayed two waves of altered gene
expression. One coincided with crisis and consisted of around 110 genes, 44% of which overlapped
with the CESR. The second was synchronized with the emergence of survivors and consisted of a
single class of open reading frames (ORFs) with homology both to RecQ helicases and to dh repeats
at centromeres targeted for heterochromatin formation via an RNA interference (RNAi)
mechanism. Accumulation of transcript from the ORF was found not only in trt1
-
cells, but also in
dcr1
-
and ago1
-
RNAi mutants, suggesting that RNAi may control its expression.
Conclusions: These results demonstrate a correlation between a state of cellular stress, short
telomeres and growth defects in cells with circular chromosomes. A putative new RecQ helicase
was expressed as survivors emerged and appears to be transcriptionally regulated by RNAi,
suggesting that this mechanism operates at telomeres.
Background
Telomeres are the nucleoprotein ends of linear eukaryotic
chromosomes. In most organisms, telomeric DNA consists of
a simple, repeated sequence with a G-rich strand running 5' to
3' towards the chromosome end, and terminates with a short,
single-stranded 3' overhang (reviewed in [1,2]). The length of
Published: 15 December 2004
Genome Biology 2004, 6:R1
Received: 29 September 2004
Revised: 16 November 2004
Accepted: 24 November 2004
The electronic version of this article is the complete one and can be
found online at />R1.2 Genome Biology 2004, Volume 6, Issue 1, Article R1 Mandell et al. />Genome Biology 2004, 6:R1
the duplex repeated region varies, from 20 base-pairs (bp) in
hypotrichous ciliated protozoa to around 300 bp in yeast and
several kilobases (kb) in mammalian cells. These DNA
repeats recruit telomeric proteins to form the telosome, a
structure that resists nucleolytic degradation and prevents
chromosome ends from eliciting recombination and end-
joining pathways for repairing double-strand DNA breaks
[3].
Telomeres are also essential for the complete replication of
chromosomes, because conventional DNA polymerases do
not copy the extreme ends of linear DNA molecules. In the
absence of a mechanism to compensate for this 'end-replica-
tion problem', progressive telomere shortening leads to repli-
cative senescence, which in yeast is characterized by
chromosome instability and low cell viability [4,5]. Replica-
tive senescence in mammals is characterized by growth arrest
and altered gene expression [6]. The end-replication problem
is managed in most eukaryotes by the enzyme telomerase,
which adds telomeric DNA sequences to the 3' end of chromo-
somes through the action of its catalytic subunit and RNA
template (reviewed in [7]). DNA polymerase then forms
duplex DNA by synthesizing the complementary C-rich
strand of the telomere [8]. In fission yeast, the catalytic subu-
nit of telomerase is encoded by the gene trt1
+
[9].
In some cases, cells can endure the loss of telomerase and give
rise to a population of survivors. In the budding yeast Saccha-
romyces cerevisiae, survivors maintain long, heterogeneous
telomeres on linear chromosomes using a RAD52-dependent
homologous-recombination pathway [10]. Global gene-
expression profiles of budding yeast lacking telomerase
revealed the induction of a DNA damage response when tel-
omeres were short and a sustained stress response in survi-
vors [11]. Human alternative lengthening of telomeres (ALT)
cells are cancerous cells lacking detectable telomerase activity
that maintain long, heterogeneous telomeres using what is
believed to be a strand invasion mechanism [12,13]. S. pombe
cells without telomerase cease dividing after about 120 gener-
ations, and can give rise to a subpopulation of survivors [14].
Interestingly, these survivors have either circular chromo-
somes or linear chromosomes with long, heterogeneous
amplified telomeres (presumably maintained through recom-
bination) that resemble their budding yeast and human ALT-
cell counterparts. While survivors with circular chromosomes
arise more frequently, those with linear chromosomes grow
faster [14].
Circular chromosomes in S. pombe are believed to form as a
result of the genomic instability due to loss of telomeres,
which normally prevent end-joining and suppress recombi-
nation. Interchromosomal fusions yield unstable dicentric
chromosomes, while intrachromosomal fusions produce cir-
cular chromosomes. S. pombe, with only three chromosomes,
is more likely than other organisms with larger numbers of
chromosomes to successfully form exclusively intrachromo-
somal fusions [14,15]. S. pombe strains with circular chromo-
somes also result after concurrent deletion of rad3
+
and tel1
+
,
two genes with sequence similarity to human ATM (ataxia tel-
angiectasia mutated) [15].
Although S. pombe survivors with linear chromosomes grow
remarkably well and have a morphology similar to wild-type
cells, survivors with circular chromosomes display obvious
growth defects such as slower growth rates and larger sizes
[14]. Survivors with circular chromosomes presumably cope
with impaired DNA segregation, and perhaps DNA breakage
and rearrangement. We hypothesized that cells would show
altered expression of genes necessary for coping with the loss
of telomerase and concomitant changes in chromosome
structure. In this study, we determined the S. pombe global
gene-expression response to loss of trt1
+
to investigate
changes in expression of genes during senescence, and to
compare survivors with circular or linear chromosomes. We
report that survivors with circular chromosomes maintain an
extended stress response not observed in survivors with lin-
ear chromosomes. Furthermore, we present evidence for reg-
ulation of a telomeric gene by the RNAi machinery.
Results
Wild-type reference strains
Wild-type isogenic reference strains WT 3 and WT 5 were
used to determine relative gene-expression changes in trt1
-
samples. Before averaging the expression values from the two
reference strains, the similarity of their expression profiles
was assessed. The dye ratios measured by microarray for each
strain were plotted against each other (Figure 1a). All genes
had expression values that varied less than twofold between
the two samples, indicating that the samples were highly sim-
ilar. The wild-type values used in this paper are thus the aver-
age expression values of strains WT 3 and WT 5.
To learn whether changes in gene expression would result
from subjecting cells to the continuous growth program for 15
days, gene-expression values from strain WT 5 on day 1 of the
growth curve were compared with those of the same strain
harvested on day 15 (Figure 1b). Only three genes
(SPBC354.08c, atp8
+
and cox1
+
) changed their expression
values by more than twofold, and they were only slightly
greater; thus, the vast majority of genes do not have altered
expression as a result of long-term growth in culture, pro-
vided that expression is measured while the cells are in early
log phase (see Materials and methods). These three genes also
had expression changes of more than twofold in one or more
conditions measured for trt1
-
cells, but given their variable
expression in wild-type cells, these changes were most prob-
ably unrelated to the absence of telomerase.
Genome Biology 2004, Volume 6, Issue 1, Article R1 Mandell et al. R1.3
comment reviews reports refereed researchdeposited research interactions information
Genome Biology 2004, 6:R1
Watching cells pass through crisis and characterizing
survivors
Diploid S. pombe cells that were heterozygous for trt1
+
and
able to maintain full-length telomeres were sporulated, and
the resulting trt1
+
and trt1
-
cells propagated through a 15-day
growth curve (Figure 2a). Cells lacking telomerase gave rise to
survivors after day 8 concomitant with heterogeneous ampli-
fied telomeric repeats and telomere-associated sequence
(TAS) (Figures 2b-d), indicative of linear chromosomes [14].
By day 15, the culture was dominated by faster-growing cells
with linear chromosomes. The linear structure of these chro-
mosomes was confirmed by their ability to enter a pulsed-
field gel (Figure 3b, lane g), and the existence of terminal
chromosome fragments C, I, L and M after digestion of chro-
mosomes with NotI (Figure 3a-d, lane e) [14,15]. Cells passing
through crisis (days 7 and 9) also had weak hybridization sig-
nals for the C+M and I+L fragments (Figure 3d, lanes c-d),
suggesting a mix of cells with either linear or circular chromo-
somes, or perhaps cells containing both linear and circular
chromosomes. The inability to detect intact chromosomal
DNA at day 7 (Figure 3b, lane e) may have resulted from the
presence of cells with circularized chromosomes (Figure 3d,
lane c) that do not enter pulsed-field gels.
Strains C1 and C5 had circular chromosomes as evidenced by
lack of telomeric repeats (data not shown), lack of TAS2
sequence (data not shown), the inability of chromosomes to
enter a pulsed-field gel (Figure 3b, lanes b-c), the lack of ter-
minal chromosome fragments C, I, L and M (Figures 3c,d,
lanes g-h) [14,15], and hybridization signals to fragments
C+M and I+L (Figure 3d, lanes g-h).
Two waves of expression are observed in the growth
curve
Two waves of altered gene expression were seen during the
growth curve (Figure 4a), the first with a peak at day 7, con-
sisting of around 110 genes with expression upregulated two-
fold or more, and the second with a peak at day 9, consisting
of three microarray signals that appear to represent a single
ORF (see below) (Figure 4a). The peak of the first wave (day
7) was nearly coincident with crisis in the cell population (day
8) (Figure 2a) and the time when telomeres were shortest
(near day 7) (Figure 2c,d). The second peak of gene expres-
sion at day 9 was coincident with the emergence of survivors
(Figure 2a-d).
The vast majority of expression changes involved upregula-
tion, and only seven genes had downregulated expression of
twofold or greater on two or more days of the growth curve.
Notably, there were three cases of reduction in expression
greater than tenfold: trt1
+
(intentionally knocked out),
SPAC2E1P3.04 (a predicted copper amine oxidase) and
SPAC2E1P3.05c (unknown function). Hybridizations of
genomic DNA to microarrays (data not shown) revealed that
genes SPAC2E1P3.04 and SPAC2E1P3.05c were deleted from
the genome in all strains except WT 3, WT 5 and C1. Interest-
ingly, these two genes are within about 4 kb of transposable
element SPAC167.08 (Tf2-2), suggesting a hotspot for DNA
excision. In no case was gene amplification detected by
genomic hybridization (data not shown), so the observed
increases in expression were most probably due to transcrip-
tional or post-transcriptional regulation, as opposed to
changes in gene copy number.
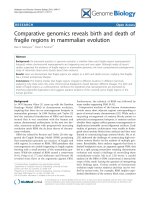
Stability of wild-type strain gene expression profilesFigure 1
Stability of wild-type strain gene expression profiles. (a) Microarray
expression data for two wild-type biological replicates, WT 3 and WT 5,
on day 1 of the growth curve are plotted against each other. The
expression data plotted are the normalized ratio of dyes Cy5- and Cy3-
dCTP representing sample and reference pool, respectively. Lines showing
limits of twofold change are drawn on both sides of the line of identity
(identical values between datasets). The axes are log scale. Every gene for
which there is data is shown (filled circles). All genes fall within the lines of
twofold change. (b) As in (a), except WT 5 from day 1 of the growth
curve is compared with WT 5 from day 15. Only three out of 5,050 genes,
marked with arrows, changed expression by more than twofold. These
genes are SPBC354.08c, encoding a hypothetical protein (2.15-fold); atp8
+
,
F
0
-ATP synthase subunit 8 (2.15-fold); and cox1
+
, cytochrome c oxidase
subunit I (2.98-fold).
A
1
0.1
WT 3 day 1 (Cy5/Cy3 ratio)
2x
1x
2x
0.1 1
WT 5 day 1 (Cy5/Cy3 ratio)
0.1 1
WT 5 day 1 (Cy5/Cy3 ratio)
2x
1x
2x
WT 5 day 15 (Cy5/Cy3 ratio)
1
0.1
(a)
(b)
R1.4 Genome Biology 2004, Volume 6, Issue 1, Article R1 Mandell et al. />Genome Biology 2004, 6:R1
Gene-expression changes in trt1
-
cells
Because a relatively large number of trt1
-
strains were studied,
the identification of genes with consistently altered expres-
sion was facilitated by selecting those genes with expression
changes of twofold or more in two or more days of the growth
curve or, alternatively, in both strains C1 and C5. This crite-
rion was met by 123 genes, of which 54 (44%) overlapped
between the growth curve and survivors with circularized
chromosomes. In addition, of the 67 genes that had their
expression changed twofold or more exclusively in the growth
curve, many displayed altered expression just below the cut-
off in survivors with circularized chromosomes. Two genes -
SPBC1683.06c (a predicted uridine ribohydrolase) and
SPBC1198.01 (a predicted formaldehyde dehydrogenase) -
had expression changes of twofold or more in both strains C1
and C5, but no significant changes during the growth curve.
As a measure of confidence, 84 of the 123 genes (approxi-
mately 68%) met a more stringent criterion requiring a gene
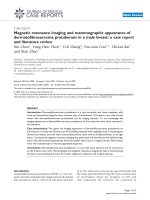
Senescence and emergence of survivors in trt1
-
cellsFigure 2
Senescence and emergence of survivors in trt1
-
cells. (a) Growth curves. YES cultures (200 ml) were inoculated at 2.5 × 10
4
cells/ml with either trt1
+
or
trt1
-
cells. Cell density is shown for trt1
+
cells (open circles) and trt1
-
cells (filled squares) at the end of each 24-h period, after which a new culture was
inoculated at 2.5 × 10
4
cells/ml. When cells were counted on day 1, they had already undergone about 45 generations after germination. Note that when
the culture density reached 3-5 × 10
6
cells/ml, a portion of the cells was harvested for microarray analysis and Southern hybridization. Cells appeared
enlarged near day 8 and were morphologically normal by day 11. (b) Restriction-enzyme sites in the TAS of one chromosome arm cloned into the plasmid
pNSU70 [58]. Locations of the probes used for Southern hybridization are indicated by the bottom bars. These probes hybridize to multiple chromosome
arms because the TASs are found on the four arms of chromosomes I and II and, depending upon the strain background, on one or both arms of
chromosome III. (c) Telomere length in wild-type and trt1
-
strains from the growth curve. DNA (~15 µg) was digested with EcoRI, subjected to
electrophoresis, transferred to a nylon membrane and probed with the
32
P-labeled telomere fragment shown in (b) that was expected to report the state
of the telomere end. As a loading control, a probe for the single-copy gene pol1
+
was included. Signals arising from the telomeres are labeled. (d) As in (c),
but DNA was digested with HindIII and the blot probed with TAS2 and a fragment of pol1
+
. The TAS2 probe was expected to hybridize to sequences at
least 2 kb, and up to 6 kb, from the telomere end.
10
7
10
8
10
6
53179111315
Cells/ml
Day
trt1
−
trt1
+
3 5 2 3 4 5 6 7 8 9 1011121314151
trt1
−
WTMW
Day
3 5 2 3 4 5 6 7 8 9 1011121314151
WT
TAS1 TAS2
TAS3
1 kb
Telomere
ApaI
ApaI
EcoRI
EcoRV
HindIII
NsiI
NsiI
Centromere
pol1
+
pol1
+
Telomeres
Telomeres
Telomeres
kb
10
8
6
5
3
2
1.5
1
10
8
6
5
3
kb
trt1
−
MW
Day
(a) (b)
(c) (d)
Genome Biology 2004, Volume 6, Issue 1, Article R1 Mandell et al. R1.5
comment reviews reports refereed researchdeposited research interactions information
Genome Biology 2004, 6:R1
to change its expression in three or more of the 17 conditions.
Additional confidence that expression changes scored as
significant were not false positives came from the remarkably
continuous manner in which gene expression changed
throughout the growth curve (Figure 4a).
The 123 genes with altered expression encompass a broad
range of functions, but were especially enriched in genes
associated with energy production and carbohydrate metabo-
lism (Table 1). There were seven pseudogenes and 29 pre-
dicted genes that did not have assigned functions at the time
of writing. For nearly all the gene-type categories, there was a
larger number of genes with altered expression in the growth
curve than in the survivors with circular chromosomes (Table
1). This difference may be attributable to the fact that cells in
the growth curve were experiencing crisis whereas strains C1
and C5 were survivors, presumably with established mecha-
nisms to cope with the absence of or the loss of telomeres.
The telomerase-deletion response had a large overlap with
genes that changed expression in response to environmental
stresses. Fission yeast stress-response genes can be separated
into a CESR, in which genes changed expression in all or most
of the stresses studied (oxidative stress, heavy metals, heat
shock, osmotic stress and DNA damage), and into more spe-
cific stress responses [16]. Of the 123 genes with altered
expression in trt1
-
cells, 48 (about 39%) also had upregulated
expression among a conservative list of CESR genes (P ~ 10
-
77
) [16], and two genes had downregulated expression in the
CESR and in this study. Of the 110 genes with expression
upregulated twofold or more on day 7 of the growth curve,
44% overlapped with the CESR. Comparison with a less con-
servative list of CESR genes [16] suggested that 54% of the 123
genes with altered expression in trt1
-
cells had overlap with
the CESR (P ~ 10
-81
). With respect to specific stress responses
[16], there were 17/123 genes in common with the oxidative
stress response (P ~ 10
-32
), and 11/123 genes in common with
the heat stress response (P ~ 10
-24
). The stress response study
found that the DNA damage response and the oxidative stress
response have substantial overlap [16]. Therefore, the genes
with altered expression in this study that overlap with the
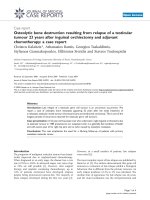
Chromosome structures of trt1
-
survivorsFigure 3
Chromosome structures of trt1
-
survivors. (a) The 13 NotI restriction sites in S. pombe chromosomes I and II [65] are indicated by vertical lines.
Chromosome III does not have a NotI site. Terminal fragments are labeled according to convention and highlighted in black. (b) Pulsed-field gel analysis of
intact chromosomes visualized by staining with ethidium bromide. Lanes d-g correspond to days 1, 7, 9 and 15 of the growth curve, respectively. (c)
Pulsed-field gel of NotI-digested chromosomes visualized with ethidium bromide. Days 1,7, 9 and 15 correspond to days of the growth curve. Lanes a and
f were repositioned from the original gel image. (d) The gels from (c) were transferred to a nylon membrane and probed with a mixture of
32
P-labeled
probes to internal regions of the C, I, L and M fragments, identified in (a). The terminal fragments of linear chromosomes are labeled on the left, and
fragments C+M and I+L resulting from circularized chromosomes are shown on the right.
C
IL
M
d7 d15d9
trt1
−
trt1
−
trt1
−
trt1
−
trt1
−
trt1
+
trt1
+
trt1
+
trt1
+
trt1
+
Day
Ch I
Ch II
Ch III
abcdefg
abcde fgh abcde fgh
C
I
L
M
C1 C5 d1
C+M
I+L
Day
C
I
L
M
C1C517915
17915
C1C5
Ch I (5.7 Mb)
Ch II (4.6 Mb)
Ch III (3.5 Mb)
C+M
I+L
(a) (b)
(c) (d)
R1.6 Genome Biology 2004, Volume 6, Issue 1, Article R1 Mandell et al. />Genome Biology 2004, 6:R1
oxidative-stress response may represent a DNA damage
response to short telomeres.
Chromosome structure and gene expression
Comparisons of all the gene-expression profiles in this study
revealed striking differences between the profiles of survivors
with linear chromosomes versus those with circular chromo-
somes. Survivors with linear chromosomes (days 12-15 of the
growth curve) had gene-expression patterns similar to those
of cells with native telomeres in the first two days of the
growth curve. To illustrate, by day 12 of the growth curve, the
gene-expression profiles of survivors became relatively con-
stant and remained so through day 15. The profiles of days 12-
15 appear most similar to days 1 and 2 of the growth curve,
immediately after cells lost telomerase and were experiencing
shortening telomeres (Figure 4b). This observation was
Gene-expression profiles of cells experiencing senescence and survivorsFigure 4
Gene-expression profiles of cells experiencing senescence and survivors. (a) Graph of expression for all genes showing fold-change relative to wild type
for each day of the growth curve. Each gene is represented as a line with discontinuities resulting from missing data. For clarity, three genes (missing from
the genome, see text) with expression reduced tenfold or more are not shown: trt1
+
, SPAC2E1P3.04 and SPAC2E1P3.05c. (b) Hierarchical clustering of
the 123 genes whose expression changed by twofold or more relative to wild-type in two or more days of the growth curve (see text for details). Samples
d1-d15 are days of the growth curve. Each column represents expression of all 123 genes for a unique condition. Each row represents the expression
pattern of a single gene throughout all conditions. Genes shown in red had upregulated expression and those in green had downregulated expression.
Values of fold-change less than 1.2 are in black, and gray areas indicate missing data. Brackets labeled with letters a-b along the right-hand side denote sets
of genes with similar expression patterns for one or more conditions. Band 'a' consists of genes with downregulated expression: SPAC2E1P3.05c,
SPAC2E1P3.04, trt1
+
and SPBC359.02; and band 'b' represents the second wave of gene expression in the growth curve. The wild-type sample was an
average of biological replicates WT 3 and WT 5. (c) Dendrogram of the experimental conditions and strains shown in (b). Experiments were hierarchically
clustered on the basis of the similarity of expression ratios of the 123 genes shown in (b).
12 345678 9101112131415
1
10
100
Day
Fold-change (log scale)
Repression
>5X fold>5X fold 1:1
Induction
trt1
−
a
b
Genes
WT
d1
d2
d3
d4
d5
d6
d7
C1
d8
d9
d10
d11
d12
d13
d14
d15
C5
WT
d1
d2
d3
d4
d5
d6
d7
C1
d8
d9
d10
d11
d12
d13
d14
d15
C5
(a)
(c)
(b)
Genome Biology 2004, Volume 6, Issue 1, Article R1 Mandell et al. R1.7
comment reviews reports refereed researchdeposited research interactions information
Genome Biology 2004, 6:R1
confirmed by hierarchical clustering (Figure 4c). Conversely,
survivors with circular chromosomes had gene-expression
profiles that most resembled those of cells in crisis during
days 5-8 of the growth curve (Figure 4b,c).
Sustained stress response in survivors with circular
chromosomes
There were 54 genes with clearly altered expression (twofold
or more) mainly during crisis in the growth curve that also
had altered expression in the survivors with circular chromo-
somes (Table 2, Figure 5). The expression of all but three of
these 54 genes was not altered in survivors with linear chro-
mosomes (growth curve days 12-15) (Table 2). Of the 54
genes, 30 (56%) overlapped with the conservative list of
CESR genes (P ~ 10
-46
), and eight genes (15%) overlapped
with the oxidative stress response (P ~ 10
-14
). There were 8/
54 genes (15%) that overlapped with the heat stress response
(P ~ 10
-17
). Because of the extensive overlap of the 54 genes
with the CESR, we conclude that survivors with circular chro-
mosomes had a sustained stress response.
Of the 54 genes, 51 represent a gene-expression signature that
differentiates survivors with circular chromosomes from
those with linear chromosomes. As an independent test of
whether these 51 genes can serve as a signature for cells with
circularized chromosomes, two additional cultures (strains
H1 and H2, see Materials and methods) with circularized
chromosomes were grown and analyzed by microarray. Both
strains clearly displayed altered expression of the 51 genes
whereas survivors with linear chromosomes did not (Figure
5), thus validating this gene signature.
No altered expression of genes encoding
recombination and telomere factors
One feature of microarray studies is that genes not previously
recognized to be under the control of a common regulator can
Table 1
Genes with significantly altered expression in trt1
-
cells
Category Examples GC Circ
Acetyltransferase (2) ppr1
+
, SPBC1271.07c* 2-0 1-0
Alcohol metabolism (2) SPCC24B10.20*, SPAPB24D3.08c* 2-0 0-0
Amino acid and derivative metabolism (6) SPBC119.03*, SPBPB21E7.04c*, SPAC139.05* 5-1 3-1
Carbohydrate metabolism (14) eno102
+
, tms1
+
, fbp1
+
, SPCC663.08c* 13-1 8-0
Cell organization (3) eng1
+
, SPBC8E4.10c*, SPAC11D3.01c* 2-1 0-0
Cofactor metabolism (2) SPAC513.07*, SPAC2E1P3.04*
§
1-1 0-0
DNA maintenance and recombination (3) SPAC212.11*, trt1
+
2-1 0-1
Energy production (5) SPBC23G7.10c*, SPAC513.02*, SPBC1773.06c* 5-0 2-0
Ion homeostasis (2) zym1
+
, SPBC947.05c* 2-0 1-0
Meiosis and sporulation
‡
(5) mfm2
+†
, meu3RC
+
*
†
, meu8
+
*
†
, meu27
+
, SPBC354.08c*
†
4-1 0-0
Methyltransferase (1) SPAC1B3.06c* 1-0 0-0
Mitochondrial energy and proteins (10) cox1
+
, cox3
+
, cob
+
, atp6
+
, atp8
+
, atp9
+
10-0 0-0
Nucleotide metabolism (2) SPBC1683.06c*, SPCC965.14c* 1-0 1-0
Proteolysis (6) isp6
+
, SPBC1685.05*, SPCC338.12* 6-0 1-0
Pseudogene (7) SPBC16E9.16c*, SPBPB21E7.08* 7-0 3-0
RNA binding and regulation (3) SPCC74.09*, SPAC4G8.03c* 3-0 1-0
Non-coding RNA (1) meu3RC 1-0 0-0
Signal transduction (2) hri1
+
, SPBC725.06c* 2-0 1-0
Stress response (8) hsp16
+
, cta1
+
, hsp9
+
, ish1
+
, pyp2
+
8-0 3-0
Sulfur metabolism (2) gst2
+
, SPBC1198.01* 1-0 2-0
Transcription (3) aes1
+
, SPAC30.02c*, SPBC1105.14* 3-0 1-0
Transporter (6) cta3
+
, SPCC1840.12* 5-1 2-0
Unknown function/hypothetical protein (29) SPAC25H1.01c* 29-0 24-0
The total number of genes in each category is indicated in parenthesis. For each category, the number listed before the hyphen is the number of
genes with at least two instances of upregulated expression, and the number after the hyphen is the number of genes with at least two cases of
downregulated expression. GC, growth curve; Circ, strains C1 and C5, where numbers represent changes that occurred in both strains. *Putative
function.
†
Meiosis-associated genes with changed expression in the CESR [16].
‡
This category contains genes that may also appear in other
categories. All other categories are nonredundant.
§
SPAC2E1P3.04 appears to have been deleted from the genome in all strains except WT 3, WT 5
and C1.
R1.8 Genome Biology 2004, Volume 6, Issue 1, Article R1 Mandell et al. />Genome Biology 2004, 6:R1
often be associated by similar expression patterns [17]. On the
basis of this hypothesis, a list of genes known to be involved
in telomere maintenance and recombination was inspected.
However, the expression patterns of all these genes were not
substantially changed throughout the course of the study
(data not shown). Genes investigated included pku70
+
and
lig4
+
, which encode components of the non-homologous end-
joining pathway [18]; taz1
+
[19] and pot1
+
[20] encoding tel-
omere DNA-binding proteins; telomerase component est1
+
[21]; homologous recombination-related genes rad22
+
[22],
rhp54
+
[23], rad32
+
[24] and rhp51
+
[25]; RecQ helicase gene
rqh1
+
[26]; silencing component clr4
+
[27]; and telomere
maintenance components pof3
+
[28] and rad3
+
[15]. Interest-
ingly, even though pof3
+
and clr4
+
expression did not change,
the genes with altered expression in this study had a statisti-
cally significant overlap with the lists of genes with induced
expression in pof3 mutants (P < 10
-45
) [28] and clr4 mutants
(P < 10
-45
) [29]; a significant correlation was also observed
with genes that changed expression in the RNA interference
(RNAi)-machinery mutants dcr1
+
, ago1
+
and rdp1
+
(P ~ 10
-22
)
[29]. These genes with altered expression may act in common
pathways downstream of trt1
+
, clr4
+
, pof3
+
and the RNAi
machinery.
A second wave of expression represents sub-telomeric
ORF with homology to RecQ helicases and dh repeats
The second wave of gene-expression changes during the
growth curve (Figure 4a) consisted of three microarray sig-
nals: SPAC212.11 (largest magnitude), SPAC212.06 (second
largest magnitude) and the reverse transcript of centromeric
dh repeats [30]. Inspection of the sequences revealed that the
microarray signals from SPAC212.06 and centromeric dh
repeats most probably resulted from cross-hybridization with
the SPAC212.11 transcript (see Materials and methods).
Table 2
Maintained expression in strains C1 and C5
Gene name Category Gene name Category
SPBC1271.07c Acetyltransferase* aes1
+
Transcription
SPBPB21E7.04c Amino acid/derivative metabolism* SPCC1840.12 Transporter*
SPBC119.03 Amino acid/derivative metabolism* cta3
+
Transporter
SPAC139.05 Amino acid metabolism* SPBP4G3.03 Unknown/hypothetical
SPBC359.02 Amino acid metabolism* SPBC660.05 Unknown/hypothetical
SPACUNK4.17 Carbohydrate metabolism* SPAC25H1.01c Unknown/hypothetical
SPBC24C6.09c Carbohydrate metabolism* SPAC29A4.12c Unknown/hypothetical
SPAC3G9.11c Carbohydrate metabolism* SPBC19C7.04c Unknown/hypothetical
SPAC4H3.03c Carbohydrate metabolism* SPAC15E1.02c Unknown/hypothetical
SPCC1739.08c Carbohydrate metabolism* SPBC1348.03 Unknown/hypothetical
SPCC663.08c Carbohydrate metabolism* SPAC23C11.06c Unknown/hypothetical
SPAC513.02 Carbohydrate metabolism* SPAC637.03 Unknown/hypothetical
SPCC663.06c Carbohydrate metabolism* SPCC584.16c Unknown/hypothetical
tms1
+
Carbohydrate metabolism SPBC21C3.19 Unknown/hypothetical
trt1
+
DNA maintenance SPBC56F2.06 Unknown/hypothetical
SPAC19G12.09 Energy* SPCC16A11.15c Unknown/hypothetical
zym1
+
Ion homeostasis SPCC338.18 Unknown/hypothetical
SPCC338.12 Protease inhibitor* SPAPB24D3.07c Unknown/hypothetical
SPBC16E9.16c Pseudogene SPCC70.04c Unknown/hypothetical
SPCC18B5.02c Pseudogene SPCC757.03c Unknown/hypothetical
SPBPB21E7.08 Pseudogene SPBC1271.08c Unknown/hypothetical
SPCC70.08c rRNA methyltransferase* SPCC191.01 Unknown/hypothetical
SPBC725.06c Signal transduction* SPAC27D7.10c Unknown/hypothetical
hsp16
+
Stress response SPBC725.10 Unknown/hypothetical
cta1
+
Stress response SPCC737.04 Unknown/hypothetical
gst2
+
Stress (sulfur metabolism) SPAC27D7.09c Unknown/hypothetical
SPAC4H3.08 Stress response (lipid metabolism)* SPBC725.03 Unknown/hypothetical
Fifty-four genes with maintained expression changes twofold or more in both of strains C1 and C5 that also had changed expression of twofold or
more during 2 or more days in the growth curve. All but three genes (trt1
+
, cta3
+
and SPBC359.02) are without changed expression in survivors with
linear chromosomes (days 12-15 of growth curve). *Putative function.
Genome Biology 2004, Volume 6, Issue 1, Article R1 Mandell et al. R1.9
comment reviews reports refereed researchdeposited research interactions information
Genome Biology 2004, 6:R1
A BLAST search of the SPAC212.11 predicted protein
sequence found that the ORF has the most similarity to RecQ
DNA helicases of superfamily II (Figure 6) (reviewed in [31]).
We report a role for the helicase in cells passing through crisis
in a separate study (J.G.M., K.J. Goodrich, J.B. and T.R.C.,
unpublished work) and investigate its transcriptional regula-
tion here.
SPAC212.11 is the last sequenced ORF on the left arm of chro-
mosome I. The sub-telomeric regions of chromosomes I and
II have significant similarity [32]. A BLAST search performed
with the SPAC212.11 DNA sequence (5.6 kb) revealed a para-
log, SPBCPT2R1.08c (6.3 kb), located on the right arm of
chromosome II (the microarray had no probe for
SPBCPT2R1.08c), and partial homology on the right arm of
chromosome I. The annotated sequence of SPBCPT2R1.08c
includes the entirety of the SPAC212.11 sequence with only a
single base change. The SPAC212.11 sequence does not con-
tain a stop codon because the ORF is located at the end of the
sequencing contig, which ended before a stop codon was
reached. Comparison with the annotated SPBCPT2R1.08c
sequence suggests that SPAC212.11 has an additional 95 bp
before the stop codon.
Both SPBCPT2R1.08c and SPAC212.11 are the last predicted
genes on their respective sub-telomeric sequencing contigs.
Analysis of contig pT2R1 revealed that the 3' end of
SPBCPT2R1.08c is approximately 2.8 kb upstream from the
start of TAS3 (Figure 2b). Since TAS3 is around 7 kb from the
chromosome end, the 3' end of SPBCPT2R1.08c is approxi-
mately 10 kb from the telomeric repeats.
It is not known which of the paralogs contributed to the
SPAC212.11 microarray signal. For the sake of simplicity, fur-
ther references in the text to 'the putative helicase' are meant
to include SPAC212.11, SPBCPT2R1.08c and any paralogs,
collectively.
The nucleotide BLAST search performed with the SPAC212.11
sequence also revealed that the ORF contains regions of
homology to dh repeats (Figure 6), which are targeted for het-
erochromatin formation via an RNAi-mediated mechanism
in S. pombe [33,34]. These repeats are typically located at
centromeres and the K region of the mating-type locus
[30,33,35-37].
RNAi machinery implicated in controlling expression
of the putative helicase
Centromeric repeats, previously thought to be transcription-
ally silent, are transcribed in both the forward and reverse
directions, leading to formation of double-stranded RNA
(dsRNA). However, these transcripts do not accumulate in
wild-type cells. Reverse-strand centromeric transcripts are
synthesized and rapidly processed by the RNAi machinery,
while forward-strand synthesis is silenced transcriptionally.
RNA-dependent RNA polymerase (Rdp1) associates with
centromeric repeat DNA and may use siRNAs corresponding
to centromeric transcripts [38] to prime forward transcrip-
tion from reverse-strand templates, thus resulting in dsRNA
formation and maintenance of the heterochromatic state. In
the RNAi mutants dcr1
-
, ago1
-
and rdp1
-
, centromeric silenc-
ing is abolished and accumulation of both forward and
reverse centromeric transcripts is observed [33].
Microarray, northern blot and reverse transcription (RT)-
PCR analysis indicated that the putative helicase gene was
robustly expressed in cells emerging from crisis, but was
weakly (or not at all) expressed in wild-type cells, strains C1
and C5 and survivors with linear chromosomes (Figures 4a,b,
7a, and data not shown). As the putative helicase transcript
was not detectable by northern blot in wild-type cells (data
not shown), we hypothesized that this ORF could be silenced
by its dh repeats, but that this silencing may have been dis-
rupted in trt1
-
cells as a result of genomic instability. Arguing
against this hypothesis, however, Southern analysis with
probe P
5'
(Figure 6), which is specific for the helicase, did not
reveal any DNA rearrangements during crisis close to the hel-
icase that might have contributed to loss of silencing (data not
shown). Nevertheless, the loss of silencing observed might
lead to expression of both strands of the putative helicase, as
was found for centromeric dh repeats in RNAi mutants.
Expression signatures of cells with circular chromosomesFigure 5
Expression signatures of cells with circular chromosomes. For each
condition, the 51 genes from Table 2 that had expression changes of
twofold or more in both strains C1 and C5, but not in survivors with
linear chromosomes, are graphed in clusters of vertical bars. The height of
each bar represents fold-change in expression relative to wild type.
Survivors with linear or circular chromosomes are labeled. Strains H1 and
H2 have circular chromosomes as evidenced by their inability to enter into
a pulsed-field gel (data not shown). Strains H1 and H2 were not used to
derive the expression signature and are shown as an independent
verification of it.
10
0.1
100
Day
Fold-change (log scale)
1
Linear
Circular
WT
d1
d2
d3
d4
d5
d6
d7
C1
d8
d9
d10
d11
d12
d13
d14
d15
C5
H1
H2
R1.10 Genome Biology 2004, Volume 6, Issue 1, Article R1 Mandell et al. />Genome Biology 2004, 6:R1
To test for the presence of both strands, strand-specific RT-
PCR was used with primers spanning the dh repeats of the
putative helicase (region P
dh
in Figure 6). The forward strand
was expressed at levels higher than in wild type in cells from
days 7, 9 and 15 of the growth curve. These results were con-
sistent with microarray analysis that detected the 3' end of the
forward transcript (Figure 7a). The reverse strand was weakly
detectable in cells from days 7 and 9 of the growth curve (Fig-
ure 7a).
dsRNA arising from the repeats presumably could have
formed on days 7 and 9 of the growth curve, but why such
RNA was not all processed by the RNAi machinery is not
clear. On days 7 and 9 of the growth curve, the RNAi machin-
ery was not apparently affected by the mutation of telomerase
as centromeric dh repeat transcripts were not detected by RT-
PCR (Figure 7a).
We next hypothesized that if the RNAi machinery were
involved in transcriptional silencing of the putative helicase
in wild-type cells, transcript should accumulate in mutant
RNAi strains. Strikingly, both ago1
-
and dcr1
-
strains dis-
played significant accumulation of the forward transcript of
the putative helicase, and the rdp1
-
strain showed slightly
increased accumulation with respect to wild-type (Figure 7b).
The reverse strand did not accumulate in these three strains.
Thus, transcriptional silencing of the putative helicase
appeared to be relieved in RNAi mutants, implicating RNAi in
the control of expression of this ORF.
Discussion
Correlation of chromosome structure and gene
expression
The genome-wide survey of expressed genes in this study pro-
vided an opportunity to investigate the cellular response to
loss of the gene for the telomerase catalytic subunit Trt1. A
major finding was the tight correlation between the struc-
tures of chromosomes in survivors and gene expression pro-
files. Survivors with linear chromosomes had expression
profiles remarkably similar to cells with canonical - yet short-
ened - telomeres, whereas cells with circular chromosomes
maintained the upregulated expression of a significant
number of genes that also had upregulated expression during
senescence.
The stress response in survivors with circular chromosomes
had significant overlaps with the S. pombe CESR and with the
heat and oxidative stress responses. The CESR consists of
genes that had upregulated expression in all or most
responses to oxidative stress, heavy metal stress, heat shock,
osmotic stress and DNA damage [16]. The stress response
may persist in survivors with circularized chromosomes
because of impaired DNA segregation and DNA breakage and
rearrangement. Indeed, compared with wild-type cells, survi-
vors with circular chromosomes are larger and have slower
growth rates, indicating that functions related to cell division
are impaired [14].
Telomeric repeats contribute to recruiting the molecular
components collectively involved in the protective capping of
chromosome ends [20,39,40]. These repeats are maintained
in the absence of telomerase in cells from diverse organisms
that normally use telomerase (reviewed in [3]). Interestingly,
the survivors with linear chromosomes abated their stress
response concomitant with the appearance of amplified telo-
meric and TAS repeats as rare survivors took over the popu-
lation, suggesting that the repeats helped to ameliorate the
stress response.
Neither cells in the growth curve that experienced shortened
telomeres nor survivors with long telomeres displayed upreg-
ulation of telomeric gene expression, supporting the notion
that telomeric length changes alone do not affect gene expres-
sion in S. pombe [19]. In addition, in survivors with circular
chromosomes, only eight microarray signals, corresponding
to as few as two genes (due to cross-hybridization) near
former telomeres had altered expression, although such
Homology of the putative helicase with RecQ helicases and dh repeatsFigure 6
Homology of the putative helicase with RecQ helicases and dh repeats. The 5.6 kb sequence of SPAC212.11 is represented as a rectangle. Horizontal lines
above the gene indicate the regions spanned by primers used in this study. P
3'
was the fragment of SPAC212.11 on the microarray (180 bases), and P
5'
was
used in Southern hybridizations (642 bases). Region P
dh
was amplified in RT-PCR experiments (Figure 7) to detect dh repeat forward and reverse strands.
Solid black rectangles are regions of homology with dh repeats found at centromeres and in the K region of the mating-type locus. The predicted amino-
acid sequence of the region marked with cross-hatching has homology with the RecQ helicase family. The BLAST expect (E) value is shown, with the
exception that the approximately 70 bp region of homology to dh repeats 3' of the putative RecQ helicase domain has an E value of 2 × 10
-8
.
500 bp
P
dh
P
5′
P
3′
5′ 3′
dh-repeat homology (E < 1 x 10
−42
)
Putative RecQ helicase domain (E = 5 x 10
−112
)
~10 kb to
chromosome end
Genome Biology 2004, Volume 6, Issue 1, Article R1 Mandell et al. R1.11
comment reviews reports refereed researchdeposited research interactions information
Genome Biology 2004, 6:R1
changes might have been expected as a result of the large
alterations in chromosome structure at these sites.
Comparison with the budding yeast response to loss of
telomerase
As in fission yeast, genes with changed expression in the bud-
ding yeast response to loss of telomerase had significant over-
laps with genes whose expression was altered by
environmental stresses such as heat shock, osmotic shock,
dithiothreitol (DTT), nitrogen starvation and peroxide
([11,41] see also [42]). A difference in the stress responses
between the two yeasts was that in budding yeast a large but
specific subset of the environmental stress-response genes
persisted in survivors with linear chromosomes four days
after crisis, whereas in fission yeast survivors with linear
chromosomes, the stress response mostly abated by the
fourth day after crisis (Figure 4b, day 12). The different yeast
responses may be due to a fission yeast telomere structure
that was not as strongly recognized as aberrant, perhaps mit-
igating a DNA-damage response. It is also possible that had
budding yeast survivors been followed longer, providing a
period for adaptation, the stress response would have
subsided.
In fission yeast, the expression of a number of mitochondrial
ATP synthase genes was upregulated (Table 1) with orthologs
similarly induced in budding yeast. In both cases, the changes
did not overlap with the DNA-damage responses of the
yeasts, further supporting a link between short telomeres and
alterations in the metabolic program suggested by Nautiyal et
al. [11].
Significance of putative RecQ helicase
RecQ helicases have recently been implicated in telomerase-
independent telomere maintenance in both S. cerevisiae and
human ALT cells. BLM and WRN, human RecQ helicases
associated with cancer and disease [31], have both been
shown to associate with duplex telomere repeat binding pro-
tein TRF2 in vivo, and BLM co-localizes to telomeric foci
exclusively in ALT cells [43-45]. The S. cerevisiae ortholog of
human WRN and BLM, Sgs1, was also shown to be required
for telomere elongation of type II survivors in the absence of
telomerase [46-48]. The long, heterogeneous telomeres of S.
pombe survivors with linear chromosomes are similar to
those of S. cerevisiae survivors and human ALT cells, sug-
gesting a role for RecQ helicases in fission yeast telomerase-
independent telomere maintenance.
dh repeats and RNAi at the telomere
This is the first report to our knowledge of naturally occurring
dh repeats outside of the centromeric and mating-type
regions in fission yeast. We have presented several results
that suggest that sub-telomeric dh repeats promote hetero-
chromatin formation at the helicase locus. First, transcript
from this ORF was only weakly expressed in wild-type cells as
determined by RT-PCR (Figure 7a) (and was not detectable at
all by northern hybridization, data not shown), consistent
with transcriptional regulation of this ORF by heterochroma-
tin. Second, expression of the putative helicase was robust in
Expression of dh repeats at the sub-telomereFigure 7
Expression of dh repeats at the sub-telomere. (a) Expression of sub-
telomeric dh repeats in trt1
-
mutants. Strand-specific RT-PCR using
primers spanning the region of dh repeats in the putative helicase (P
dh
in
Figure 6) was used to detect the expression of both forward (For) and
reverse (Rev) transcripts. We define the forward transcript to be
homologous to the DNA strand running towards the chromosome end in
the 5' to 3' direction (this is also the strand with the longest ORF). Strand-
specific control reactions were also performed using primers specific for
centromeric (Cen) dh repeats [33], as well as act1
+
sense and act1
+
antisense transcripts (a control lacking reverse transcriptase is labeled -
RT). Strains WT 5 and days 1, 7, 9 and 15 of the growth curve are shown.
(b) Expression of sub-telomeric dh repeats in RNAi mutants. RNA was
isolated from trt1
+
RNAi mutant strains ago1
-
, dcr1
-
and rdp1
-
[33], and
subjected to strand-specific RT-PCR using the same primers described in
(a). A different wild-type strain from that in (a) was used.
WT
d15
d9
d7
d1
trt1
−
Cen For
Cen Rev
Helicase For
Helicase Rev
act1
+
sense
act1
+
sense-RT
act1
+
antisense
Cen For
Cen Rev
Helicase For
Helicase Rev
act1
+
sense
act1
+
sense-RT
act1
+
antisense
rdp1
−
trt1
+
dcr1
−
trt1
+
ago1
−
trt1
+
WT
(a)
(b)
R1.12 Genome Biology 2004, Volume 6, Issue 1, Article R1 Mandell et al. />Genome Biology 2004, 6:R1
ago1
-
and dcr1
-
mutants, which would be expected if RNAi has
a role in transcriptionally silencing this ORF. In trt1
-
mutants
experiencing genomic instability, we detected both forward
and reverse transcripts of sub-telomeric dh repeats (Figure
7a). The presence of these complementary transcripts sug-
gests the existence of dsRNA that had not been processed by
the RNAi machinery, consistent with a lack of silencing at this
locus. Intriguingly, after maximal expression of both strands
on day 9 of the growth curve, subsequent downregulation was
observed by day 15 (Figure 7a), consistent with restoration of
silencing.
While the finding of homology with dh repeats at the sub-tel-
omere was unexpected, dh repeats have been shown to func-
tion in silencing at sites outside of centromeres and the
mating-type locus. Reporter genes fused to centromeric
repeat fragments as short as 580 bp were silenced when inte-
grated at ectopic locations in the genome [49,50] and this
silencing required the RNAi machinery [51,52]. The longest
(nearly continuous) stretch of sequence with homology to dh
repeats found in the helicase ORF was about 600 bp (Figure
6), presumably long enough to promote heterochromatin for-
mation. In addition, RNAi-mediated silencing triggered by
both a synthetic hairpin RNA and transposon long terminal
repeats have been shown to induce heterochromatin forma-
tion away from centromeres and the mating-type locus [53].
In a separate study, telomeric silencing of a reporter gene and
binding of Swi6 at the telomere were not affected in dcr1
-
,
ago1
-
and rdp1
-
mutants [54]. The lack of an observed effect
may have been due to the ability of telomeric repeats to
recruit silencing factors. Indeed, telomeric heterochromatin
is largely promoted by telomeric repeats. However, the study
by Hall and co-workers [54] did report defective mitotic and
meiotic telomere clustering in RNAi mutants, supporting a
role for RNAi at telomeres.
Given the correlation between disruption of telomeric hetero-
chromatin and expression of the helicase ORF, events other
than telomere erosion that disrupt heterochromatin might
also induce helicase expression.
Materials and methods
Strain construction
The trt1
+
and trt1
-
cells used in this study were generated by
sporulating S. pombe diploid strain G4 (h
-
/h
+
ade6-M210/
ade6-M216 trt1
+
/trt1
-
) on ME plates [18]. The parent diploid
strain was made heterozygous for trt1
+
by using a standard
two-step integration procedure [55] with a linearized plasmid
containing about 1 kb each of the 5' and 3' flanking regions of
the trt1
+
ORF separated by HSV1-tk and KanMX4 [56]. The
plasmid was linearized in the middle of the 3' flanking region
with FseI and transformed using the lithium acetate method
[57] into a diploid strain created by crossing PP68 (h
-
ade6-
M210) and PP69 (h
+
ade6-M216). Cells were re-streaked
twice on yeast extract low adenine (YEA) + geneticin plates
[18] to select for stable genomic integrants, which were sub-
sequently confirmed by Southern hybridization to a uniquely
sized EcoRI restriction fragment 3' of trt1
+
which was present
only in integrants. Cells were then plated on YEA + 50 µM 5-
fluorodeoxyuridine (5-FUdR) plates to select for those that
had excised HSV1-tk, KanMX4 and the XbaI-XhoI fragment
(around 5 kb) of trt1
+
from their genomes. Random surviving
colonies were screened for heterozygous diploids by Southern
hybridization to the 3' region of the trt1
+
KpnI restriction
fragment. The heterozygous state was evidenced by hybridi-
zation signals to both full-length trt1
+
and a shortened, non-
functional version. Loss of markers was confirmed by lack of
a Southern hybridization signal to HSV1-tk, and by lack of
growth on YEA + geneticin plates.
Selection of strains
After germination of G4 and growth of spores at 32°C for
three days on YEA plates [18], plates were stored at 4°C while
the genotypes of random colonies were determined. A portion
of single colonies was used for crossing and visual inspection
to identify those that had an h
-
ade6-M210 genotype, which
were further screened by Southern hybridization for the pres-
ence or absence of trt1
+
(performed as described in 'Strain
construction' below). Colonies were subsequently used as
described in 'Growth curve', or alternatively used to create
strains C1, C5, H1 and H2.
Strains C1, C5, H1 and H2 were created from four separate
trt1
-
colonies that were each successively re-streaked on YEA
plates 15 times (with growth for 2 to 3 days at 32°C between
re-streaks), to permit colonies to form without competition
from faster-growing survivors with linear chromosomes.
During this time cells were presumed to senesce and give rise
to survivors. After the last re-streak, a single colony from each
strain was randomly selected and used to prepare freeze
stocks.
Growth curve
Three strains were grown: two wild-type isolates (h
-
ade6-
M210 trt1
+
) designated WT 3 and WT 5, and a single mutant
isolate (h
-
ade6-M210 trt1
-
) designated as 'GC Day X', where
X represents the day of the growth curve that cells were col-
lected. Single colonies were used to inoculate 5-ml starter cul-
tures in yeast extract full supplements (YES) medium [18]
and grown for 24 h with shaking at 32°C. Cells were counted
and used to inoculate 200-ml YES cultures in 500-ml Erlen-
meyer flasks at 2.5 × 10
4
cells/ml, and were grown in an incu-
bator (Innova 4430, New Brunswick Scientific) with
continuous shaking at 200 rpm at 32°C. Cell density was
monitored by periodic counting, and a portion of the cells was
harvested for microarray analysis and Southern hybridization
when the density reached 3-5 × 10
6
cells/ml (early log phase).
Cells harvested at this point were referred to as day 1 of the
growth curve. The unharvested cells were permitted to con-
tinue growing until 24 h from the time of inoculation, at
Genome Biology 2004, Volume 6, Issue 1, Article R1 Mandell et al. R1.13
comment reviews reports refereed researchdeposited research interactions information
Genome Biology 2004, 6:R1
which time cells were counted and used to inoculate a fresh
200-ml YES culture at 2.5 × 10
4
cells/ml, and the process
repeated for 15 days. To harvest cells for microarray analysis,
a volume of culture containing approximately 1.6 × 10
8
cells
was gently centrifuged at room temperature (2,000 rpm for 2
min), the supernatant removed, and the cell pellet snap-fro-
zen in liquid N
2
. For Southern hybridization, approximately 2
× 10
8
cells were collected by centrifugation, washed twice in
H
2
O, and snap-frozen in liquid N
2
. A portion of cells for
pulsed-field gel analysis was also collected in the same man-
ner as for Southern hybridization at the end of each 24 h
period. trt1
-
cells were collected daily, WT 3 and WT 5 on day
1, and WT 5 on day 15.
Growth and collection of strains C1, C5, H1 and H2
Cells were streaked onto YEA plates from freeze stocks, grown
for 3 days at 32°C, and single colonies used to inoculate 5-ml
starter cultures in YES medium. After 24 h, cells were counted
and 200-ml YES cultures were inoculated at 2.5 × 10
4
cells/
ml, and cultures grown with constant shaking at 200 rpm at
32°C. When the cell density reached around 3 × 10
6
cells/ml
(early log phase), cells were collected as described in 'Growth
curve' for microarray analysis, Southern hybridization and
pulsed-field gel electrophoresis. Strains H1 and H2 are trt1
-
isolates with circular chromosomes, as evidenced by pulsed-
field gel electrophoresis (data not shown)
Genomic DNA preparation and Southern
hybridization
DNA from approximately 2 × 10
8
S. pombe cells was prepared
as described [18]. After digestion with either EcoRI or Hin-
dIII, the DNA was subjected to electrophoresis on a 1% agar-
ose gel in 1 × TBE (90 mM Tris, 90 mM borate, 2 mM EDTA
pH 8.3). DNA was denatured by sodium hydroxide treatment
and transferred to a nylon membrane (Hybond-N+ mem-
brane, Amersham) by capillary transfer in 10 × SSC (1.5 M
NaCl, 0.15 M sodium citrate). DNA was immobilized on the
membrane by irradiation with 120 mJ/cm
2
at 254 nm in a
UVStratalinker1800 (Stratagene). For molecular weight
markers, the 1 kb DNA ladder (New England Biolabs) was
labeled by filling in 5' overhangs with [α-
32
P]dATP using DNA
polymerase I Klenow fragment. Probes for pol1
+
, act1
+
, the
putative helicase and the C, I, L and M chromosome frag-
ments were generated by PCR amplification from a genomic
DNA template and were gel purified. Probes were labeled by
random-primed transcription of PCR products with the use of
[α-
32
P]dCTP and High Prime Mix (Boehringer Mannheim).
Probes specific for the telomeric and telomere-associated
sequences were created with the use of gel-purified fragments
of pNSU70 [58].
Pulsed-field gel electrophoresis
Cells (approximately 1 × 10
8
) were collected as described
above. Plug preparation, chromosome digestion and electro-
phoresis were performed exactly as described [18]. DNA was
visualized by staining with ethidium bromide (1 µg/ml) for 30
min. The gel was then irradiated with 120 mJ/cm
2
at 254 nm
in a UVStratalinker1800 to nick the DNA, treated with HCl,
NaOH and neutralization buffer, and processed as described
in 'Southern hybridization'.
RT-PCR
RNA was prepared as for microarray analysis and used for
RT-PCR (OneStep RT-PCR kit, Qiagen). First-strand cDNA
synthesis was performed using primers complementary to
either the forward or reverse strands. Both primers were
present in subsequent cycles of PCR amplification after heat
inactivation of reverse transcriptase at 95°C for 15 min. The
control reaction lacking reverse transcriptase (act1
+
sense, -
RT) was not subjected to first-strand cDNA synthesis, but was
otherwise treated identically.
Probes and PCR primers
The PCR primers used to generate probes C, I, L, and M have
been published previously [14]. The PCR primers spanning
the regions described in Figure 6 were:
P
5'
: 5'-CTTCAAAAACTGCTAGAGATATCGCCGG-3' and
5'-GTACTGGTAGTCCTCTGATGTATGGG-3'
P
3'
: 5'-ATGCCCCGTACGCTTATCTA-3' and 5'-TTTGCCTT-
TCTAGCCCATGA-3'
P
dh
: 5'-CAACACCAATACTGACGATGATG-3' and 5'-GCAAT-
AGAACCAGCGGTTTG-3'
Primers for centromeric dh repeats have been published pre-
viously [33].
RNA preparation and reference pool for microarrays
Whole-cell RNA was isolated from S. pombe cell pellets (~1.6
× 10
8
cells) by hot-phenol extraction and purification with
RNeasy columns (Qiagen) following a published protocol
[59]. Aliquots (10 µg) were made (henceforth referred to as
'sample RNA') and RNA quality was assessed by UV absorb-
ance, by agarose gel electrophoresis to confirm intact rRNA
bands, and by northern hybridization to act1
+
. A reference
pool consisting of RNA from each sample was made, compris-
ing 76% trt1
-
cells and 24% trt1
+
cells. This pool was divided
into 10 µg aliquots (henceforth referred to as 'reference RNA')
and used as the reference RNA in all hybridization experi-
ments reported here.
A single large batch of YES medium was made at the start of
the study and used to culture all cells analyzed by microarrays
to prevent batch-to-batch medium variations that might yield
artifactual microarray results.
R1.14 Genome Biology 2004, Volume 6, Issue 1, Article R1 Mandell et al. />Genome Biology 2004, 6:R1
Microarray cDNA labeling, hybridization and data
acquisition
The procedures performed and the S. pombe microarrays
used have been described previously [59]. Whole-cell RNA
(10 µg) was labeled by directly incorporating either Cy3-dCTP
(reference RNA) or Cy5-dCTP (sample RNA) through reverse
transcription. The resulting cDNA was hybridized onto DNA
microarrays containing spotted PCR products for over 5,269
different genes and genomic elements printed in duplicate on
glass slides representing 99.9% of all known and predicted
fission yeast genes. Microarrays were scanned using a Gene-
Pix 4000B laser scanner (Axon Instruments) and analyzed
with GenePix Pro software. Low-quality signals were filtered
out, and data were normalized using a customized Perl script
(local adjustment of median of ratios to one within running
windows of 1,000 spots).
Data evaluation and gene classification
Normalized data (Cy5/Cy3 ratios) were evaluated using
GeneSpring (Silicon Genetics). All gene-expression values
were normalized to the average of two trt1
+
biological repli-
cates (strains WT 3 and WT 5) collected on day 1 of the growth
curve. Experiments and genes were clustered in GeneSpring
using the Pearson correlation around zero (termed the Stand-
ard correlation in GeneSpring) with a minimum distance of
0.001 and a separation ratio of 1. Gene annotations were
taken from GeneDB at the Wellcome Trust Sanger Institute
[60]. Lists of genes whose expression changed in the fission
yeast stress response [16] were taken from the authors' web-
site [61]. BLAST searches were performed using the NCBI
BLAST server [62].
The density of genes with changed regulation along the chro-
mosome was determined by using a running window of 20
consecutive genes along each chromosome [63]. For each
window, the probability of obtaining the observed results by
chance was calculated using the hypergeometric distribution.
There were two microarray signals - SPAC212.06 (a pseudog-
ene) and the reverse transcript of centromeric dh repeats -
that we believe were due to cross-hybridization with the
SPAC212.11 transcript (or transcripts from identical ORFs,
see text). Cross-hybridization becomes apparent with array
element sequence identities higher than about 70% [59]. The
SPAC212.11 transcript is capable of hybridizing to the entire
SPAC212.06 microarray probe (99% sequence identity), but
the SPAC212.06 transcript does not contain the sequence
required to hybridize to the SPAC212.11 microarray probe.
The SPAC212.11 transcript also has a high degree of homology
with the dh repeat microarray probe sequence (83% sequence
identity), and both the SPAC212.11 and dh repeat transcripts
are expected to be capable of hybridizing to each other's
microarray probes. Significant levels of forward and reverse
centromeric dh repeat transcripts could not be detected using
RT-PCR with RNA from days 1, 7, 9 and 15 of the growth curve
(Figure 7a) (indicating they could not hybridize to the
microarray), although helicase RNA was detected by both RT-
PCR and northern hybridization (Figure 7a and data not
shown).
Twenty-one microarrays were used in this study, represent-
ing two wild-type biological repeats, 15 days of the growth
curve, and four strains with circularized chromosomes. The
complete raw and normalized data sets are available from
ArrayExpress [64] (Accession number: E-MEXP-201).
Acknowledgements
We thank Peter Baumann, Valerie Wood, Juan Mata, Gavin Burns and
Karen Goodrich for helpful discussions and assistance, Christopher Penkett
for his help in making the data public, and Peter Baumann for critically read-
ing the manuscript. J.G.M. was supported by a postdoctoral fellowship from
the Damon Runyon Cancer Research Foundation, DRG 1617. J.B. is funded
by Cancer Research UK. R.A.M. was supported by NIH grant
R01GM067014.
References
1. Tham WH, Zakian VA: Transcriptional silencing at Saccharomy-
ces telomeres: implications for other organisms. Oncogene
2002, 21:512-521.
2. Greider CW: Telomere length regulation. Annu Rev Biochem
1996, 65:337-365.
3. McEachern MJ, Krauskopf A, Blackburn EH: Telomeres and their
control. Annu Rev Genet 2000, 34:331-358.
4. Lundblad V, Szostak JW: A mutant with a defect in telomere
elongation leads to senescence in yeast. Cell 1989, 57:633-643.
5. McEachern MJ, Blackburn EH: Cap-prevented recombination
between terminal telomeric repeat arrays (telomere CPR)
maintains telomeres in Kluyveromyces lactis lacking
telomerase. Genes Dev 1996, 10:1822-1834.
6. Campisi J: The biology of replicative senescence. Eur J Cancer
1997, 33:703-709.
7. Bryan TM, Cech TR: Telomerase and the maintenance of chro-
mosome ends. Curr Opin Cell Biol 1999, 11:318-324.
8. Price CM: Synthesis of the telomeric C-strand. A review. Bio-
chemistry (Mosc) 1997, 62:1216-1223.
9. Nakamura TM, Morin GB, Chapman KB, Weinrich SL, Andrews WH,
Lingner J, Harley CB, Cech TR: Telomerase catalytic subunit
homologs from fission yeast and human. Science 1997,
277:955-959.
10. Lundblad V, Blackburn EH: An alternative pathway for yeast tel-
omere maintenance rescues est1- senescence. Cell 1993,
73:347-360.
11. Nautiyal S, DeRisi JL, Blackburn EH: The genome-wide expres-
sion response to telomerase deletion in Saccharomyces
cerevisiae. Proc Natl Acad Sci USA 2002, 99:9316-9321.
12. Bryan TM, Englezou A, Gupta J, Bacchetti S, Reddel RR: Telomere
elongation in immortal human cells without detectable
telomerase activity. EMBO J 1995, 14:4240-4248.
13. Reddel RR: Alternative lengthening of telomeres, telomerase,
and cancer. Cancer Lett 2003, 194:155-162.
14. Nakamura TM, Cooper JP, Cech TR: Two modes of survival of fis-
sion yeast without telomerase. Science 1998, 282:493-496.
15. Naito T, Matsuura A, Ishikawa F: Circular chromosome forma-
tion in a fission yeast mutant defective in two ATM
homologues. Nat Genet 1998, 20:203-206.
16. Chen D, Toone WM, Mata J, Lyne R, Burns G, Kivinen K, Brazma A,
Jones N, Bähler J: Global transcriptional responses of fission
yeast to environmental stress. Mol Biol Cell 2003, 14:214-229.
17. Staudt LM, Brown PO: Genomic views of the immune system.
Annu Rev Immunol 2000, 18:829-859.
18. Baumann P, Cech TR: Protection of telomeres by the Ku pro-
tein in fission yeast. Mol Biol Cell 2000, 11:3265-3275.
19. Cooper JP, Nimmo ER, Allshire RC, Cech TR: Regulation of tel-
omere length and function by a Myb-domain protein in fis-
sion yeast. Nature 1997, 385:744-747.
20. Baumann P, Cech TR: Pot1, the putative telomere end-binding
Genome Biology 2004, Volume 6, Issue 1, Article R1 Mandell et al. R1.15
comment reviews reports refereed researchdeposited research interactions information
Genome Biology 2004, 6:R1
protein in fission yeast and humans. Science 2001,
292:1171-1175.
21. Beernink HT, Miller K, Deshpande A, Bucher P, Cooper JP: Tel-
omere maintenance in fission yeast requires an est1
ortholog. Curr Biol 2003, 13:575-580.
22. Ostermann K, Lorentz A, Schmidt H: The fission yeast rad22
gene, having a function in mating-type switching and repair
of DNA damages, encodes a protein homolog to RAD52 of
Saccharomyces cerevisiae. Nucleic Acids Res 1993, 21:5940-5944.
23. Muris DF, Vreeken K, Carr AM, Murray JM, Smit C, Lohman PH, Past-
ink A: Isolation of the Schizosaccharomyces pombe RAD54
homologue, rhp54
+
, a gene involved in the repair of radiation
damage and replication fidelity. J Cell Sci 1996, 109:73-81.
24. Wilson S, Warr N, Taylor DL, Watts FZ: The role of Schizosaccha-
romyces pombe Rad32, the Mre11 homologue, and other
DNA damage response proteins in non-homologous end
joining and telomere length maintenance. Nucleic Acids Res
1999, 27:2655-2661.
25. Jang YK, Jin YH, Kim EM, Fabre F, Hong SH, Park SD: Cloning and
sequence analysis of rhp51
+
, a Schizosaccharomyces pombe
homolog of the Saccharomyces cerevisiae RAD51 gene. Gene
1994, 142:207-211.
26. Murray JM, Lindsay HD, Munday CA, Carr AM: Role of Schizosac-
charomyces pombe RecQ homolog, recombination, and
checkpoint genes in UV damage tolerance. Mol Cell Biol 1997,
17:6868-6875.
27. Ekwall K, Ruusala T: Mutations in rik1, clr2, clr3 and clr4 genes
asymmetrically derepress the silent mating-type loci in fis-
sion yeast. Genetics 1994, 136:53-64.
28. Katayama S, Kitamura K, Lehmann A, Nikaido O, Toda T: Fission
yeast F-box protein Pof3 is required for genome integrity
and telomere function. Mol Biol Cell 2002, 13:211-224.
29. Hansen KR, Burns G, Mata J, Volpe TA, Martienssen RA, Bähler J,
Thon G: Global effects on gene expression in fission yeast
silencing and RNAi mutants. Mol Cell Biol 2004 in press.
30. Nakaseko Y, Kinoshita N, Yanagida M: A novel sequence common
to the centromere regions of Schizosaccharomyces pombe
chromosomes. Nucleic Acids Res 1987, 15:4705-4715.
31. Bachrati CZ, Hickson ID: RecQ helicases: suppressors of tumor-
igenesis and premature aging. Biochem J 2003, 374:577-606.
32. Wood V, Gwilliam R, Rajandream MA, Lyne M, Lyne R, Stewart A,
Sgouros J, Peat N, Hayles J, Baker S, et al.: The genome sequence
of Schizosaccharomyces pombe. Nature 2002, 415:871-880.
33. Volpe TA, Kidner C, Hall IM, Teng G, Grewal SI, Martienssen RA:
Regulation of heterochromatic silencing and histone H3
lysine-9 methylation by RNAi. Science 2002, 297:1833-1837.
34. Martienssen RA: Maintenance of heterochromatin by RNA
interference of tandem repeats. Nat Genet 2003, 35:213-214.
35. Chikashige Y, Kinoshita N, Nakaseko Y, Matsumoto T, Murakami S,
Niwa O, Yanagida M: Composite motifs and repeat symmetry
in S. pombe centromeres: direct analysis by integration of
Not I restriction sites. Cell 1989, 57:739-751.
36. Grewal SI, Klar AJ: A recombinationally repressed region
between mat2 and mat3 loci shares homology to centro-
meric repeats and regulates directionality of mating-type
switching in fission yeast. Genetics 1997, 146:1221-1238.
37. Grewal SI, Elgin SC: Heterochromatin: new possibilities for the
inheritance of structure. Curr Opin Genet Dev 2002, 12:178-187.
38. Reinhart BJ, Bartel DP: Small RNAs correspond to centromere
heterochromatic repeats. Science 2002, 297:1831.
39. Gottschling DE, Aparicio OM, Billington BL, Zakian VA: Position
effect at S. cerevisiae telomeres: reversible repression of pol
II transcription. Cell 1990, 63:751-762.
40. Kanoh J, Ishikawa F: SpRap1 and spRif1, recruited to telomeres
by Taz1, are essential for telomere function in fission yeast.
Curr Biol 2001, 11:1624-1630.
41. Gasch AP, Spellman PT, Kao CM, Carmel-Harel O, Eisen MB, Storz
G, Botstein D, Brown PO: Genomic expression programs in the
response of yeast cells to environmental changes. Mol Biol Cell
2000, 11:4241-4257.
42. Teng SC, Epstein C, Tsai YL, Cheng HW, Chen HL, Lin JJ: Induction
of global stress response in Saccharomyces cerevisiae cells
lacking telomerase. Biochem Biophys Res Commun 2002,
291:714-721.
43. Opresko PL, von Kobbe C, Laine JP, Harrigan J, Hickson ID, Bohr VA:
Telomere-binding protein TRF2 binds to and stimulates the
Werner and Bloom syndrome helicases. J Biol Chem 2002,
277:41110-41119.
44. Stavropoulos DJ, Bradshaw PS, Li X, Pasic I, Truong K, Ikura M,
Ungrin M, Meyn MS: The Bloom syndrome helicase BLM inter-
acts with TRF2 in ALT cells and promotes telomeric DNA
synthesis. Hum Mol Genet 2002, 11:3135-3144.
45. Chan SW, Blackburn EH: New ways not to make ends meet: tel-
omerase, DNA damage proteins and heterochromatin. Onco-
gene 2002, 21:553-563.
46. Huang P, Pryde FE, Lester D, Maddison RL, Borts RH, Hickson ID,
Louis EJ: SGS1 is required for telomere elongation in the
absence of telomerase. Curr Biol 2001, 11:125-129.
47. Cohen H, Sinclair DA: Recombination-mediated lengthening of
terminal telomeric repeats requires the Sgs1 DNA helicase.
Proc Natl Acad Sci USA 2001, 98:3174-3179.
48. Johnson FB, Marciniak RA, McVey M, Stewart SA, Hahn WC,
Guarente L: The Saccharomyces cerevisiae WRN homolog
Sgs1p participates in telomere maintenance in cells lacking
telomerase. EMBO J 2001, 20:905-913.
49. Ayoub N, Goldshmidt I, Lyakhovetsky R, Cohen A: A fission yeast
repression element cooperates with centromere-like
sequences and defines a mat silent domain boundary. Genetics
2000, 156:983-994.
50. Partridge JF, Scott KS, Bannister AJ, Kouzarides T, Allshire RC: Cis-
acting DNA from fission yeast centromeres mediates his-
tone H3 methylation and recruitment of silencing factors
and cohesin to an ectopic site. Curr Biol 2002, 12:1652-1660.
51. Hall IM, Shankaranarayana GD, Noma K, Ayoub N, Cohen A, Grewal
SI: Establishment and maintenance of a heterochromatin
domain. Science 2002, 297:2232-2237.
52. Volpe T, Schramke V, Hamilton GL, White SA, Teng G, Martienssen
RA, Allshire RC: RNA interference is required for normal cen-
tromere function in fission yeast. Chromosome Res 2003,
11:137-146.
53. Schramke V, Allshire R: Hairpin RNAs and retrotransposon
LTRs effect RNAi and chromatin-based gene silencing. Sci-
ence 2003, 301:1069-1074.
54. Hall IM, Noma K, Grewal SI: RNA interference machinery regu-
lates chromosome dynamics during mitosis and meiosis in
fission yeast. Proc Natl Acad Sci USA 2003, 100:193-198.
55. Scherer S, Davis RW: Replacement of chromosome segments
with altered DNA sequences constructed in vitro. Proc Natl
Acad Sci USA 1979, 76:4951-4955.
56. Wach A, Brachat A, Pohlmann R, Philippsen P: New heterologous
modules for classical or PCR-based gene disruptions in Sac-
charomyces cerevisiae. Yeast 1994, 10:1793-1808.
57. Alfa C, Fantes P, Hyams J, McLeod M, Warbrick E: Experiments with
Fission Yeast Cold Spring Harbor: Cold Spring Harbor Laboratory;
1993.
58. Sugawara N: DNA sequences at the telomeres of the fission
yeast S. pombe. In Ph D Thesis Harvard University; 1988.
59. Lyne R, Burns G, Mata J, Penkett CJ, Rustici G, Chen D, Langford C,
Vetrie D, Bähler J: Whole-genome microarrays of fission yeast:
characteristics, accuracy, reproducibility, and processing of
array data. BMC Genomics 2003, 4:27.
60. Schizosaccharomyces pombe: GeneDB [ />genedb/pombe/index.jsp]
61. The Sanger Institute: S. pombe [ />Genomics/S_pombe/projects/stress]
62. NCBI BLAST [ />63. Mata J, Lyne R, Burns G, Bähler J: The transcriptional program of
meiosis and sporulation in fission yeast. Nat Genet 2002,
32:143-147.
64. EBI databases - ArrayExpress Home [ />arrayexpress]
65. Fan JB, Chikashige Y, Smith CL, Niwa O, Yanagida M, Cantor CR:
Construction of a NotI restriction map of the fission yeast
Schizosaccharomyces pombe genome. Nucleic Acids Res 1989,
17:2801-2818.