Báo cáo y học: "Comparative context analysis of codon pairs on an ORFeome scale" docx
Bạn đang xem bản rút gọn của tài liệu. Xem và tải ngay bản đầy đủ của tài liệu tại đây (526.58 KB, 14 trang )
Genome Biology 2005, 6:R28
comment reviews reports deposited research refereed research interactions information
Open Access
2005Mouraet al.Volume 6, Issue 3, Article R28
Method
Comparative context analysis of codon pairs on an ORFeome scale
Gabriela Moura
*
, Miguel Pinheiro
†
, Raquel Silva
*
, Isabel Miranda
*
,
Vera Afreixo
†
, Gaspar Dias
†
, Adelaide Freitas
‡
, José L Oliveira
†
and
Manuel AS Santos
*
Addresses:
*
Centre for Cell Biology, Department of Biology, University of Aveiro, 3810-193 Aveiro, Portugal.
†
Institute of Electronics and
Telematics Engineering, University of Aveiro, 3810-193 Aveiro, Portugal.
‡
Department of Mathematics, University of Aveiro, 3810-193 Aveiro,
Portugal.
Correspondence: Manuel AS Santos. E-mail:
© 2005 Moura et al.; licensee BioMed Central Ltd.
This is an Open Access article distributed under the terms of the Creative Commons Attribution License (
which permits unrestricted use, distribution, and reproduction in any medium, provided the original work is properly cited.
Comparative codon context analysis<p>We have developed a system for comparative codon context analysis of open reading frames in whole genomes, providing insights into the rules that govern the evolution of codon-pair context.</p>
Abstract
Codon context is an important feature of gene primary structure that modulates mRNA decoding
accuracy. We have developed an analytical software package and a graphical interface for
comparative codon context analysis of all the open reading frames in a genome (the ORFeome).
Using the complete ORFeome sequences of Saccharomyces cerevisiae, Schizosaccharomyces pombe,
Candida albicans and Escherichia coli, we show that this methodology permits large-scale codon
context comparisons and provides new insight on the rules that govern the evolution of codon-
pair context.
Background
The standard genetic code uses 64 codons for only 22 amino
acids, including the amino acids selenocysteine and pyrroly-
sine whose incorporation into protein requires the reassign-
ment of the UGA and UAG stop codons, respectively [1,2].
This degeneracy of the genetic code has important implica-
tions for gene primary structure evolution as it provides
nature with a vast array of options for building open reading
frame (ORF) sequences for any particular protein. However,
the usage of synonymous codons for building ORFs is not ran-
dom, suggesting the existence of mechanistic or evolutionary
constraints that limit the degree of freedom for coding
sequence building [3-6]. In other words, each organism uses
a set of rules for building ORF sequences which restrict the
total number of options provided by the degeneracy of the
genetic code. These rules are only partly understood. Never-
theless, it is becoming increasingly clear that codon usage and
context bias reflect the action of two main evolutionary
forces: selection for mRNA decoding efficiency and muta-
tional drift acting indiscriminately on coding and noncoding
DNA [7-10].
Codon usage reflects selection for translational efficiency, as
highly expressed genes tend to use codons that are decoded
by abundant cognate tRNAs [11-13]. Similarly, the context of
a sequential pair of codons (codon-pair) is biased, but this
bias is apparently linked more to decoding accuracy than to
translational speed [14-17]. This suggests that the transla-
tional machinery is sensitive to the nature of the codon-pair
present in the ribosome A and P decoding sites [16,18-20],
raising the possibility that, like codon usage, codon context
may also be species specific. This is supported by the fact that
tRNA populations diverge in the number and abundance of
tRNA isoacceptors for each codon family and also in the pat-
tern of modified nucleosides in the tRNAs, which also affects
mRNA decoding accuracy.
Published: 15 February 2005
Genome Biology 2005, 6:R28
Received: 24 September 2004
Revised: 25 November 2004
Accepted: 17 January 2005
The electronic version of this article is the complete one and can be
found online at />R28.2 Genome Biology 2005, Volume 6, Issue 3, Article R28 Moura et al. />Genome Biology 2005, 6:R28
To shed new light on the overall pattern of codon context at
the species level and evaluate how codon-pair context varies
between species, we have developed software and statistical
methodologies for codon-pair context analysis on all the
ORFs in a genome as a whole (the ORFeome). Because our
main interest is to evaluate the effect of codon context on
mRNA decoding accuracy, this study focuses on the context of
codon-pairs and not on long-range context effects. With a few
exceptions, long-range context is not relevant for mRNA
decoding by the ribosome. These new methodologies were
tested using the complete ORFeome sequences of the eukary-
otes Saccharomyces cerevisiae, Candida albicans and
Schizosaccharomyces pombe and the bacterium Escherichia
coli. The methodology developed provides robust and flexible
tools for intra- and inter-ORFeome comparative codon-pair
context analysis, permits identification of species-specific
codon context fingerprints and provides new insight into the
role of codon context on mRNA decoding accuracy and ulti-
mately on the pressure imposed by the translational machin-
ery on the evolution of the ORFeome. The software
developed, called Anaconda, is available at [21].
Results
Global analysis of codon context in yeast
The Anaconda bioinformatics system developed in this study
identifies the start codon of an ORF and reads it by moving a
'decoding window' three nucleotides at a time in the 3' direc-
tion until it encounters a stop codon. While doing so it fixes
the middle codon of the reading window and memorizes its 5'
and 3' neighbors. Anaconda creates a table of frequencies of
64 × 64 codons that allows computation of the number of
times the complete set of contiguous codon pairs occurs in an
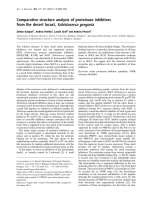
ORF or in an ORFeome. The overall architecture of Anaconda
is described in Figure 1.
The codon-pair context frequency table built by Anaconda
allows the statistical analysis of contingency tables to be used
to test whether the context is significantly biased [22-25].
These tables allow one to test the existence of association
between codon-pairs through the chi-square (χ
2
) test of inde-
pendence; to identify preferred and rejected pairs of codons
in the ORFeome through the analysis of adjusted residuals for
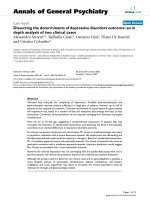
contingency tables (Table 1 and Figure 2); and to construct a
codon context map on an ORFeome scale (Figure 3). The Ana-
conda algorithm, its graphical interface and implemented
statistical methodologies were tested using the yeast S. cere-
visiae ORFeome. For this, the complete ORFeome was down-
loaded from the yeast genome database [26], the adjusted
residual values for the total number of codon pairs were cal-
culated (see Materials and methods) and each residual value
present in a cell of the contingency table (64 lines × 64 col-
umns) was converted into a two-color coded map (Figure 3).
In the latter, green represents positive values greater than +3
(herein called preferred codon-pairs) and red represents neg-
ative values lower than -3 (herein called rejected codon-pairs)
according to the color scale indicated in Figure 3a. The data
clearly show that each codon has a set of preferred 3' codon
neighbors (green) and rejects a set of other codons (red), indi-
cating that codon context is highly biased in S. cerevisiae.
However, in a rather large number of cases, the 3' codon con-
text is not biased or at least strongly rejected or preferred.
This is indicated by the black color in the map (Figure 3) and
in the histogram of the residuals distribution (Figure 4). This
black color corresponds to residual values that fall within the
interval of -3 to +3 and correspond to codon contexts that do
not contribute to the bias for a confidence level of 99.73%
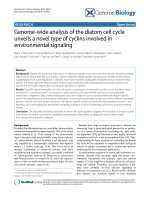
Architecture of the Anaconda bioinformation systemFigure 1
Architecture of the Anaconda bioinformation system. The Anaconda
package contains a data-acquisition module that permits downloading raw
data from genome databases and filter it into a local database. This data is
then processed using a ribosome simulation algorithm and transferred to a
64 × 64 table that renders itself to statistical analysis. The processed data
is then transferred to the visualization module that has a number of
different tools that permit different types of data visualization and analysis.
RSCU, relative synonymous codon usage values from very highly
expressed genes, necessary for codon adaptation index (CAI) calculation
(see [55]).
Cluster analysis
Matrix
Genes, sequences
Histograms
Pseudogenes
Filter
Acquisition
Anaconda
Visualization
Processing
Treated data
Statistical
Ribosome simulation
RSCU values
Import/filter ORFs
Genome database
Codon context is highly biased in yeastFigure 2
Codon context is highly biased in yeast. The bar chart shows the
distribution of the adjusted residual values given in Table 1 for the 3'
context of the S. cerevisiae CUG codon. See Table 1 legend for details.
-10
-8
-6
-4
-2
0
2
4
6
8
10
AAA
AAG
AAU
AAC
ACU
ACC
ACA
ACG
CGU
CGC
CGA
CGG
AGA
AGG
UCU
CUU
CUC
CUA
CUG
CCU
CCC
CCA
CCG
CAU
CAC
CAA
CAG
UAA
CUG 3' codon context
Adjusted Residuals (d
ij
)
Genome Biology 2005, Volume 6, Issue 3, Article R28 Moura et al. R28.3
comment reviews reports refereed researchdeposited research interactions information
Genome Biology 2005, 6:R28
(Table 1 and Figure 2). The overall empirical distribution of
residual values for codon context in the yeast ORFeome (Fig-
ure 4) clearly shows that a large fraction (about 47%) of
codon-pair contexts fall within the interval of -3 to +3, indi-
cating that in many cases the context may not be under high
selective constraint.
Codon clustering unveils unique features of codon
context
The codon-pair context maps shown in Figure 3a,b were built
using a manually predefined distribution of codons in both
lines and columns. To better understand the full extent of the
codon-pair context bias in yeast, the data were clustered
using the Pearson's correlation coefficient [27], which enables
grouping of codons with similar context preferences. Using
double clustering (that is, clustering both lines and columns)
several distinct groups of red and green codon-pair contexts
were identified for the S. cerevisiae ORFeome, thus showing
that certain groups of codons have similar 3'-neighbor prefer-
ences (Figure 5).
To identify the codons responsible for defining the subgroups
with high bias (red and green clusters) and evaluate whether
these could define codon-pair context rules, one zooms in on
the context subclusters. Three specific subclusters (one red
and two green) were analyzed in this study (Figure 6a-c). The
red subcluster shown in Figure 6a is defined by codon-pairs
in which the last nucleotide of the first codon is uridine (U)
and the first nucleotide of the next codon (3' side) is adenos-
ine (A). As no such rule was observed for the other codon
positions - that is, positions 1 and 2 or 2 and 3 of codon 1 or
positions 1 and 2 or 2 and 3 of codon 2 (data not shown), the
codons are clustered based on the following context rejection
rule: XXU-AYY. The intensity of rejection (given by the
adjusted residual itself) is not identical for all codon combina-
tions within the subcluster. However, with the exception of
the asparagine AAU and serine AGU codons, and some others
whose residual values fall within the non-statistically signifi-
cant -3 to +3 interval, all other U-ending codons avoid 3'-
neighbor codons starting with an A. If one assumes that fixed
codons in the map (lines) represent P-site codons and 3'
codons (columns) represent A-site codons, then the above
rule suggests that the third base of a P-site codon somehow
influences the choice of the first base of the A-site codon. In
other words, and assuming that context modulates decoding
accuracy, S. cerevisiae codon pairs that end with an U and
start with an A are likely to cause some trouble to the ribos-
ome during decoding.
The above observations were confirmed by analyzing two
green codon-pair context subclusters (good contexts). In
these cases, two different clustering rules were identified,
namely the XXC-AYY and the XXU-GYY (Figure 6b,c). Like
the bad context subcluster discussed previously, in these good
context subclusters there are exceptions that include red and
black context cells. Nevertheless, there is a strong trend for
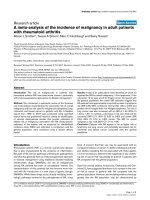
S. cerevisiae genome map of codon contextFigure 3
S. cerevisiae genome map of codon context. For visualization purposes the
values of the residuals of the 64 × 64 codon context table were converted
into a color-coded map in which red represents the negative values (bad
context) and green the positive values (good context). The values that are
not statistically significant are indicated in black (-3 to +3). The color scale
represents the full range of values of residuals for yeast codon context.
Fixed codons represent the P-site codons and the 3' context refers to the
A-site codons as viewed by the ribosome simulation software module. (a)
The yeast complete 3' codon context map shows a diagonal green line,
which indicates that most codons prefer themselves as neighbors on their
3' side. The map also indicates that without exception, each codon prefers
a defined set of neighbors (green) and avoids others (red). The intensity of
red and green indicates the extent of the preference or rejection. (b)
Codons that are represented in the map can be visualized by zooming into
particular areas of the map (boxed in dark blue in (a)). The order of the
fixed and 3' context codons indicated in (b) is predefined in the software
module.
(a)
(b)
Lys AAA
Lys AAG
Asn AAC
Asn AAU
Thr ACA
Thr ACC
Thr ACG
Thr ACU
Arg AGA
Arg AGG
Arg CGA
Arg CGC
Arg AGG
Arg AGU
AAA Lys
AAG Lys
AAC Asn
AAU Asn
ACA Thr
ACC Thr
ACG Thr
ACU Thr
AGA Arg
AGG Arg
CGA Arg
CGC Arg
AGG Arg
AGU Arg
-100
Fixed codons
3' context
-10 -5 -3 0 53 10 100
R28.4 Genome Biology 2005, Volume 6, Issue 3, Article R28 Moura et al. />Genome Biology 2005, 6:R28
the above rule within each subcluster, indicating once more
that the third base of the P-site codon influences the first base
of the A-site codon. The fact that these rules cannot be seen
for other codon positions, and that there are exceptions to
these rules for other codon families in the overall map,
excludes the possibility that the third-first base rules identi-
fied reflect dinucleotide preferences or rejections arising from
DNA replication and repair ([28] and see later).
Comparative codon context analysis
Because the S. cerevisiae codon-pair context map produced a
clear context pattern, we wondered whether this map could
represent a species-specific fingerprint, as is the case for the
codon-usage fingerprint. For this, maps for S. pombe, C. albi-
cans and E. coli were also constructed, with the latter being
used as an outgroup. Some similarities between the codon-
pair context maps were immediately visible, namely a strong
green diagonal line in the yeast maps (Figure 7). There are,
however, important differences that become evident when
the negative and positive residual values are ranked for the
yeast species studied (Table 2). These values represent the
most negative and positive residuals of the yeast maps and
consequently provide a good indication of the differences in
codon context present in the three yeast species. Of the 10
most positive residual values ranked in Table 2, only two are
common for the three yeast species, namely GAA-GAA, GGU-
GGU and GCU-GCU. A similar result was obtained when the
most negative values were ranked (Table 2). In addition, the
C. albicans genome shows a more biased codon-pair context
status. For example, the 10th most positive residual (49,476
for ACA-ACA) is higher than the maximum residual value for
S. cerevisiae and S. pombe: 45,422 for CAG-CAG and 35,086
for UCU-UCU, respectively (Table 2).
An additional approach to identifying codon-pair context dif-
ferences between S. cerevisiae, S. pombe and C. albicans, was
undertaken by overlapping the complete codon context maps
displayed in Figure 7. For this, the maps built with a prede-
fined order of codons for both the 64 lines and the 64 columns
were merged, allowing the construction of a comparison
codon-pair context map. We call this a differential codon-pair
context map (DCM) and it corresponds to the module of the
difference between the residuals of overlapped cells of the 64
× 64 context table (Figure 8). A new color scale based on gra-
dation of blue was used for the differential display. Using this
methodology, the codon context differences for the three
yeast species became self-evident, indicating that codon con-
text - like codon usage - is species specific (Figure 8). In all
three DCMs shown in Figure 8 there are common features,
which are indicated by the black cells; however, the differ-
ences (blue) are clearly visible. As expected from the phyloge-
netic distance of the various species studied, the DCMs for the
pairs E. coli-S. cerevisiae and E. coli-C. albicans show many
more differences than the DCM for the pair S. cerevisiae-C.
albicans.
The DCMs also show that codon-pair context is more similar
for the pair S. pombe-S. cerevisiae (data not shown) than for
the other two yeast pairs, indicating that there are fewer
differences between S. pombe and S. cerevisiae than between
C. albicans and S. cerevisiae. This is surprising, considering
that S. pombe diverged from S. cerevisiae 420 million years
ago whereas C. albicans diverged from the latter only 170
million years ago [29]. The effect of the rather strong green
diagonal (codon repeats) in the C. albicans maps is also visi-
ble in the DCMs (blue cells) of the C. albicans-S. cerevisiae
pairs (Figure 8a). In order to shed more light on the differ-
ences in the codon context maps for the three yeasts, codon
pairs were ranked according to the module of the difference
between residuals (Table 3). Surprisingly, only one codon
pair for the three yeast species (CAA-CAA) is present among
the 10 highest values that were ranked. Further, the differ-
ence between these three species is not only qualitative, as
shown above, but is also quantitative. For example, for the S.
pombe-S. cerevisiae pair, the highest difference was found for
the pair CAG-CAG with a value of 27,798, whereas in the S.
Table 1
The 3' codon context of CUG
3' Codon Residual 3' Codon Residual 3' Codon Residual 3' Codon Residual
AAA 7.436 ACG 0.644 UCU -10.007 CCA -2.438
AAG 1.927 CGU -1.809 CUU 1.167 CCG 2.895
AAU 0.397 CGC 2.981 CUC 2.18 CAU 2.026
AAC 2.037 CGA 8.258 CUA 5.258 CAC 2.642
ACU -6.947 CGG 5.404 CUG 6.774 CAA 4.049
ACC -5.239 ACG -4.726 CCU -1.769 CAG 7.105
ACA -5.12 AGG -0.666 CCC 8.894 UAA 0.22
Positive values indicate that the 3' codons appear in the genome more times than expected (good context) while negative values indicate that the 3'
codons appear fewer times than expected assuming a random distribution (bad context). Residual values give a quantitative indication of the context
bias, where values falling within the -3 to +3 interval are not statistically significant (no bias). See also Figure 2.
Genome Biology 2005, Volume 6, Issue 3, Article R28 Moura et al. R28.5
comment reviews reports refereed researchdeposited research interactions information
Genome Biology 2005, 6:R28
pombe-C. albicans map the CAA-CAA pair showed a differ-
ence value of 100,639. In fact, in the latter yeast pair DCM all
10 values related are higher than the highest value (27,798)
found for the CAG-CAG codon pair in the S. pombe-S. cerevi-
siae map (Table 3). Therefore, when taken together, DCMs
and residuals rankings provide unique insight into the codon-
pair context differences, even for phylogenetically related
species such as yeasts.
Contribution of mutation bias to codon-pair context
An important feature of the codon-pair context map in the
yeasts analyzed, but not in E. coli, is the presence of a diago-
nal green line (Figures 3, 7). The existence of this green line
implies that in those yeasts, most codons prefer to have
another identical codon on their 3' side, indicating a degree of
tandem codon duplication in the ORFeome of yeasts. Trinu-
cleotide repeats are characteristic of eukaryotic genomes and
have been attributed to DNA polymerase slippage during
genome replication [30]. Whether the codon duplication
observed in the ORFeome of the yeasts analyzed is a conse-
quence of DNA replication only, or also reflects an evolution-
ary constraint imposed by the mRNA decoding machinery on
those ORFeomes, is not yet clear and we are currently inves-
tigating this. In any case, this diagonal line in the codon con-
text maps of yeasts is a strong feature, since the highest
residuals of codon pairs (preferred pairs) occur for tandem
codon repeats (Table 2).
The above observations prompted us to investigate whether
mutational bias also played a part in codon-pair context bias
and whether such bias could be extracted from the codon-pair
context maps. For this, particular attention was given to GC
content because it plays a major role in codon usage [31]. An
algorithm was implemented into Anaconda for calculating
%GC total, %GC at codon position 1 (GC1), %GC at codon
position 2 (GC2) and %GC at codon position 3 (GC3). While
scanning an ORFeome, Anaconda divides ORFs into GC-con-
tent subgroups and creates groups of ORFs with high and low
GC content. It also determines the distribution of ORFs
according to their GC total and GC3 (Figure 9a,c). Codon-pair
codon context maps can be built for each subgroup of codons
and the maps compared using the DCM tool (Figures 9b,d
and 10).
Because GC bias is better observed at the third codon position
as a result of the degeneracy of the genetic code, GC3 was used
to evaluate whether mutational bias contributed to the
codon-pair context using the S. cerevisiae and E. coli ORFe-
omes as proof of principle. In the former, the ORF
distribution varied from a minimum of 11.9% to a maximum
of 76.7%; however, most ORFs fell within a narrow interval
between 35-40% GC3 (Figure 9a). In the case of E. coli, the
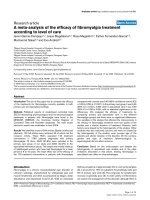
Distribution of the adjusted residuals from the S. cerevisiae codon context mapFigure 4
Distribution of the adjusted residuals from the S. cerevisiae codon context
map. Forty-three percent of the residuals fall within the nonsignificant -3
to +3 interval, indicating that a very large number of codon combinations
are not significant to the rejection of independence - that is, are not
significantly preferred or rejected in this genome.
-30 -20 -10 0 10 20 30
161
322
483
0
644
Values of residuals
Number of residuals
Codon context bias is organized in discrete groupsFigure 5
Codon context bias is organized in discrete groups. A two-way Pearson
clustering by single linkage of the codon context data highlights regions of
good and bad codon context, indicating that codon context bias is highly
structured. A significant number of codons do not fall into the major
clusters, indicating that their preferences and rejections are defined on a
one-to-one basis. The 3' codon contexts whose residual values fall within
the nonstatistically significant -3 to +3 interval are also scattered in the
map, indicating that there is no cluster of codons that have little or no
preference for particular codons as 3' neighbors.
-100 -10 -5
Fixed codons
3' context
-3 0 3 5 10 100
R28.6 Genome Biology 2005, Volume 6, Issue 3, Article R28 Moura et al. />Genome Biology 2005, 6:R28
ORF distribution is broader, varying from a minimum of
20.0% to a maximum of 89.4%, but most ORFs have a GC3
between 50% and 60% (Figure 9c). This distribution made it
possible to build codon-pair context maps for the low GC3
and high GC3 subgroups. As differences between these low
and high GC3 context maps were expected to allow for evalu-
ation of the importance of the bias introduced by mutational
drift into the codon-pair context maps, these maps were over-
lapped using the DCM tool. As before, the maps were built
using a single colour (blue) to aid visualization of the context
differences. If mutational drift did not contribute to the con-
text bias, the codon-pair context maps of the GC3 subgroups
would be identical, producing a black differential display
map. This is because the difference of the module of the resid-
uals would be zero for all cells of the table of residuals.
The differential display map for the low and high GC3 ORF
subgroups of S. cerevisiae showed several differences, indi-
cating that GC bias contributes to the codon-pair context.
However, most of these differences corresponded to small
deviations in the strength of the rejection or preference of the
codon-pair contexts (Figure 9b and 10, see also Table 4). In
other words, the residual values had the same positive or neg-
ative signal in both cases but the value was higher in one GC3
subgroup than the other and vice versa. In some cases, an
inversion of signal of the residuals (for example, from positive
to negative) was detected, indicating that the residual of the
codon-pair was positive in one GC3 subgroup and negative in
the other GC3 subgroup (light blue in Figure 9b). This inver-
sion of signal provides clear evidence for the influence of GC
content bias in the codon-pair context. Similar results were
obtained for the E. coli ORFeome; however, a much larger
number of inversions of the residual signal was observed in
this case, indicating that the GC content bias is far stronger in
E. coli than in S. cerevisiae (Figures 9d and 10, see also Table
4). The reasons for these differences and the quantitative con-
tribution of mutational bias to codon-pair context bias is not
yet fully understood and is currently being investigated. How-
ever, Anaconda already provides strong evidence for a role for
mutational bias on codon-pair context.
Figure 6
Met AUG
Ile AUA
Thr ACG
Thr ACA
Asn AAU
Asn AAC
Ser AGU
Ser AGC
Lys AAG
Lys AAA
Arg AGG
Arg AGA
Ile AUU
Val GUU
Phe UUU
Leu CUU
Tyr UAU
His CAU
Cys UGU
Pro CCU
Ala GCU
Asn AAU
Ser AGU
Asp GAU
Arg CGU
Bad context rule: XX UA YY
Met AUG
Ile AUA
Thr ACG
Thr ACA
Asn AAU
Asn AAC
Ser AGU
Ser AGC
Lys AAG
Lys AAA
Arg AGG
Arg AGA
Thr ACU
Thr ACU
Ile AUU
Ile AUC
Ala GCC
Val GUC
Thr ACC
Pro CCC
Ser UCC
Ile AUC
Phe UUC
Asn AAC
Lys AAG
Leu UUG
Ser AGC
Good context rule: XX CA YY
Met AUG
Ile AUA
Thr ACG
Thr ACA
Asn AAU
Asn AAC
Ser AGU
Ser AGC
Lys AAG
Lys AAA
Arg AGG
Arg AGA
Thr ACU
Thr ACU
Ile AUU
Ile AUC
Ala GCC
Val GUC
Thr ACC
Pro CCC
Ser UCC
Ile AUC
Phe UUC
Asn AAC
Lys AAG
Leu UUG
Ser AGC
Met AUG
Ile AUA
Thr ACG
Thr ACA
Asn AAU
Asn AAC
Ser AGU
Ser AGC
Lys AAG
Lys AAA
Arg AGG
Arg AGA
Thr ACU
Thr ACU
Ile AUU
Ile AUC
Ala GCC
Val GUC
Thr ACC
Pro CCC
Ser UCC
Ile AUC
Phe UUC
Asn AAC
Lys AAG
Leu UUG
Ser AGC
(a)
(b)
Thr ACU
Ser UCU
Ile AUU
Val GUU
Phe UUU
Leu CUU
Tyr UAU
His CAU
Cys UGU
Pro CCU
Ala GCU
Asn AAU
Ser AGU
Asp GAU
Arg CGU
Gly GGU
Met AGU
Glu GAA
Asp GAU
Asp GAC
Gly GGG
Gly GGC
Gly GGA
Val GUG
Val GUA
Ala GCG
Ala GCA
Ala GCU
Ala GCC
Gly GGU
Val GUU
Val GUC
Good context rule: XX UG YY
(c)
Codon clusters define specific codon-context rules in S. cerevisiaeFigure 6
Codon clusters define specific codon-context rules in S. cerevisiae. (a) A
major cluster of bad context is defined by codon pairs whose wobble base
of the first codon is uridine (U) and the first base of the 3' neighbor is
adenosine (A). This cluster defines a XXU-AYY context rule, in which X
and Y are any nucleotide. Within this cluster some of the Asn and Ser
codons represent exceptions to the above rule as their residual signal is
positive (green cells). (b,c) Two of the good context clusters define two
distinct codon context rules, namely (b) XXC-AYY and (c) XXU-GYY
rules. As before, some of the codons within those clusters are exceptions
to the above rules and a number of codons have no particular preferences
or rejections (black cells).
Genome Biology 2005, Volume 6, Issue 3, Article R28 Moura et al. R28.7
comment reviews reports refereed researchdeposited research interactions information
Genome Biology 2005, 6:R28
Discussion
Codon context has been extensively studied in prokaryotic,
eukaryotic, mitochondrial and viral genomes, and these
studies unequivocally showed that codon-pair context is
biased [9,10,32-35]. However, no tool has yet been developed
to display codon context data and in particular codon-pair
context (short-range context) in a way that would facilitate
interpretation of the data and allow inter- or intra-genome
context comparisons. This is essential if putative general rules
that govern codon-pair context evolution are to be unraveled.
The Anaconda bioinformation system has been developed to
address this problem. By using statistical methodologies
based on contingency tables and residual analysis (see Mate-
rials and methods), specific codon-pair context patterns were
unveiled and displayed using a color coded ORFeome-context
map. The data highlighted codon-pair context bias in yeasts
and E. coli and some rules that define codon-pair context pat-
terns in yeast.
Forces that shape codon-pair context
Studies carried out in the 1980 s in E. coli have demonstrated
that codon-pair context influences mRNA decoding accuracy
and efficiency, indicating that the translational machinery
imposes significant constraints on codon-pair context
[17,36,37]. For example, in starved E. coli cells, the asparag-
ine AAU and AAC codons are misread as lysine at high fre-
quency [16]. Quantification of the level of lysine
misincorporation at those codons and determination of the
effect of the 3' nucleotide context on lysine misincorporation
showed that the AAU codon is misread up to nine times more
frequently than the AAC codon, and that the 3' nucleotide
context (III-I context) influenced the level of misreading by as
much as twofold [16]. Additional studies carried out in vitro
in E. coli, have also shown that ribosomes discriminate C-
ending Phe UUC and Leu CUC codons less well than the U-
ending Phe UUU and Leu CUU, showing that synonymous
codons differ in translational accuracy [38]. Therefore, a pos-
Codon context maps are species specificFigure 7
Codon context maps are species specific. Comparison of the genomic
codon context maps of S. cerevisiae, C. albicans, S. pombe and E. coli shows
that they are all different. There are common features between the maps
but differences are clearly visible, indicating that each species has a specific
set of codon context rules. Among the common features, the green
diagonal line in the yeast maps is the most relevant. This diagonal indicates
that almost all codons prefer themselves as their 3' neighbors and is
strongly marked in the C. albicans context map, suggesting that in this
species, tandem codon repetition is very common.
S. cerevisiae C. albicans
S. pombeE. coli
Differential display maps for comparative analysis of codon contextFigure 8
Differential display maps for comparative analysis of codon context. To
compare the codon context maps of different species, the order of the
codons displayed in the map was fixed and the maps overlapped using a
differential display tool built into the Anaconda bioinformation system.
Maps representing the context differences between (a) S. cerevisiae and C.
albicans, (b) E. coli and S. cerevisiae and (c) C. albicans and S. cerevisiae were
obtained by calculating the module of the difference between the residuals
of each map. The differences are represented in blue according to the
color scale. The blue cells indicate the highest context difference and the
black cells represent pairs of codons that have similar residual values
between two species (module of the difference between residuals falls
within the 0-15 interval). The maps show rather large differences in codon
context between E. coli and S. cerevisiae or C. albicans and smaller
differences between S. cerevisiae and C. albicans.
S. cerevisiae
C. albicans
E. coli
E. coli
S. cerevisiae
C. albicans
Scale
(a) (b)
(c)
0
15 200
R28.8 Genome Biology 2005, Volume 6, Issue 3, Article R28 Moura et al. />Genome Biology 2005, 6:R28
sible role for codon-pair context is minimization of decoding
error, in particular in those codons that are poorly discrimi-
nated by the ribosome.
In E. coli, over-represented codon-pairs are translated more
slowly than under-represented codon-pairs, indicating that
codon-pair context also influences translational speed [14].
This suggests that codon-pair context in E. coli is under
strong selective constraints imposed by the translational
machinery. Whether the context patterns now unveiled in
yeast reflect similar selective constraints remains unclear.
Nevertheless, the codon-pair context maps described here
provide a good starting point to address this important
biological question in vivo in yeast in a guided manner. Addi-
tional evidence for a role for selection on codon-pair context
was highlighted by the negligible, or even zero, contribution
of GC3 to the context bias in very frequent or very infrequent
codon-pairs (strong contexts) in both S. cerevisiae and E. coli
(Figure 9, Table 4) and by a number of exceptions to the
context rules that define the subclusters of codon-pairs (Fig-
ure 6). For example, within the XXU-AYY subcluster of
rejected codons (Figure 6a), the codon pairs AAU-AGC, AAU-
AGU, AAU-AAU, AAU-AAC and the set of AGU-AGC, AGU-
AGU, AGU-AAU, AGU-ACA, AGU-AUA have positive residu-
als, indicating that they are codon pairs preferred by the
ORFeome. Similar exceptions are found within the subclus-
ters of preferred codon pairs shown (Figure 6b,c). Further-
more, a detailed analysis of the overall ORFeome context map
(Figure 5) shows that other codon-pairs violate the XXU-AYY
rules, namely GGU-AUG, GGU-AUC, GGU-AUU, GGU-ACC,
GGU-ACU. This supports the hypothesis that those clusters of
the context map are not formed on the basis of particular
dinucleotide combinations that may be related to genome
mutational drift. This is further confirmed by our observation
that the dinucleotide preference in the XXU-AYY, XXC-AYY
and XXU-GYY codon pairs is not observed when the various
positions within each codon or codon-pair are analyzed. In
other words, in the codon pair X
1
X
2
X
3
-Y
1
Y
2
Y
3
, the X
3
-Y
1
Table 2
Ranking of the 10 most negative and 10 most positive residual values in S. cerevisiae, S. pombe and C. albicans contexts
S. cerevisiae S. pombe C. albicans
Context Residual Context Residual Context Residual
Most negative values
UUU → AAG -24.58 GAA → CCU -24.159 UUU → CCA -32.691
GAU → AAG -22.487 GAU → AAG -24.124 UUC → GAA -31.586
AUU → AAA -21.546 UUU → AAG -23.899 UCA → GAU -28.317
AUU → AAG -21.285 AUU → AAA -22.923 AUU → AAG -28.284
CUU → AAA -20.656 UCU → AAG -22.334 GGU → UUU -27.198
UUU → AAA -20.563 CUU → AAA -21.25 AAC → UUA -26.198
UCC → GAA -20.069 GUU → AAA -21.218 GAC → UUA -25.795
AAG → UCU -19.706 AUU → AAG -21.08 UUU → AAG -25.316
GAU → CAA -19.274 UUU → AAA -20.704 GGA → AAA -25.26
GAA → CCA -19.155 GAA → UCU -20.698 UUC → GAU -24.822
Most positive values
GAU → GAU 29.839 CAG → CAA 25.279 ACA → ACA 49.476
AAG → AAG 29.937 GAA → GAG 25.644 CAC → CAC 49.511
UUG → AAA 30.459 AAG → AAG 26.901 CCA → CCA 52.889
GAA → GAA 30.573 CUU → CGU 27.013 GAA → GAA 57.356
AAG → AAA 31.427 GAA → GAA 28.051 AAG → AAA 58.605
CAG → CAA 33.445 AGA → AGA 29.623 GCU → GCU 62.611
AGA → AGA 33.798 AAA → AAG 30.358 ACC → ACC 70.117
GGU → GGU 35.979 GCU → GCU 32.158 GGU → GGU 72.48
GCU → GCU 36.231 GGU → GGU 33.681 AAC → AAC 87.115
CAG → CAG 45.422 UCU → UCU 35.086 CAA → CAA 105.216
Anaconda was used to analyze the codon context of the complete genomes of S. cerevisiae, S. pombe and C. albicans. All possible codon contexts
were ranked according to their calculated adjusted residuals, and the 10 most negative and 10 most positive were selected as extreme examples.
The results indicate that only a small number of bad or good codon pairs (shown in bold) are shared between all three yeast species.
Genome Biology 2005, Volume 6, Issue 3, Article R28 Moura et al. R28.9
comment reviews reports refereed researchdeposited research interactions information
Genome Biology 2005, 6:R28
preferences are not observed for the dinucleotides X
1
-X
2
, X
2
-
X
3
, Y
1
-Y
2
and Y
2
-Y
3
(data not shown).
Despite these arguments, mutational bias does influence
codon-pair context [7,39-41]. Observed mutational bias
reflects mutational events that act indiscriminately on all
DNA sequences (coding and noncoding DNA) and is conse-
quently a property of the genome rather than the result of
selection acting within ORFs [42-45]. The data presented
here is in line with those observations. For example, context
maps shown in this study indicate that several of the context
clusters are formed on the basis of dinucleotide context rules
(III-I rule), namely the XXU-AYY, XXC-AYY, XXU-GYY (Fig-
ure 6a-c). As dinucleotide context is related to DNA repair
and replication constraints those clusters reflect mutational
bias [28]. An important feature that highlights the influence
of mutational bias on codon-pair context is GC content, in
particular GC3 content. GC content has a strong influence in
codon usage and in extreme cases can even drive certain
codons out of ORFeomes [46,47]. The data presented here
clearly show that GC3 affects codon-pair context; however,
this effect is mainly visible for codon-pairs that have weak
residuals (Table 4, Figure 9). As strong residuals (either pos-
itive or negative) provide an indirect measure of the strength
of the codon-pair association, it is likely that for extreme
residuals GC3 bias introduces only noise into the analysis
whereas for residuals near the statistically nonsignificant
interval (-3, +3), GC3 bias represents a major contribution to
the context bias observed (Figure 9).
Apart from those cases mentioned above, other species-spe-
cific genomic features also contribute to codon-pair context
bias highlighted by Anaconda. For example, the yeast codon-
pair context maps show a feature of eukaryotic genomes
which is not related to mRNA translation: trinucleotide
repeats which are evident in the diagonal line present in Fig-
ures 3 and 7. This strongly suggests that there is a very high
degree of tandem codon repeats (trinucleotide repeats),
which are likely to arise from biased DNA replication (DNA
polymerase slippage, see [30]). Whether these repeated
codon-pairs improve mRNA translation efficiency or
accuracy in yeast remains to be determined experimentally.
As far as we are aware, there is no experimental evidence
showing increased decoding accuracy or efficiency at those
sites.
Finally, constraints imposed by protein sequences and mRNA
secondary structure are also thought to influence codon con-
text [48,49]. The context maps seem to exclude the former
hypothesis because no cluster is formed as a result of selec-
tion or rejection of two adjacent amino acids. In regard to the
latter constraint, the Anaconda algorithm was not designed to
detect mRNA secondary structures and consequently this
question cannot be addressed at this stage.
Table 3
Ranking of the codon pairs that display the highest residual difference between S. cerevisiae, S. pombe and C. albicans
S. pombe-S. cerevisiae S. pombe-C. albicans C. albicans-S. cerevisiae
Context Difference Context Difference Context Difference
CAG → CAG 27,798 CAA → CAA 100,639 CAA → CAA 79,38
UUG → AAA 25,266 AAC → AAC 76,716 AAC → AAC 62,939
CUU → CGU 25,168 ACC → ACC 60,208 ACC → ACC 50,735
CAA → CAG 24,507 CCA → CCA 47,603 CCA → CCA 39,196
AAA → AAG 23,593 ACA → ACA 47,359 CAC → CAC 39,032
UUC → AAA 22,86 CAC → CAC 47,175 ACA → ACA 39,029
AAU → AAU 22,021 GGA → AAA 45,043 GGU → GGU 36,501
CAA → CAA 21,259 AAG → AAA 43,994 GGA → UUA 35,81
GUU → CUU 21,194 CAA → CAG 43,927 GGA → AAA 29,786
GAU → GAC 19,483 UCA → UCA 41,533 GUU → GAU 29,753
Anaconda was used to analyze the codon context of the complete genomes of S. cerevisiae, S. pombe and C. albicans. The adjusted residuals of each
codon context calculated for each pair of genomes - that is, S. pombe-S. cerevisiae; S. pombe-C. albicans; and C. albicans-S. cerevisiae - were subtracted
and the result converted into a positive number by a module calculation. These values were used to rank the respective codon contexts and the 10
highest cases obtained were selected. Among these three yeast species, S. pombe and S. cerevisiae display the lowest differences, with the maximum
value of the difference being found for the CAG-CAG pair (27.798). For S. pombe and C. albicans that value reaches 100.639 for the CAA-CAA
codon pair. It is noteworthy that the highest difference value for the former pair is lower than the lowest value for the latter in this ranking of
context differences. The only codon pair shared between all three yeast pairs is shown in bold.
R28.10 Genome Biology 2005, Volume 6, Issue 3, Article R28 Moura et al. />Genome Biology 2005, 6:R28
Conclusions
The Anaconda algorithm was developed with the aim of stud-
ying codon-pair context on an ORFeome scale, define rules
that govern codon-pair context, carry out large-scale inter-
species codon-pair context comparisons and clarify the effect
of selection and mutational drift on codon-pair context. The
results provide important new insight on the role of codon-
pair context on mRNA decoding accuracy and efficiency, and
we expect that it will allow the development of reporter genes
for in vivo and in vitro quantification of codon-decoding
GC3 distribution in the complete ORFeome of S. cerevisiae and E. coli and its influence on the overall codon-pair context analysisFigure 9
GC3 distribution in the complete ORFeome of S. cerevisiae and E. coli and its influence on the overall codon-pair context analysis. In order to study the
role of mutational bias upon codon-pair context the ORFeomes of both (a,b) S. cerevisiae and (c,d) E. coli were distributed according to the %GC3 of
individual ORFs. The GC3 of the S. cerevisiae and E. coli ORFeomes varied between the intervals 11.9-76.7% and 20-89.4%, respectively. For S. cerevisiae,
however, most ORFs had a %GC3 between 35 and 40% (light blue bar in (a)), while for E. coli the majority of the ORFs have a %GC3 between 50 and 60%
(light blue bars in (c)). Determination of the codon-pair context for the low and high GC3 subgroups permitted identification of their context differences.
The computation of the number of residuals that changed their signal (for example, positive to negative) from one subgroup (low GC3) into the other
(high GC3) provided a quantitative measure of the role of GC3 on codon-pair context (red bars in (b) and (d)). For both S. cerevisiae and E. coli GC3 bias
has a strong effect on codon-pair context for weak residuals (-3 to +3), but no such effect was observed for contexts with the highest residuals (strong
context), indicating that GC3 bias is mainly felt in weak codon-pair contexts.
2000
1500
1000
500
0
2000
1000
Number of ORFs
-9
1200
800
400
0
1000
500
0
20
(c)
Adjusted residuals
E. coli
Low GC3
High GC3
Low GC3
High GC3
0
%GC3
(b)
(d)
S. cerevisiae
(a)
S. cerevisiae
E. coli
Number of contexts
Number of ORFs
Number of contexts
%GC3
Adjusted residuals
-3 3 9
30
40 50 60 70
80
-9 -3 3 9
20 30 40 50 60
Genome Biology 2005, Volume 6, Issue 3, Article R28 Moura et al. R28.11
comment reviews reports refereed researchdeposited research interactions information
Genome Biology 2005, 6:R28
error and translational speed. Finally, Anaconda will be a val-
uable tool to redesign ORFs for efficient and accurate heterol-
ogous or homologous protein expression in yeast and,
eventually, in other suitable host systems.
Materials and methods
Statistics
To study the association between contiguous codon-pairs, the
coding sequences analyzed by Anaconda are processed in a 64
× 64 contingency table subdivided in mutually exclusive cat-
egories. If the 3' context is being analyzed, the rows of the
table correspond to the codons in the P-site and the columns
to the codons in the A-site of the ribosome. At the 5' context
analysis the situation is inverted, and so the contingency table
built is a transposed version of the one for 3' analysis.
Table 4
GC3 influences codon-pair context
Residuals
ORFeome [- ∞, -9] [-9, -3] [-3, 3] [3, 9] [9, + ∞]
S. cerevisiae 0.0 2.5 94.2 3.3 0.0
E. coli 0.7 15.2 67.1 15.0 2.0
In order to measure the influence of GC bias on codon-pair context,
the percentage of adjusted residuals that reversed their residual signals
from positive to negative (or vice versa) between low and high GC3
subgroups of ORFs was determined. Most of the residual signal
inversions for both species considered fall within the nonstatistically
significant interval of the residuals (-3 to +3) indicating that GC3 bias is
mainly felt in codon-pairs where the association is very weak or
nonexistent (highlighted in bold).
Table 5
A hypothetical r × c contingency table
B
1
B
j
B
c
Marginal total
A
1
n
11
n
1j
n
1c
n
1
*
A
l
n
l1
n
ij
n
lc
n
1
*
A
r
n
r1
n
rl
n
rc
n
r
*
Marginal total n*
1
n*
i
n*
c
N
The table illustrates how contingency tables were constructed and how
the statistical methodologies described in methods were implemented.
One set of categories is represented by rows, the other by columns. In
the present case, if the 3' context is being analyzed by Anaconda the
rows of the table (A) correspond to the 5' codons and the columns (B)
to the 3' codons of each pair.
ORFs with low and high GC3 have different codon-pair contextsFigure 10
ORFs with low and high GC3 have different codon-pair contexts. To
highlight the effect of GC3 bias on codon-pair context, the context maps
for the subgroups of low GC3 and high GC3 ORFs of both S. cerevisiae and
E. coli were overlapped using the differential display codon-pair context
(DCM) tool. The DCM maps for S. cerevisiae and E. coli showed significant
differences (light blue cells in the DCMs), in particular in E. coli, indicating
that GC3 bias influences codon-pair context.
High GC3 codons
Low GC3 codons
E. coli
High GC3 codons
Low GC3 codons
S. cerevisiae
0 3 6 10 15 20 200
R28.12 Genome Biology 2005, Volume 6, Issue 3, Article R28 Moura et al. />Genome Biology 2005, 6:R28
A number of different mathematical methodologies have
already been used to study codon context bias (for example
[9,50-52]). In this study, the analysis of contingency tables
and residuals (Figure 3) was considered appropriate, assum-
ing a multinomial probabilistic model for the contingency
table (a detailed discussion of this model in the context of
genomic data can be found in [53]). In general, all these meth-
odologies are based on z-score-type tests and give informa-
tion about preference and rejection. Basically, those
methodologies differ in the probabilistic model assumed,
leading to statistics whose probability distribution is in most
cases unknown. The advantage of the methodology proposed
here is that its theory of inference is well known, yielding an
analysis that is more sequential, more easily interpretable
and with more complementary tools for analysis (for exam-
ple, measures of association). In other words, this methodol-
ogy was chosen because the adjusted residual values give
direct information about preference and rejection in relation
to what would be expected on a random basis. Furthermore,
the probability distribution under the hypothesis of inde-
pendence is determined without data simulations.
For analysis of contingency tables and residuals [22-25],
given an r × c contingency table where a multinomial distri-
bution is assumed (Table 5), the hypothesis of independence
between the variables A and B is tested using the Pearson's
statistic given by:
where:
It is known that Pearson's statistic has an asymptotical chi-
square probability distribution with (r - 1)(c - 1) degrees of
freedom. To identify cells in the table responsible for the
eventual rejections of independence, the adjusted residuals
d
ij
are calculated by:
where:
is the variance estimated for r
ij
. Haberman [54] has shown
that, under independence between A and B, the adjusted
residuals d
ij
have a standardized normal probability distribu-
tion, and therefore P(- 3 <d
ij
< 3) ≈ 0.9973, as N → + ∞. This
means that, for a 99,73% confidence level, the pair (A
i
, B
j
) is
considered responsible for rejection of the hypothesis of inde-
pendence if |d
ij
| ≥ 3. In practice, we consider that an adjusted
residual is statistically significant if its absolute value is
greater then 3.
Additionally, to find codon context patterns in the contin-
gency table, lines and columns can be grouped using classify-
ing methodologies such as cluster analysis. These patterns are
determined by calculating similarities between two vectors of
the contingency table using the centred Pearson correlation
coefficient and applying single linkage. The single-linkage
method produces groups with 'chaining effect': that is, any
element of a group is more 'similar' to an element of the same
group than to any element of another group.
Software
The architecture of the Anaconda software is based on three
main modules, namely data acquisition, processing and visu-
alization (Figure 1). Each module works independently from
the others and can easily be replaced or updated. Also, this
component-based approach allows for insertion of new mod-
ules or new tools in each module, such as new statistical
features.
The acquisition and processing modules download row data
from genome databases, create a local database of usable
ORFs and analyze the data using an algorithm that simulates
the ribosome during mRNA decoding. It finally constructs a
database containing the processed data. This data is then sub-
mitted to statistical analysis as described above. The visuali-
zation module allows the user to visualize the data matrices
and gene sequences and to create filters that permit searching
for specific sequence patterns defined by the user.
The data-acquisition module deals with genome input files,
namely reading and interpreting FASTA sequences of com-
plete or partial sets of ORFs from public or private genome
databases. To ensure that the screened sequences have the
best possible quality, and hence do not introduce background
noise in the following analyses, several quality filters are
applied to the reading process. When the filters are activated
the data are classified according to the following criteria.
Valid data consist of genes whose sequence is a multiple of
three; which start with an AUG codon and stop with a UAG,
UAA or UGA codon, and which satisfy other user-defined
requirements. Rejected data consist of genes whose sequence
does not fulfill the above requirements. The result is the sep-
aration of valid from rejected ORFs. Other parameters
needed by the application, such as reference relative synony-
mous codon usage (RSCU) values for codon adaptation index
(CAI) calculation [55], are also uploaded by this module.
The processing module is the core of the application, where
the codon context analysis is performed. After prescanning
χ
obs ij
j
c
i
r
r
22
11
=
==
∑∑
r
n
nn
N
nn
N
ij
ij
ij
ij
=
−
ii
ii
d
r
v
ij
ij
ij
=
v
n
N
n
N
ij
i
j
=−
−
11
i
i
Genome Biology 2005, Volume 6, Issue 3, Article R28 Moura et al. R28.13
comment reviews reports refereed researchdeposited research interactions information
Genome Biology 2005, 6:R28
the files, the user can test the existence of significant bias in
the codon context and use the residual values to further
explore the matrices of residual values (see Statistics, above).
The data generated are then converted into a contingency
table that includes the corresponding observed values of
Pearson's statistics, and the matrix of adjusted residuals [25].
After processing, the data become available to the visualiza-
tion module. This module is the graphical interface. It follows
the file manager paradigm in which information is presented
in hierarchical views. This module offers a set of tools that
enable several tasks to be carried out, namely to search pre-
specified sequence patterns, to visualize data in histogram
form, to cluster codon context data, and to export residual
values. It is also possible to visualize other information at the
gene level, such as rare codons and their distribution in the
ORFs, to determine their ratio relative to the total number of
codons, to determine the GC% at the first, second and third
codon positions and determine the codon adaptation index
(CAI) and the effective number of codons [55,56].
Acknowledgements
We thank FCT (Project: POCTI/BME/39030/2001), IEETA and the II-UA
(CTS-12) for supporting the development of the Anaconda software. G.M.
is funded by FCT grant SFRH/BPD/7195/2001 and M.P. by INFOGENMED
(FP-V). M.S. is supported by an EMBO YIP Award.
References
1. Sandman KK, Tardiff DF, Neely LA, Noren CJ: Revised Escherichia
coli selenocysteine insertion requirements determined by in
vivo screening of combinatorial libraries of SECIS variants.
Nucleic Acids Res 2003, 31:2234-2241.
2. Theobald-Dietrich A, Frugier M, Giege R, Rudinger-Thirion J: Atypi-
cal archaeal tRNA pyrrolysine transcript behaves towards
EF-Tu as a typical elongator tRNA. Nucleic Acids Res 2004,
32:1091-1096.
3. Thomas LK, Dix DB, Thompson RC: Codon choice and gene
expression: synonymous codons differ in their ability to
direct aminoacylated-transfer RNA binding to ribosomes in
vitro. Proc Natl Acad Sci USA 1988, 85:4242-4246.
4. Ikemura T: Correlation between the abundance of yeast
transfer RNAs and the occurrence of the respective codons
in protein genes. Differences in synonymous codon choice
patterns of yeast and Escherichia coli with reference to the
abundance of isoaccepting transfer RNAs. J Mol Biol 1982,
158:573-597.
5. Carlini DB, Stephan W: In vivo introduction of unpreferred syn-
onymous codons into the Drosophila Adh gene results in
reduced levels of ADH protein. Genetics 2003, 163:239-243.
6. Elf J, Nilsson D, Tenson T, Ehrenberg M: Selective charging of
tRNA isoacceptors explains patterns of codon usage. Science
2003, 300:1718-1722.
7. Akashi H: Synonymous codon usage in Drosophila mela-
nogaster : natural selection and transational accuracy. Genetics
1994, 136:927-935.
8. Berg OG, Silva PJ: Codon bias in Escherichia coli : the influence
of codon context on mutation and selection. Nucleic Acids Res
1997, 25:1397-1404.
9. Fedorov A, Saxonov S, Gilbert W: Regularities of context-
dependent codon bias in eukaryotic genes. Nucleic Acids Res
2002, 30:1192-1197.
10. McVean GAT, Hurst GDD: Evolutionary lability of context-
dependent codon bias in bacteria. J Mol Evol 2000, 50:264-275.
11. Duret L: tRNA gene number and codon usage in the C. elegans
genome are co-adapted for optimal translation of highly
expressed genes. Trends Genet 2000, 16:287-289.
12. Ikemura T: Codon usage and tRNA content in unicellular and
multicellular organisms. Mol Biol Evol 1985, 2:13-34.
13. Moriyama EN, Powell JR: Codon usage bias and tRNA
abundance in Drosophila. J Mol Evol 1997, 45:514-523.
14. Irwin B, Heck JD, Hatfield GW: Codon pair utilization biases
influence translational elongation step times. J Biol Chem 1995,
270:22801-22806.
15. Parker J: Errors and alternatives in reading the universal
genetic code. Microbiol Rev 1989, 53:273-298.
16. Precup J, Parker J: Missense misreading of asparagine codons as
a function of codon identity and context. J Biol Chem 1987,
262:11351-11355.
17. Precup J, Ulrich AK, Roopnarine O, Parker J: Context specific mis-
reading of phenylalanine codons. Mol Gen Genet 1989,
218:397-401.
18. Curran JF, Poole ES, Tate WP, Gross BL: Selection of aminoacyl-
tRNAs at sense codons: the size of the tRNA variable loop
determines whether the immediate 3' nucleotide to the
codon has a context effect. Nucleic Acids Res 1995, 23:4104-4108.
19. Shpaer EG: Constrains on codon context in Escherichia coli
genes. Their possible role in modulating the efficiency of
translation. J Mol Biol 1986, 188:555-564.
20. Gutman GA, Hatfield GW: Nonrandom utilization of codon
pairs in Escherichia coli. Proc Natl Acad Sci USA 1989, 86:3699-3703.
21. Functional Evolutionary Genomics Laboratory: University of
Aveiro. [ />22. Bishop YMM, Fienberg SE, Holland PW: Discrete Multivariate
Analysis. Theory and Practice Cambridge. UK: MIT Press 1975.
23. Everitt BS: The Analysis of Contingency Tables. New York: John
Wiley and Sons 1997.
24. Sheskin DJ: Parametric and Nonparametric Statistical
Procedures. London: Chapman & Hall/CRC 2000.
25. Agresti A: Categorical Data Analysis. New York: Wiley 2002.
26. Saccharomyces Genome Database. [stge
nome.org]
27. Everitt BS: Cluster Analysis. New York: Arnold 1998.
28. Nussinov R: Doublet frequencies in evolutionary distinct
groups. Nucleic Acids Res 1984, 12:1749-1763.
29. Massey SE, Moura G, Beltrao P, Almeida R, Garey JR, Tuite MF, Santos
MAS: Comparative evolutionary genomics unveils the molec-
ular mechanism of reassignment of the CTG codon in Cand-
ida spp. Genome Res 2003, 13:544-557.
30. Freudenreich CH, Kantrow SM, Zakian VA: Expansion and length-
dependent fragility of CTG repeats in yeast. Science 1998,
279:853-856.
31. Sueoka N: Translation-coupled violation of parity rule 2 in
human genes is not the cause of heterogeneity of the DNA
G+C content of third codon position. Gene 1999, 238:53-58.
32. Fulgsang A: Patterns of context-dependent codon biases. Bio-
chem Biophys Res Commun 2003, 304:86-90.
33. Gouy M: Codon contexts in enterobacterial and coliphage
genes. Mol Biol Evol 1987, 4:426-444.
34. Yarus M, Folley LS: Sense codons are found in specific contexts.
J Mol Biol 1985, 182:529-540.
35. Buckingham RH: Codon context and protein synthesis:
enhancements of the genetic code. Biochimie 1994, 76:351-354.
36. Carrier MJ, Buckingham RH: An effect of codon context on the
mistranslation of UGU codons in vitro. J Mol Biol 1984,
175:29-38.
37. Murgola EJ, Pagel FT, Hijazi KA: Codon context effects in mis-
sense suppression. J Mol Biol 1984, 175:19-27.
38. Dix DB, Thompson RC: Codon choice and gene expression:
synonymous codons differ in translational accuracy. Proc Natl
Acad Sci USA 1989, 86:6888-6892.
39. Chen SL, Lee W, Hottes AK, Shapiro L, McAdams HH: Codon
usage between genomes is constrained by genome-wide
mutational processes. Proc Natl Acad Sci USA 2004,
101:3480-3485.
40. Eyre-Walker A: Synonymous codon bias is related to gene
length in Escherichia coli : selection for translational
accuracy? Mol Biol Evol 1996, 13:864-872.
41. Duan J, Antezana MA: Mammalian mutation pressure, synony-
mous codon choice, and mRNA degradation. J Mol Evol 2003,
57:694-701.
42. Akashi H: Codon bias evolution in Drosophila. Population
genetics of mutation-selection drift. Gene 1997, 205:269-278.
43. Sueoka N, Kawanishi Y: DNA G + C content of the third codon
position and codon usage biases of human genes. Gene
R28.14 Genome Biology 2005, Volume 6, Issue 3, Article R28 Moura et al. />Genome Biology 2005, 6:R28
2000:53-62.
44. Lobry JR, Sueoka N: Asymmetric directional mutation pres-
sures in bacteria. Genome Biol 2002, 3:research0058.1-0058.14.
45. Knight RD, Freeland SJ, Landweber LF: A simple model based on
mutation and selection explains trends in codon and amino-
acid usage and GC composition within and across genomes.
Genome Biol 2001, 2:research0010.1-100.13.
46. Osawa S, Jukes TH: On codon reassignment. J Mol Evol 1995,
41:247-249.
47. Knight RD, Freeland SJ, Landweber LF: Rewiring the keyboard:
evolvability of the genetic code. Nat Rev Genet 2001, 2:49-58.
48. McHardy AC, Puhler A, Kalinowski J, Meyer F: Comparing expres-
sion level-dependent features in codon usage with protein
abundance: an analysis of 'predictive proteomics'. Proteomics
2004, 4:46-58.
49. Cohen B, Skiena S: Natural selection and algorithmic design of
mRNA. J Comput Biol 2003, 10:419-432.
50. Boycheva S, Chkodrov G, Ivanov I: Codon pairs in the genome of
Escherichia coli. Bioinformatics 2003, 19:987-998.
51. Shah AA, Giddings MC, Gesteland RF, Atkins JF, Ivanov IP: Compu-
tational identification of putative programmed translational
frameshift sites. Bioinformatics 2002, 18:1046-1053.
52. Hooper SD, Berg OG: Detection of genes with atypical
nucleotide sequence in microbial genomes. J Mol Evol 2002,
54:365-375.
53. Avery PJ, Henderson DA: Fitting Markov chain models to dis-
crete state series such as DNA sequences. Appl Statist 1999,
48:53-61.
54. Haberman SJ: Analysis of residuals in cross-classified tables. Bio-
metrics 1973, 29:205-220.
55. Sharp PM, Li WH: The codon adaptation index - a measure of
directional synonymous codon usage bias, and its potential
applications. Nucleic Acids Res 1987, 15:1281-1295.
56. Wright F: The 'effective number of codons' used in a gene.
Gene 1990, 87:23-29.