Báo cáo y học: "Tiling microarray analysis of rice chromosome 10 to identify the transcriptome and relate its expression to chromosomal architecture" pptx
Bạn đang xem bản rút gọn của tài liệu. Xem và tải ngay bản đầy đủ của tài liệu tại đây (1.95 MB, 17 trang )
Genome Biology 2005, 6:R52
comment reviews reports deposited research refereed research interactions information
Open Access
2005Liet al.Volume 6, Issue 6, Article R52
Research
Tiling microarray analysis of rice chromosome 10 to identify the
transcriptome and relate its expression to chromosomal
architecture
Lei Li
¤
*
, Xiangfeng Wang
¤
†‡§
, Mian Xia
¶
, Viktor Stolc
*¥
, Ning Su
*
,
Zhiyu Peng
†
, Songgang Li
‡
, Jun Wang
§
, Xiping Wang
¶
and
Xing Wang Deng
*
Addresses:
*
Department of Molecular, Cellular, and Developmental Biology, Yale University, New Haven, CT 06520, USA.
†
National Institute
of Biological Sciences, Zhongguancun Life Science Park, Beijing 102206, China.
‡
Peking-Yale Joint Research Center of Plant Molecular Genetics
and Agrobiotechnology, College of Life Sciences, Peking University, Beijing 100871, China.
§
Beijing Institute of Genomics, Chinese Academy of
Sciences, Beijing 101300, China.
¶
National Center of Crop Design, China Bioway Biotech Group Co., LTD, Beijing 100085, China.
¥
Genome
Research Facility, NASA Ames Research Center, MS 239-11, Moffett Field, CA 94035, USA.
¤ These authors contributed equally to this work.
Correspondence: Xing Wang Deng. E-mail:
© 2005 Li et al.; licensee BioMed Central Ltd.
This is an Open Access article distributed under the terms of the Creative Commons Attribution License (
which permits unrestricted use, distribution, and reproduction in any medium, provided the original work is properly cited.
Tiling microarray analysis of rice chromosome 10<p>A transcriptome analysis of chromosome 10 of 2 rice subspecies identifies 549 new gene models and gives experimental evidence for around 75% of the previously unsupported predicted genes. </p>
Abstract
Background: Sequencing and annotation of the genome of rice (Oryza sativa) have generated gene models in
numbers that top all other fully sequenced species, with many lacking recognizable sequence homology to known
genes. Experimental evaluation of these gene models and identification of new models will facilitate rice genome
annotation and the application of this knowledge to other more complex cereal genomes.
Results: We report here an analysis of the chromosome 10 transcriptome of the two major rice subspecies,
japonica and indica, using oligonucleotide tiling microarrays. This analysis detected expression of approximately
three-quarters of the gene models without previous experimental evidence in both subspecies. Cloning and
sequence analysis of the previously unsupported models suggests that the predicted gene structure of nearly half
of those models needs improvement. Coupled with comparative gene model mapping, the tiling microarray
analysis identified 549 new models for the japonica chromosome, representing an 18% increase in the annotated
protein-coding capacity. Furthermore, an asymmetric distribution of genome elements along the chromosome
was found that coincides with the cytological definition of the heterochromatin and euchromatin domains. The
heterochromatin domain appears to associate with distinct chromosome level transcriptional activities under
normal and stress conditions.
Conclusion: These results demonstrated the utility of genome tiling microarrays in evaluating annotated rice gene
models and in identifying novel transcriptional units. The tiling microarray analysis further revealed a chromosome-
wide transcription pattern that suggests a role for transposable element-enriched heterochromatin in shaping
global transcription in response to environmental changes in rice.
Published: 27 May 2005
Genome Biology 2005, 6:R52 (doi:10.1186/gb-2005-6-6-r52)
Received: 14 January 2005
Revised: 1 April 2005
Accepted: 25 April 2005
The electronic version of this article is the complete one and can be
found online at />R52.2 Genome Biology 2005, Volume 6, Issue 6, Article R52 Li et al. />Genome Biology 2005, 6:R52
Background
As one of the most important crop species in the world and a
model for the Gramineae family, rice (Oryza sativa) was
selected as the first monocotyledonous plant to have its
genome completely sequenced. Draft genome sequences of
the two major subspecies of rice, indica and japonica, were
made available in 2002 [1,2]. These were followed by the
advanced sequences of japonica chromosomes 1, 4 and 10 [3-
5]. The finish-quality whole-genome sequences of indica and
japonica have recently been obtained [6-8].
Available rice sequences have been subjected to extensive
annotation using ab initio gene prediction, comparative
genomics, and a variety of other methods. These analyses
revealed abundant compositional and structural features of
the predicted rice genes that deviate from genes in other
model organisms. For example, distinctive negative gradients
of GC content, codon usage, and amino-acid usage along the
direction of transcription were observed in many rice gene
models [2,9]. On the other hand, many predicted rice genes
that lack significant homology to genes in other organisms
also exhibit characteristics such as unusual GC composition
and distribution, suggesting that they might not be true genes
[10,11]. Furthermore, the abundance and diversity of trans-
posable elements (TEs) within the rice genome that possess a
coding capacity pose an additional challenge to accurate
annotation of the rice genome [10,12,13].
As such, our understanding of the rice genome is largely lim-
ited to the state-of-the-art gene prediction and annotation
programs. This is probably best reflected by the lack of a con-
sensus of the estimation of the total gene number in rice [6-
8,10,11]. Estimated total gene number based on the draft
sequences of japonica and indica ranged widely from 30,000
to 60,000 [1,2]. Finished sequences of chromosome 1, 4 and
10 allowed a more finely tuned estimate that placed the total
number of rice genes between 57,000 and 62,500 [3-5].
These estimates included a large number of gene models that
contain TE-related open reading frames (ORFs). Excluding
the TE-related ORFs could reduce the gene number to about
45,000 [6-8]. Even then, between one third and one half of
the predicted genes appear to have no recognizable homologs
in the other model plant Arabidopsis thaliana [6-8]. Further,
aggressive manual annotations of portions of the finished rice
sequence have disqualified many of the low-homology gene
models as TE-related or artifacts, arguing that there are no
more than 40,000 nonredundant genes in rice [10].
Experimental evidence such as full-length cDNA sequences
and expressed sequence tags (ESTs) is critical for evaluation
and improvement of the genome annotation [14-16]. Large
collections of rice full-length cDNA and ESTs are available
[15,17]; however, given the large number of rice genes, cur-
rent methods for collecting expressed sequences do not pro-
vide the necessary depth of coverage. For example, based on
high-stringency alignments to EST sequences available at
that time, only 24.7% of the 3,471 initially predicted genes of
chromosome 10 were matched [5]. Conversely, other experi-
ment-oriented approaches, such as massively parallel signa-
ture sequencing [18], are able to provide sufficient coverage of
the transcriptome but by their nature are limited in their abil-
ity to define gene structures. Thus, it is important to survey
the transcriptome using additional experimental means that
permit detailed analyses of current gene models and the iden-
tification of new models.
Recent studies in several model organisms have demon-
strated the utility of tiling microarrays in transcriptome iden-
tification [19-27]. Armed with new microarray technologies,
it is now possible to prepare high-density oligonucleotide til-
ing microarrays to interrogate genomic sequences irrespec-
tive of their annotations. Consequently, results from these
studies indicate that a significant portion of the transcrip-
tome resides outside the predicted coding regions [19-
21,24,25]. In addition, these studies show that tiling microar-
rays are able to improve or correct the predicted gene struc-
tures [19,23,26]. Based on considerations of feature density,
versatility of modification, and compatibility with our exist-
ing conventional microarray facility, the maskless array syn-
thesizer (MAS) platform [24,26,28,29] was chosen for our
rice transcriptome analysis.
Here we report the construction and analysis of two inde-
pendent sets of custom high-density oligonucleotide tiling
microarrays with unique 36-mer probe sequences tiled
throughout the nonrepetitive sequences of chromosome 10
for both japonica and indica rice. Hybridized with a mixed
pool of cDNA targets, these tiling microarrays detected over
80% of the annotated nonredundant gene models in both
japonica and indica, and identified a large number of tran-
scriptionally active intergenic regions. These results, coupled
with comparative gene model mapping and reverse transcrip-
tion PCR (RT-PCR) analysis, allowed the first comprehensive
identification and analysis of a rice chromosomal transcrip-
tome. These results further revealed an association of chro-
mosome 10 transcriptome regulation with the euchromatin-
heterochromatin organization at the chromosomal level.
Results
Rice chromosome 10 oligonucleotide tiling
microarrays
Based on recent studies using MAS oligonucleotide tiling
microarrays to obtain gene expression and structure informa-
tion [24,26,28,29], we designed two independent sets of 36-
mer probes, with 10-nucleotide intervals, tiled throughout
both strands of japonica and indica chromosome 10, respec-
tively. After filtering out those probes that represent
sequences with a high copy number or a high degree of com-
plementarity, 750,282 and 838,816 probes were retained to
interrogate the entire nonrepetitive sequences of japonica
and indica chromosome 10 and were synthesized in two sets
Genome Biology 2005, Volume 6, Issue 6, Article R52 Li et al. R52.3
comment reviews reports refereed researchdeposited research interactions information
Genome Biology 2005, 6:R52
of MAS microarrays [24,26,29]. The arrays were hybridized
with target cDNA prepared from equal amounts of four
selected poly(A)
+
RNA populations (the N Arrays), namely,
seedling roots, seedling shoots, panicles, and suspension cul-
tured cells of the respective rice subspecies. In addition, a set
of japonica arrays was hybridized to shoot poly(A)
+
RNA
derived from seedlings with a mineral/nutrient disturbance
(the S Arrays).
Our MAS microarrays utilize a 'chessboard' design, meaning
that each positive feature, which contains an interrogating
probe, is surrounded by four negative features and vice versa
[24,26]. Given that both positive and negative features con-
tain a linker oligo to which the interrogating probes were syn-
thesized, it was possible to determine signal probes (those
that detect an RNA target) using a two-step procedure. After
normalization (Figure 1a,b), positive features with fluores-
cence intensities lower than the mean intensity of the four
surrounding negative features were masked. A characteristic
bimodal intensity distribution of the remaining positive fea-
tures was observed for each microarray (Figure 1c). Based on
a statistical model to reject noise probes at a 90% confidence
(see Materials and methods), signal probes and their normal-
ized fluorescence intensities were determined (Figure 1c).
Signal probes were correlated with the transcriptionally
active regions (TARs) of the chromosome by alignment of the
probes to the chromosomal coordinates (Figure 2). Experi-
mental identification of the transcriptome was then achieved
by systematically examining the expression of the annotated
gene models and screening for intergenic TARs.
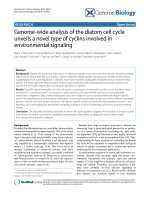
Processing the rice chromosome 10 tiling microarray hybridization dataFigure 1
Processing the rice chromosome 10 tiling microarray hybridization data. (a) Distribution of fluorescence intensity of all positive and negative features of
the four indica N Arrays. (b) All eight distributions were scaled to have a uniform intensity peak value at 8 (log
2
). (c) Mathematic model for determination
of signal probes. A bimodal distribution of log
2
background-adjusted intensity of all positive features is used to model the noise as a normal distribution by
mirroring the distribution of low intensity (< 6 of log
2
). A cutoff value corresponding to a 90% confidence level to reject noise probes according to the
modeled noise distribution is indicated. (d) Distribution of hybridization rate in the exonic and intronic regions of rice chromosome 10. Hybridization rate
(HR) is calculated as the ratio of the number of signal probes against the total number of interrogating probes per kilobase of sequence.
1.5
18,766
18,740
18,826
18,730
18,766
18,740
18,826
18,730
BGI indica Exon
BGI indica Intron
BGI japonica Exon
BGI japonica Intron
TIGR japonica Exon
TIGR japonica Intron
1.0
0.5
5000
4000
3000
2000
1000
0.0
7
0246
noise
signal
cutoff
810
0.0 0.2 0.4 0.6 0.8 1.0
12
8
Density of featuresNumber of features
Density
1.5
1.0
0.5
0.0
20
15
10
5
0
Density of features
9
Log
2
(intensity)
Log
2
(intensity) HR
10 11 7 8 9
Log
2
(intensity)
10 11
(a) (b)
(c) (d)
R52.4 Genome Biology 2005, Volume 6, Issue 6, Article R52 Li et al. />Genome Biology 2005, 6:R52
Rice chromosome 10 gene models
Finished sequences have been determined for both japonica
and indica chromosome 10 [5-8]. Initial annotation of
japonica chromosome 10 produced 3,471 protein-coding
gene models [5], which was updated to 3,856 in the release 2
of the Rice Pseudomolecules from The Institute for Genomic
Research (TIGR) [8]. Of these, 829 (21.5%) were found to be
TE-related models. Eight gene models were mapped to other
chromosomes, and were not included in this study. Classifica-
tion of the 3,019 nonredundant protein-coding gene models
was based on alignments to the rice full-length cDNA and
ESTs [15,17]. These analyses led to the identification of 935
(31.0%) cDNA-supported gene (CG) and 321 (10.6%) EST-
supported gene (EG) models. The remaining 1763 (58.4%)
models were classified as unsupported gene (UG) models.
This model set is designated TIGR japonica (Table 1, Figure 2
and see Additional data file 1).
For comparison, the so-called BGI japonica gene models
were included, whereby the japonica chromosome 10
sequence was independently annotated by the Beijing
Genomics Institute (BGI) [6,30]. This model set, generated
by the FGENESH output with limited full-length cDNA/EST
input, contains 851 TE, 943 CG, 272 EG, and 1,549 UG models
(Table 1, Figure 2). To analyze the indica chromosome 10
transcriptome, and for comparative analysis, the BGI indica
models were also examined [2,6,30]. Classification of the
indica models identified 574 TE, 821 CG, 328 EG, and 1,660
UG models (Table 1, Figure 2 and see Additional data file 2).
Tiling microarray detection of rice chromosome 10
gene models
Analysis of the N arrays detected 2,428 out of 2,809 BGI
indica (86.4%), 2,319 out of 2,764 BGI japonica (83.9%), and
2,472 out of 3,019 TIGR japonica (81.9%) nonredundant
gene models (Table 1). Although no technical replication was
performed, several observations indicate that tiling microar-
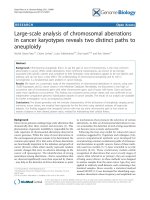
Tiling microarray analysis of the rice chromosome 10 transcriptomeFigure 2
Tiling microarray analysis of the rice chromosome 10 transcriptome. (a) Schematic representation of rice chromosome 10. The purple oval denotes the
centromere. (b) A region from the long arm of chromosome 10 displaying the three sets of gene models used: BGI indica; TIGR japonica and BGI japonica.
The nonredundant protein-coding gene models are aligned to the chromosomal sequences and color-coded on the basis of their classification (see text).
(c) Detailed tiling profile of one representative CG model. The model is represented here as block arrows, which point in the direction of transcription.
Signal oligos are aligned according to their chromosomal coordinates. The fluorescence intensity value of each signal oligo, capped at 2,500, is depicted as
a vertical bar. The shade of the bar represents the oligo index score (see Materials and methods). The red blocks underneath the bars indicate the
presence of an interrogating oligo in the microarray.
Chromosome 10 Centromere
CG EG UG
BGI indica
BGI indica
TIGR japonica
TIGR japonica
BGI japonica
BGI japonica
AK107314
9638.m02217
AK107314
Oligo index
12345
(a)
(b)
(c)
Genome Biology 2005, Volume 6, Issue 6, Article R52 Li et al. R52.5
comment reviews reports refereed researchdeposited research interactions information
Genome Biology 2005, 6:R52
ray analysis provides a reliable evaluation of the expression of
the gene models. First, consistent with their classification,
gene models with previous experimental support (CG and
EG) showed a higher detection rate than the unsupported
models (Table 1). For example, 93.2% and 90.7% of the TIGR
japonica CG and EG models were detected, respectively,
whereas only 74.3% of the UG models were (Table 1). Second,
supported models (CG and EG) exhibited very similar array
detection rates across the three sets of gene models. Because
the same cDNA and ESTs were used to classify the three sets
of gene models, this result implies a strong correlation
between tiling microarray detection and expressed
sequences. In supporting of this conclusion, TIGR japonica
models with at least one match with rice EST sequences
exhibited a 92.7% (1,010 of 1,089) detection rate whereas only
75.7% (1,458 of 1,925) models without a matching EST were
detected. Third, examination of signal probe distribution,
measured by hybridization rate (HR, see Materials and meth-
ods), in the annotated exonic and intronic regions indicates
that the tiling microarrays detected transcription predomi-
nantly locate in the exons. Across the three annotations, the
HRs of both the intronic regions (dashed lines) and exonic
regions (solid lines) showed bimodal distributions, with their
respective major peaks well separated (Figure 1d). The minor
intronic HR peak likely reflects transcriptional activities of
exons misidentified as introns or in uncharacterized splice
variants. Conversely, the minor exonic HR peak is likely to be
due to misinterpretation of introns as exons, or exons or
genes not expressed at all in the RNA populations used (Fig-
ure 1d).
Analysis of previously unsupported gene models
The relatively poor detection rate for the unsupported models
suggests that their expression may be more restricted to spe-
cific cell types or developmental stages, thus eluding tiling
array detection. Alternatively, some of these UG models
might be false and do not represent real genes. For further
analysis, gene models were classified as high homology (HH)
and low homology (LH) models based on comparison using
an expect value of e
-7
for predicted protein homology between
rice and Arabidopsis [6]. It should be noted that the simple
sequence alignment is likely to fail to detect some structural
homology. However, this simple division is useful for separat-
ing two groups of gene models for expression comparison.
For example, in the BGI japonica annotation, there are 589
UG/HH and 960 UG/LH models. By comparison, our tiling
microarray detected 495 (84.0%) UG/HH models, but only
707 (73.7%) UG/LH models. Because the UG/LH models lack
any previous supporting evidence (either homology or
expression), concerns have been raised as to whether they
represent real genes [10,11]; therefore, the expression proper-
ties of the UG/LH models are of particular interest for further
evaluation.
To investigate the possibility that expression of some UG/LH
models is restricted to special conditions, we analyzed the S
Arrays with regard to UG model expression. Of the gene mod-
els in the BGI japonica annotation, 63.4% were detected in
seedling shoots under a variety of stress conditions that are
known to significantly alter gene expression profiles [31,32].
These included 39 (2 CG/HH, 2 EG/HH, 8 UG/HH, 2 CG/
LH, 2 EG/LH and 23 UG/LH) models that eluded detection
by the N Arrays. The enrichment of UG/LH models in S
Arrays-specific models indicates that some UG/LH models
indeed have specialized expression. Though it is entirely pos-
sible that additional UG/LH models could be detected under
other stress conditions, the small number of UG/LH models
specifically detected from the S Arrays (23 of 960, or 2.4%)
suggests that specialized expression of UG/LH models alone
may not account for the overall low detection rate of the UG/
LH models.
In a separate approach to verify UG model annotation, 589
UG models were randomly selected for a high throughput RT-
PCR analysis. Overall, 196 (33.3%) of the selected UG models
were cloned and sequence-confirmed from the same RNA
samples used for the N Arrays (Figure 3a and Additional data
file 3). Given that only 62% (49/79) of CG models were suc-
cessfully cloned and sequence-confirmed in a control experi-
ment, these results suggest that expression of approximately
half (33% over 62%) of the UG models can be confirmed in
our experimental conditions. Closer inspection of the con-
firmed UG transcripts showed that only 102 (52%) contain an
identical ORF as predicted, whilst 94 (48%) exhibit different
ORFs compared to the predictions (Figure 3a,c), suggesting
that the gene structure of about half of the UG models need to
be corrected or improved. Since the tiling microarrays used in
this study have limited ability to pinpoint precise intron-exon
junctions, transcript cloning and sequence analysis are still
required to verify the annotated gene structures.
Identification and analysis of intergenic TARs
We found that 10.26% and 11.75% of the probes in the
japonica and indica N Arrays were considered signal probes,
respectively (Figure 1c). Approximately 55% and 15% of these
signal probes were found to locate in the intergenic and
intronic regions, respectively, of the TIGR japonica, BGI
japonica, and BGI indica annotations. These results indicate
that, irrespective of different annotations, significant tran-
scriptional activities locate in the annotated intergenic
regions. A sliding-window-based approach was used to sys-
tematically identify intergenic TARs (see Materials and meth-
ods). Through this analysis, 574 and 522 intergenic TARs in
indica and japonica were identified from the N Arrays,
respectively. In addition, 466 unique intergenic TARs were
identified from the S Arrays, bringing the total number of
japonica intergenic TARs to 988. These TARs have a cumula-
tive length of approximately 700 Kb or 3% of the chromo-
some. The average length of the intergenic TARs was about
700 bp (Figure 4a and Additional data file 4).
R52.6 Genome Biology 2005, Volume 6, Issue 6, Article R52 Li et al. />Genome Biology 2005, 6:R52
Several lines of evidence support the idea that the majority of
intergenic TARs represent legitimate elements of the rice
transcriptome. Sequence analysis revealed that 301 (55.0%)
indica and 455 (46.0%) japonica intergenic TARs possess a
significant coding capacity (more than 50 amino acids).
Selected intergenic TARs were used as probes in RNA gel-blot
analysis to confirm expression of these TARs. Overall, 26 out
of 34 probes detected a discrete band, with tissue specificity,
whereas the rest failed to detect any, suggesting that the
majority of the intergenic TARs correspond to in vivo tran-
scripts rather than being caused by cross hybridization (Fig-
ure 4b-d). A total of 280 intergenic TARs were selected for
further analysis using an RT-PCR strategy designed to clone
transcripts containing an intergenic TAR and its entire down-
stream (3') sequence (see Materials and methods and Addi-
tional data file 5). Of the 77 cloned transcripts whose
sequences could be unambiguously confirmed, 37 overlap
with existing gene models (Figure 3b,d), suggesting they are
uncharacterized portions, such as 5' or 3' untranslated
regions (UTRs), or splice variants of the neighboring gene
models. The rest of the confirmed transcripts (40 out of 77)
were located entirely in intergenic regions, suggesting that
they likely represent independent novel transcriptional units
(Figure 3b,d).
Table 1
Classification and array detection of rice chromosome 10 gene models
Annotation Nonredundant protein-coding gene model TE
Type Annotated Detected Percentage
BGI indica CG 821 784 95.5%
EG 328 290 88.4%
UG 1,660 1,354 81.6%
Total 2,809 2,428 86.4% 574
BGI japonica CG 943 879 93.2%
EG 272 238 87.5%
UG 1,549 1,202 77.6%
Total 2,764 2,319 83.9% 851
TIGR japonica CG 935 871 93.2%
EG 321 291 90.7%
UG 1,763 1,310 74.3%
Total 3,019 2,472 81.9% 829
Rice chromosome 10 protein-coding gene models were divided into TE and nonredundant models based on available annotations. Because of their
repetitiveness, expression of TE models was not assessed. The nonredundant models were further divided into CG, EG and UG models based on
their alignment to rice full-length cDNAs and ESTs and their expression assessed by tiling microarray analysis.
Cloning and sequence analysis of japonica chromosome 10 UG models and intergenic TARsFigure 3 (see following page)
Cloning and sequence analysis of japonica chromosome 10 UG models and intergenic TARs. (a) Summary of RT-PCR analysis of selected UG models. ORF
identical, annotated ORF is the same as determined from the cloned sequence; ORF different, annotated ORF is different from that in the cloned
sequence. (b) Summary of RT-PCR analysis of selected intergenic TARs. Gene model, cloned TARs overlapping with TIGR models; BGF prediction, cloned
TARs overlapping with BGF predictions; unique, cloned TARs not overlapping with any annotated feature. (c) Representative UG models whose cloned
sequences either differ from (OsJN02936) or are the same as (OsJN03072) the annotated ones. (d) Representative intergenic TARs whose cloned
sequences either overlap with a TIGR model (OsJN01855) or are completely intergenic (C10_ZN376). Representation of microarray data in this figure is
the same as in Figure 2 except that the oligo index is omitted.
Genome Biology 2005, Volume 6, Issue 6, Article R52 Li et al. R52.7
comment reviews reports refereed researchdeposited research interactions information
Genome Biology 2005, 6:R52
Figure 3 (see legend on previous page)
(a) (b)
(c)
(d)
102
94
17
23
37
ORF different
ORF identical
UG models Intergenic TARs
Gene model
BGF prediction
Unique
Cloned
Annotated
Signal
oligo
Cloned
Annotated
Signal
oligo
Cloned
Signal
oligo
Model OsJN02936 Model OsJN03072
Model OsJN01855
C10_ZN376
TA R
TA R
R52.8 Genome Biology 2005, Volume 6, Issue 6, Article R52 Li et al. />Genome Biology 2005, 6:R52
To further characterize the 988 japonica intergenic TARs,
they were aligned to the output of the rice gene finder BGF
[2,6,30] using the japonica chromosome 10 sequence, and 72
novel gene models were identified (Additional data file 1).
Comparison with the cloned intergenic TARs showed that 23
of the 40 cloned novel transcripts (57.5%) were also predicted
in the novel BGF models (Figure 3b), indicating that the BGF
program was able to detect half of the potential novel genes
represented by the intergenic TARs. However, the incomplete
nature of the 17 unaccounted transcripts (Figure 3b) made it
difficult to unambiguously determine whether they encode
proteins.
Tiling microarray-based gene model comparison and
integration
The TIGR model set contained 200-250 more gene models
than the BGI sets (Table 1). These extra models were evenly
distributed into HH and LH models (Figure 5a). The TIGR/
HH models showed a similar array-detection rate, while the
TIGR/LH models were detected at a lower rate (but of a sim-
ilar number) in comparison with the two BGI sets (Figure 5a).
This result suggests that the extra TIGR/LH models may be of
low confidence and need to be further examined. Comparison
of the BGI and TIGR japonica models indicates that there
were 2323 (84.0%) and 2488 (82.4%) common to each anno-
tation, respectively, based on ORF sequence overlaps (Addi-
tional data file 6). Meanwhile, 441 (16.1%) BGI models and
531 (17.6%) TIGR models were regarded as unique to each
annotation (Additional data file 6). Naturally, the common
models are more reliable, and were consequently enriched
with expression- or homology-supported models. For exam-
ple, only 64.5% of the unique TIGR models were detected by
tiling microarrays. However, expression of 363 of the unique
BGI models was confirmed by tiling array and/or cDNA and
EST alignment, indicating that they are part of the japonica
chromosome 10 transcriptome (Figure 5b).
The indica gene models were more evenly distributed along
the chromosome, and the number and distribution of array-
detected models was similar to that of japonica (Figure 6a-c).
Exceptions were noted in certain regions, such as at
approximately10 Mb, where indica models showed increased
array detection rates. Such a disparity is likely to be caused by
the skewed distance between corresponding japonica/indica
model pairs (see below). Comparative gene model mapping
indicates that 97.6% of the japonica chromosome10 CG/HH
models had their counterparts in indica, while 98.3% of the
indica CG/HH models were mapped to japonica (Additional
data file 6 and data not shown). As the full-length cDNAs were
derived from japonica [15], this result suggests that roughly
2% of either genome sequence was erroneous or incomplete,
thereby disrupting the integrity of the affected genes such
that they could not be recognized. However, only 85.3% and
88.1% of japonica and indica UG/LH models could be
mapped to their reciprocal genomes. These results indicate
that the unmapped UG models between japonica and indica
were common but not recognized in the reciprocal genomes,
or subspecies specific, or false predictions. Thus,
identification of the first group of models would facilitate a
better recognition of the transcriptome of both genomes.
Indeed, 2,640 indica models were mapped to japonica chro-
mosome 10 (Additional data file 7). Among those mapped
indica models, 114 were detected by tiling array, with corre-
sponding genome sequences that were more than 95% identi-
cal to that of japonica chromosome 10, but were not
annotated in japonica. These results suggest that the counter-
parts of these 114 indica models may exist in the japonica
chromosome 10 transcriptome (Figure 5b).
To provide a comprehensive representation of the japonica
chromosome 10 transcriptome, the 549 new models, includ-
ing 363 BGI japonica models, 114 BGI indica models, and 72
novel BGF models (see above), were integrated with the TIGR
japonica gene models (Figure 5b). The resulting 3,568
nonredundant protein-coding gene models, including the
3,019 TIGR models, represent an 18% increase in the anno-
tated coding capacity of japonica chromosome 10 (Figure 5b).
The integrated models included 3005 (84.2%) that were
detected by tiling arrays, of which, 1,120 (31.4%) were not
previously supported by expression data or homology. Thus,
3,255 (91.2%) models in the integrated set now have at least
one piece of supporting evidence (for example, expressed
sequences, homology, or tiling microarray) (Figure 5c). Clas-
sification of the array-detected and undetected models, based
on exon number, homology to Arabidopsis genes, and previ-
ous supporting evidence, indicates that detection by our tiling
microarray was not biased regarding gene structure and was
in general agreement with all other annotation information
(Figure 5c). These results demonstrate tiling microarray anal-
ysis as a useful platform to validate and incorporate informa-
tion from multiple sources to fully identify the rice
transcriptome.
Heterochromatin-associated regulation of
chromosome-wide transcriptional activity
We applied the tiling microarrays to study chromosomal posi-
tion effects on gene expression. As shown in Figure 6, chro-
mosome-wide gene model distribution and expression
suggests that chromosome 10 can be divided into two roughly
equal-sized domains, with domain I consisting of the short
arm and the proximal end of the long arm, while domain II
encompasses the rest of the chromosome. This division was
based on transcriptional profiles of the two domains, as
revealed by tiling microarray analysis (Figure 6). Domain II
had a higher density of nonredundant gene models (Figure
7a). Under normal growth conditions (the N Arrays), it also
contained more signal oligos and more array-detected models
and thus was more transcriptionally active relative to domain
I (Figure 6). Such a distinction between the two domains was
further supported by the higher number of CG models in
domain II, which are presumably highly expressed (Figure
7b). Interestingly, although only a small number of gene mod-
Genome Biology 2005, Volume 6, Issue 6, Article R52 Li et al. R52.9
comment reviews reports refereed researchdeposited research interactions information
Genome Biology 2005, 6:R52
els were specifically detected from the S Arrays (see above),
overall transcriptional activity in domain I was elevated
under the examined stress conditions (Figure 6d). The activa-
tion was observed both at the individual gene model level and
in 100 kb windows across domain I (Figure 6d). Such a gen-
eral derepression of transcription under stress conditions
may imply another layer of gene regulation at the chromo-
somal level in rice.
The observed transcriptional profiles of the two domains
were associated with several architectural features of the
chromosome. In general, domain I was more enriched with
TE and LH models (Figure 7a,c). Domain I also harbored
more repetitive sequence, as was evident from the greater
number of oligos masked during array design (Figure 6a). To
further examine the two domains, colinearity of the CG mod-
els in chromosome 10 of japonica and indica rice was calcu-
lated. Mapping chromosomal positions of corresponding
orthologous CG model pairs along chromosome 10 of
japonica (blue) and indica (red) against the sequential orders
of the CG pairs resulted in two apparently smooth parallel
curves (Figure 8a). This observation indicates that the order
of CG models is well preserved between chromosome 10 of
japonica and indica rice. However, calculation of the physical
distance between corresponding japonica and indica CG
models along the chromosome indicated that the positions of
the CG models were more skewed in domain I, with many CG
models shuffled more than 1 Mb away from their orthologous
counterparts in the reciprocal chromosome (Figure 8b).
These results coincide with cytological data showing that
domain I is primarily heterochromatin, whereas domain II is
primarily euchromatin [5,33]. Although it remains to be seen
whether the phenomena mentioned above are general fea-
tures associated with the division of heterochromatin and
euchromatin in rice, these results collectively indicate that the
heterochromatic domain of chromosome 10 is more evolu-
tionarily active and compositionally dynamic. Our results fur-
ther indicate that the genomic characteristics of the
heterochromatin domain are associated with its transcrip-
tional activities (Figure 6).
Discussion
Sequencing of the rice genome provides a cornerstone to
understand the biology of this agriculturally important crop
[1-8,34-36]. A first step in fully realizing the potential of avail-
able genome sequence is to understand its coding informa-
tion and expression; however, current annotated gene models
and other functional elements of a genome by and large rep-
resent hypotheses that must be experimentally tested and val-
idated. Importantly, approximately 20,000 predicted rice
genes exhibit no recognizable sequence homology to genes in
other organisms, especially Arabidopsis, the first model plant
sequenced [1-8]. The unusual compositional and structural
features, as well as the lack of EST coverage for a large
Analysis of intergenic TARs of japonica chromosome 10Figure 4
Analysis of intergenic TARs of japonica chromosome 10. (a) The 988
japonica chromosome 10 intergenic TARs distributed by length. (b) RNA
gel blotting analysis of selected japonica intergenic TARs. Probes for the
intergenic TARs shown in this panel were derived from corresponding
PCR-amplified TAR sequences from japonica rice genomic DNA. (c)
Probes shown in this panel were derived from RT-PCR amplification of the
corresponding TARs from poly(A)
+
RNA. (d) The rice cDNAs for eIF4A
and actin2 were used as loading controls. 5 µg of RNA from the four
sources - root, shoot, panicle, and suspension cell culture - that were used
for probing tiling microarrays were used for RNA blot analysis here.
(a)
(b) (c)
Length of intergenic TARs
219 804 1389 1975 2560 3145 3730
Number of intergenic TARs
Root
Shoot
Panicle
Cell culture
Cell culture
Root
Shoot
Panicle
T001
T024
T050
T079
T080
T119
T132
T198
T224
T237
T238
T241
eIF4A
Actin2
T012
T026
T043
T065
T108
T114
T165
T175
T178
T211
T304
T309
T433
T570
20
120
100
80
60
40
0
(d)
R52.10 Genome Biology 2005, Volume 6, Issue 6, Article R52 Li et al. />Genome Biology 2005, 6:R52
Figure 5 (see legend on next page)
BGI indica BGI japonica TIGR japonica
Number
1404
1405
1366
1398
1496
1523
1265
1163 1213
1106
1310
1162
72
114
363
549
3019
1310
453
1256
136
753
427
2252
372
1553
191
1452
313
1120
250
1885
BGI japonica
BGI indica
Novel
New model
TIGR model
Expressed
Array-detected
Undetected
Multiple-exon detected
Multiple-exon undetected
Single-exon detected
Single-exon undetected
HH detected
HH undetected
LH detected
LH undetected
Supported detected
Supported undetected
Unsupported detected
Unsupported undetected
Annotated HH
Detected HH
Annotated LH
Detected LH
1,400
1,200
1,000
800
600
400
200
1,600
0
(a)
(b)
(c)
Genome Biology 2005, Volume 6, Issue 6, Article R52 Li et al. R52.11
comment reviews reports refereed researchdeposited research interactions information
Genome Biology 2005, 6:R52
number of novel genes, require high-throughput experimen-
tal means that are not limited by the current annotations.
Identification of the rice chromosome 10
transcriptome by tiling microarrays
In this study, we developed whole-chromosome oligonucle-
otide tiling microarrays, and demonstrated their utility in
experimentally identifying the transcriptome of both
japonica and indica chromosome 10. Because oligonucle-
otide tiling microarrays provide unbiased end-to-end cover-
age of the entire chromosome and measure transcriptional
activity of gene models from multiple independent probes
(Figure 2), they can detect the transcriptome in a comprehen-
sive and unbiased way [19-21,23-25]. The tiling microarray
analysis of rice chromosome 10 detected transcription of
86.4% BGI indica (2,428/2,809), 83.9% BGI japonica
(2,319/2,764), and 81.9% TIGR japonica (2,472/3,019) gene
models (Table 1). Using a set of the least reliable gene models
(UG models, see below), RT-PCR analysis revealed disparity
in gene structure of close to 50% of these models (Figure 3).
These results are consistent with previous assessments of cur-
rent computational gene finders, which can reliably locate a
gene model in the correct chromosome locus, but are less
than satisfactory to predict the fine gene structure [37,38].
Based on alignment to rice full-length cDNA and EST
sequences, the gene models for both japonica and indica
chromosome 10 were classified as UG, EG, and CG models
(Table 1, Figure 2). This classification places the gene models
in three groups with an ascending order of confidence,
because the presence of an expressed sequence provides
strong support to the corresponding model. In keeping with
this idea, these three classes of gene models were also
detected by tiling microarrays in an ascending order (Table 1).
This result, together with the high detection rate of CG mod-
els, suggests that the chromosome 10 transcriptomes identi-
fied by the tiling microarrays are rather exhaustive. In
support of this conclusion, tiling array analysis of rice seed-
lings which had undergone severe stress treatments only
identified an additional 39 (less than 1.7% of the total
detected) models. These results likely can be attributed to the
high sensitivity of the tiling microarrays such that even if
activation of certain genes is conditional, the basal level tran-
scripts could still be detected by the tiling microarray.
Therefore, the UG models (particularly UG/LH) that failed to
be detected by the tiling microarray need to be more closely
inspected (Table 1, Figure 3). We did find that the gene mod-
els specifically detected following the stress treatments were
enriched with UG/LH models (23/39), suggesting that some
UG/LH might be stress responsive and their expression is not
readily detectable under normal conditions. It should be
noted that though redundant gene models such as those
derived from long terminal repeat (LTR) retrotransposons
and Pack-MULEs are generally under-represented in the
expressed sequence collections [12,39], many are stress
responsive and share similar cis-elements with plant defense
genes [40]. Thus, it cannot be ruled out that some of the UG/
LH models are related to low copy number retrotransposons
with unusual structures.
Reasoning that the tiling microarray-detected transcriptome
is both exhaustive and reliable, tiling microarray-supported
gene models were mapped and integrated. This analysis iden-
tified 363 unique BGI japonica, 114 unique BGI indica, and
72 novel models that could be integrated into the TIGR
japonica gene model set to comprehensively represent the
japonica chromosome 10 transcriptome (Figure 5). Note that
the added gene models do not necessarily increase the
number of japonica chromosome 10 genes, even if their
transcription was detected. As elaborated above, some of
these gene models could be unrecognized TEs, uncharacter-
ized UTRs or alternative exons. However, as all these extra
gene models are transcribed, their identification will not only
better represent the transcriptome, but further examination
of these elements will also yield insight into rice genome com-
position and structure.
Extensive antisense transcription was observed for the rice
chromosome 10 gene models. For instance, in a preliminary
analysis whereby regions of the antisense strand covering the
3,019 TIGR japonica gene models were examined, excluding
those that contain less than three signal oligos, 591 (19.6%)
were found to have antisense expression. The proportion of
rice gene models showing antisense transcription is consist-
ent with that reported from tiling microarray analyses in Ara-
bidopsis [23] and human [24,25], adding to an increasing
body of evidence that indicates antisense transcription as an
inherent property of the genomes. However, it should be
cautioned that the potential effects of several experimental
artifacts such as unintended second-strand synthesis, forma-
tion of specific RNA-DNA hybrids, or spurious priming
events during target preparation have to be precisely assessed
Comparison and integration of chromosome 10 gene modelsFigure 5 (see previous page)
Comparison and integration of chromosome 10 gene models. (a) Number of annotated and array-detected high homology (HH) and low homology (LH)
models in the BGI indica, BGI japonica, and TIGR japonica annotations. (b) The 549 new gene models were combined with the 3,019 TIGR models. Origins
of the new models are shown on the left. Expression support for the TIGR models is shown on the right. Expressed, models matching full-length cDNA/
EST; array-detected, models not supported by the expressed sequences but detected by microarray; undetected, models neither supported by expressed
sequences nor detected by microarray. (c) Classification of integrated japonica chromosome 10 gene models based on tiling array detection and exon
number (left), homology to Arabidopsis genes (middle), and previous expression or homology support to the models (right).
R52.12 Genome Biology 2005, Volume 6, Issue 6, Article R52 Li et al. />Genome Biology 2005, 6:R52
before a final conclusion on the nature and extent of antisense
transcription in rice can be drawn.
Transcriptional activities outside the annotated gene models
in the form of intergenic TARs, accounted for approximately
3% of the chromosome size (Figure 4a). RNA gel blotting and
RT-PCR analyses confirmed only a portion of the selected
TARs (Figure 3, 4), suggesting that the unconfirmed TARs
could be experimental artifacts or correspond to transcripts
of extreme low abundance [21,25,27]. Transcriptome compo-
nents outside of previously annotated gene models are
expected to correspond to: novel genes with unusual
sequence composition; under-represented UTRs or exons of
splice variants; nonprotein coding RNA transcripts; or
uncharacterized transcribed TEs. RT-PCR analysis of selected
japonica intergenic TARs suggests that the majority of the
TARs belong to the first two groups (Figure 3b). This conclu-
sion is consistent with the observation that the intergenic
TARs were slightly enriched in regions of the chromosome
with lower gene density (Figure 7d). A preliminary analysis
whereby 214 plant miRNAs (including 122 from rice and 92
from Arabidopsis) [41,42] were used in a BLAST search
against the intergenic TARs revealed no significant hits, sug-
Rice chromosome 10 gene model distribution and expressionFigure 6
Rice chromosome 10 gene model distribution and expression. (a) Characterization of TIGR nonredundant protein-coding gene models. Model density,
array detection rate, number of signal oligos, number of intergenic TARs, and cumulative length (in kilobases) of masked oligos are calculated in 100-kb
windows along the length of chromosome 10, and are represented by color-coded vertical bars. A scale representing the physical length of chromosome
10 is shown at the bottom of the panel. The arrowhead delimits the division of domain I and domain II as indicated in the text. Note that the centromere
is located at a position around 7 to 8 Mb in chromosome 10. (b) Gene model density and array detection rate of the BGI japonica annotation. (c) Gene
model density and array detection rate of the BGI indica annotation. (d) Comparison of the S Arrays and the N Arrays using the BGI japonica annotation.
Log
2
(S/N) of the hybridization intensity was calculated for individual models (top) and the mean intensity of all models in 100-kb windows along the length
of chromosome 10 (bottom).
Model density
Detection rate
Model density
Detection rate
Model density
Detection rate
Log
2
(S/N)
Signal oligo
10
100 kb
50 kb
Intergenic TAR
Masked oligo
0246810121416182022
0246810121416182022
0246810121416182022
024
0 05 10 15 20 0.5 0.75 1 1 −1100 125 150 175 200
6
Model density Model detection rate Signal oligo number Log
2
(S/N)
8 10121416182022
Domain I Domain II
(a)
(b)
(c)
(d)
Genome Biology 2005, Volume 6, Issue 6, Article R52 Li et al. R52.13
comment reviews reports refereed researchdeposited research interactions information
Genome Biology 2005, 6:R52
gesting that the TARs do not contain known plant
microRNAs.
We thus focused our efforts on further analyzing the first two
groups of TARs. For the current rice annotation, five different
gene finders (primarily FGENESH) were used to generate
gene models [8]. To annotate the intergenic TARs, we used
the relatively new rice gene-finder program BGF [2,6,30],
which identified 72 novel gene models (Figure 5). Sequence
comparison between the 40 cloned intergenic TAR tran-
scripts and the novel BGF models showed that 23 (57.5%)
were predicted (Figure 3b), indicating that the BGF program
was able to detect slightly more than half of the novel tran-
scriptional units that might be represented by the intergenic
TARs. Extrapolation from these observations suggests that
there might be up to 2,000 novel genes yet to be recognized
by current rice gene finders; however, the incomplete nature
of the cloned transcripts made it difficult to unambiguously
determine whether they encode proteins. Thus, it is possible
that some of these transcripts may correspond to noncoding
RNAs.
Chromosome-wide distribution of gene models and chromosomal elementsFigure 7
Chromosome-wide distribution of gene models and chromosomal elements. (a) Distribution of TIGR japonica nonredundant protein-coding gene models
(non-TE) and transposable element-related models (TE) in 1-Mb windows across chromosome 10. The division between domain I and II is indicated by the
arrowhead. Note that the centromere is located at around 7 to 8 Mb in chromosome 10. (b) Distribution of BGI japonica CG and UG models in 1-Mb
windows across chromosome 10. (c) Distribution of BGI japonica HH and LH models in 1-Mb windows across chromosome 10. (d) Numbers of the TIGR
japonica nonredundant protein-coding gene models (TIGR Non-TE) and tiling array-detected intergenic TARs in 1-Mb windows across chromosome 10.
Number
Number
Number
Number
NonTE
TE
Chromosome 10 (Mb)
CG
UG
HH
L H
TIGR NonTE
Intergenic TAR
(a) (b)
(c) (d)
200
160
120
80
0
40
15 9131721
Chromosome 10 (Mb)
15 9131721
Chromosome 10 (Mb)
15 9131721
Chromosome 10 (Mb)
15 9131721
120
100
80
60
0
40
20
200
160
120
80
0
40
120
100
80
60
0
40
20
R52.14 Genome Biology 2005, Volume 6, Issue 6, Article R52 Li et al. />Genome Biology 2005, 6:R52
Association of chromosomal architecture with
transcriptional activity
Eukaryotic genomes contain heterochromatin as cytologically
intensely staining nuclear materials that are thought to be
composed mainly of noncoding DNA and silent transposons
[33,43]. A salient feature of rice chromosome 10 is that its
heterochromatin is not limited to the pericentric regions, but
includes the entire short arm as well as the proximal portion
of the long arm [33]. Comparison of cytological and sequence
data suggests that this heterochromatin region is roughly 11-
12 Mb in length [5,33]. Although recent genetic and microar-
ray studies in plants have indicated a role for gene regulation
by well defined small heterochromatin regions [44-47], virtu-
ally no data are available regarding the association of
transcriptional activity with large-scale heterochromatin
domains in regulating gene expression, chromosome behav-
ior, and genome evolution.
Profiling the transcriptional activities of rice chromosome 10
using tiling microarrays revealed that gene expression in the
heterochromatin region is generally low under normal
growth conditions (the N Arrays) relative to the euchromatin
(Figure 6a-c). Consistent with this observation, gene model
distribution showed that the heterochromatin domain is rel-
atively low in CG models but more abundant in UG models
(Figure 7b). In support of the cytological data, an enrichment
of TE models in the heterochromatin domain is evident (Fig-
ure 7a) [5]. Exclusion of the high copy number TEs and repet-
itive sequences from the tiling microarray analysis might
contribute to the lower gene model density in the heterochro-
matin (Figure 7a-c); however, the generally lower detection
rate of gene expression indicates that expression of many
non-TE models is also somewhat repressed (Figure 7a-c).
Interestingly, when plants were subjected to mineral or nutri-
ent stresses, a general activation of transcription was
observed in the heterochromatin (Figure 6d). These results
are consistent with findings that heterochromatin stability
and heterochromatin-mediated gene silencing can be regu-
lated by development [48,49] or by modulating levels of spe-
cific transcription factors [50].
The distribution of TE and non-TE gene models in the hete-
rochromatic and euchromatic regions was a near mirror
image (Figure 7a). This result suggests that the
heterochromatin and euchromatin may have similar capaci-
ties to accommodate protein-coding gene models (TE and
non-TE), even though the heterochromatin is enriched with
repetitive sequences (Figure 6a) [5]. Furthermore, the hete-
rochromatin is relatively enriched with LH models and low in
CG models compared with the euchromatin (Figure 7b, c).
Thus it is likely that the differential packaging of genome ele-
ments in heterochromatin and euchromatin might enable rice
to regulate and coordinate gene expression at the chromo-
somal level. Although the underlying molecular mechanism
of this regulation is currently unknown, DNA methylation,
histone modifications, and small interfering RNAs have all
been implicated [51-55].
The distance between corresponding japonica and indica CG
models along the chromosome was more skewed in the hete-
rochromatin, with many CG genes shuffled more than 1 Mb in
physical distance from the location of their orthologous coun-
terparts. In contrast, the gene distance in the euchromatin is
largely homogeneous (Figure 8). Previous studies have shown
a mosaic organization of grass genomes where conserved
sequences are disrupted by nonconserved sequences, and
that gene amplification, movement, and activity of retro-
transposons account for the bulk of the interspersing noncon-
served sequences [56-58]. Thus, these results collectively
indicate that the heterochromatin domain is more
evolutionarily active and compositionally dynamic. Such a
conclusion is in keeping with the genomic stress hypothesis
that TEs are involved in host adaptation to environmental
changes [39,40,59].
Materials and methods
Plant materials and treatments
Oryza sativa ssp. japonica cv. Nipponbare and Oryza sativa
ssp. indica cv. 93-11 were used for all experiments. Seeds were
surface-sterilized, imbibed at 37°C for 2 days, and then trans-
ferred to MS medium (Invitrogen) solidified with 0.8% (w/v)
agar. Seedlings were kept under continuous light at 28°C for
seven days before harvest for total RNA isolation. Alterna-
tively, 7-day-old seedlings were transferred to soil and main-
tained under long-day conditions (16 h light/8 h dark) at 26-
28°C in the greenhouse until flowering. Heading and filling
stage panicles were then collected from these plants. Suspen-
sion-cultured cells were prepared and maintained as previ-
ously described [60]. For stress treatment, japonica seedlings
were grown for seven days on MS medium under four differ-
ent conditions: MS medium deprived of nitrogen; MS
medium deprived of phosphorus, or supplemented with 150
mM NaCl or 100 µM CdSO
4
. For RNA isolation, plant materi-
als were frozen in liquid nitrogen and homogenized. Total
RNA and mRNA were isolated using the RNeasy Plant Mini
kit (Qiagen) and the Oligotex mRNA kit (Qiagen) according to
the manufacturer's recommendations, respectively.
MAS microarray design, production, and hybridization
Based on the MAS platform, a minimal tiling strategy was
designed to effectively represent the nonrepetitive sequences
of rice chromosome 10 [24,26]. Briefly, 36-mer oligonucle-
otides were designed using an algorithm based on sequence-
dependent factors such as length, extent of complementarity,
and the overall base composition. Oligos that could form a
stem-loop structure with stem length greater than seven
bases and those that have an oligo index score greater than 5
were excluded. To calculate the index score for each oligo, the
20 possible consecutive 17-mer sequences within each oligo
were searched against the whole genome. The average copy
Genome Biology 2005, Volume 6, Issue 6, Article R52 Li et al. R52.15
comment reviews reports refereed researchdeposited research interactions information
Genome Biology 2005, 6:R52
number of the 17-mer sequences was scored as the oligo
index. MAS microarray production was performed as previ-
ously described [24,26,29] using the sequences of chromo-
some 10 for japonica and indica rice as were available on 12
April, 2004 [8] and 1 August, 2003 [6,30], respectively. Oli-
gos were synthesized at a density of 389,000 oligos per array
in a chessboard design wherein each positive feature, which
contains an interrogating oligo, was surrounded by four neg-
ative features and vice versa.
The japonica and indica N Arrays both included four individ-
ual MAS arrays that contain oligos representing other por-
tions of the genome (other than chromosome 10) not
analyzed in the current study. The N Arrays were hybridized
to cDNA target mixtures derived in equal amounts from seed-
ling roots, seedling shoots, panicles, and suspension-cultured
cells of both japonica (cv. Nipponbare) and indica (cv. 93-11)
rice. Additionally, a set of two japonica arrays (S Arrays) were
hybridized to targets derived from pooled poly(A)
+
RNA iso-
lated from leaves of stress-treated japonica seedlings. Target
preparation, array hybridization, and hybridization intensity
value acquisition were carried out as previously described
[24,26,29,61]. Tiling microarray design and experimental
data are available in the National Center for Biotechnology
Information (NCBI) Gene Expression Omnibus under series
GSE2500.
Chromosome 10 gene model compilation
The japonica (TIGR Rice Pseudomolecule released on 12
April 2004) [8] and indica (released by BGI on 1 August
2003) [6,30] chromosome 10 annotations were used in this
study. In addition, the japonica chromosome 10 sequence
was annotated using the BGI gene prediction flow to generate
the BGI japonica gene model set. All gene models were
aligned to a collection of rice full-length cDNA sequences [15]
and all available rice EST sequences in GenBank [17] as of 15
April 2004 by the BLAT program [62] using cutoff criteria of
100 bp overlap and 90% identity over the entire length of each
match. The predicted genes without matches to cDNA and
EST sequences, excluding those with coding capacities of less
than 50 amino acids, were classified as UG models.
Determination of gene model expression and
identification of intergenic TARs
Hybridization intensity of all positive and all negative fea-
tures within each array was plotted separately and then scaled
to have a peak log
2
intensity of 8.0 (Figure 1a,b). Signal and
noise probe determination is shown in Figure 1c and
discussed in main text. Expression level of a given gene model
was represented by the value of hybridization intensity (HI)
of this model locus that takes into account two parameters:
FI, which is the mean of fluorescence intensity of all signal
probes of a given gene model, and hybridization rate (HR),
which is defined as the percentage of signal probes over total
interrogating probes per kilobase of genomic sequence. HI is
calculated using the formula HI = FI + FI × (HR
E
- HR
M
) in
which HR
E
is HR of the exon regions whilst HR
M
is the mean
HR of all intron regions. HI value of each model was then
compared against a threshold designated as the mean fluores-
cence intensity plus twice the standard deviation (95% confi-
dence) of all noise probes within each array.
To identify intergenic TARs, HR was calculated in a sliding
window of 500 nucleotides across the intergenic regions of
chromosome 10 with a bandwidth equal to an interrogating
probe. Windows with HR above a threshold of 0.4 were con-
sidered positive. Contiguously transcribed regions (TARs)
were generated by joining overlapping positive windows that
were delineated by the 5' probe of the first window and 3'
probe of the last. TARs less than 220 bp (five consecutive
probes) long were discarded. The japonica intergenic TARs
Colinearity of the CG models for chromosome 10 in japonica and indica riceFigure 8
Colinearity of the CG models for chromosome 10 in japonica and indica
rice. (a) Chromosomal positions of corresponding CG model pairs along
chromosome 10 in japonica (blue) and indica (red) rice are plotted against
the sequential orders of the CG pairs. (b) Physical distance between
corresponding CG pairs is plotted against their sequential orders along the
chromosome.
Order of CG model
Chromosome 10 (Mb)Distance (Mb)
japonica
indica
24
20
16
12
0 100 200 300 400 500 600 700 800
Order of CG model
0 100 200 300 400 500 600 700 800
8
4
0
1.4
0
1.2
1.0
0.8
0.6
0.4
0.2
(a)
(b)
R52.16 Genome Biology 2005, Volume 6, Issue 6, Article R52 Li et al. />Genome Biology 2005, 6:R52
were first identified using the BGI japonica annotation, fol-
lowed by comparison with TIGR models. TARs overlapping
with TIGR models were masked. Sequences of all retained
intergenic TARs were aligned to the BGF gene predictions,
and were used to BLASTX search the nonredundant protein
database SWISS-PROT. Those BGF-predicted genes that
overlap more than 100 bp with the sequence of intergenic
TARs on the same strand of DNA were considered positive.
Cloning and verification of UG models and intergenic
TARs
Selected UG models were cloned by means of RT-PCR. The
PCR products were cloned into the pGEM-T vector (Promega)
and sequenced. To clone intergenic TARs with downstream
sequence, reverse transcription was performed on mixed
poly(A)
+
RNA derived from seedling roots, seedling shoots,
panicles and suspension-cultured cells of japonica rice using
the primer RT-CPK (5'-
TGCAGTCTAGCTGGAATGACCTCATTGCAGAAT
24
). The
PCR procedure to clone the TARs was carried out using a cas-
cade of thermal asymmetric interlaced PCR cycles [63,64]
that employ three consecutively nested gene-specific primers
to pair with primer RT-1 (5'-GCAGTCTAGCTGGAAT), RT-2
(5'-CTGGAATGACCTCATT), and RT-3 (5'-GCTGGAATGAC-
CTCATTGCAGAAT), which anneal to overlapping regions of
RT-CPK. Sequences of all the cloned PCR products were
aligned back to japonica chromosome 10 using BLAT [62] to
confirm their identify and to map their corresponding gene
structure. RNA gel-blot analysis of intergenic TARs was con-
ducted as previously described [65].
Integration of japonica chromosome 10 gene models
All japonica chromosome 10 related gene models were
sorted, and only those that met certain criteria were retained.
The TIGR nonredundant gene models that can be mapped to
the japonica chromosome 10 sequence were all retained. The
additional models included BGI japonica, BGI indica models
mapped to japonica chromosome 10, and tiling array-derived
novel BGF models. From these models, those without previ-
ous full-length cDNA/EST or tiling microarray support, or
those overlapping with TIGR models were discarded. All
retained models were aligned back to the japonica chromo-
some 10 sequences to further confirm their identities and
were combined with the TIGR japonica models.
Additional data files
The following additional data files are available with the
online verison of this paper. Additional data file 1 contains a
table of integrated japonica chromosome 10 nonredundant
gene models. Additional data file 2 contains a table of indica
chromosome 10 nonredundant gene models. Additional data
file 3 contains a table of the sequence analysis of cloned UG
models. Additional data file 4 contains japonica chromosome
10 intergenic TARs. Additional data file 5 contains the
sequence analysis of cloned intergenic TARs. Additional data
file 6 contains a comparison of BGI and TIGR japonica chro-
mosome 10 gene models. Additional data file 7 contains a
comparison of BGI indica and japonica chromosome 10 gene
models.
Additional File 1Table S1. Integrated japonica chromosome 10 nonredundant gene modelsTable S1. Integrated japonica chromosome 10 nonredundant gene models. Integrated japonica chromosome 10 nonredundant gene models.Click here for fileAdditional File 2Table S2: Indica chromosome 10 nonredundant gene modelsTable S2: Indica chromosome 10 nonredundant gene models. Indica chromosome 10 nonredundant gene models.Click here for fileAdditional File 3Table S3: Sequence analysis of cloned UG models. Sequence analy-sis of cloned UG modelsTable S3: Sequence analysis of cloned UG models. Sequence analy-sis of cloned UG models.Click here for fileAdditional File 4Table S4: Japonica chromosome 10 intergenic TARsTable S4: Japonica chromosome 10 intergenic TARs. Japonica chromosome 10 intergenic TARs.Click here for fileAdditional File 5Table S5: Sequence analysis of cloned intergenic TARsTable S5: Sequence analysis of cloned intergenic TARs. Sequence analysis of cloned intergenic TARs.Click here for fileAdditional File 6Table S6: Comparison of BGI and TIGR japonica chromosome 10 gene modelsTable S6: Comparison of BGI and TIGR japonica chromosome 10 gene models. Comparison of BGI and TIGR japonica chromosome 10 gene models.Click here for fileAdditional File 7Table S7: Comparison of BGI indica and japonica chromosome 10 gene modelsTable S7: Comparison of BGI indica and japonica chromosome 10 gene models. Comparison of BGI indica and japonica chromosome 10 gene models.Click here for file
Acknowledgements
We thank Jessica Habashi for critical reading of the manuscript. The rice til-
ing microarray project at Yale University was supported by a grant from the
NSF Plant Genome Program (DBI-0421675). The collaborative research
effort in China was supported by the 863-rice functional genomics program
from the Ministry of Science and Technology of China, and by the National
Institute of Biological Sciences at Beijing. L.L. was initially supported by a
Yale University Brown postdoctoral fellowship.
References
1. Goff SA, Ricke D, Lan TH, Presting G, Wang RL, Dunn M, Glazebrook
J, Sessions A, Oeller P, Varma H, et al.: A draft sequence of the
rice genome (Oryza sativa L. ssp japonica). Science 2002,
296:92-100.
2. Yu J, Hu S, Wang J, Wong GK, Li S, Liu B, Deng Y, Dai L, Zhou Y,
Zhang X, et al.: A draft sequence of the rice genome (Oryza
sativa L. ssp. indica). Science 2002, 296:79-92.
3. Feng Q, Zhang Y, Hao P, Wang S, Fu G, Huang Y, Li Y, Zhu J, Liu Y,
Hu X, et al.: Sequence and analysis of rice chromosome 4.
Nature 2002, 420:316-320.
4. Sasaki T, Matsumoto T, Yamamoto K, Sakata K, Baba T, Katayose Y,
Wu J, Niimura Y, Cheng Z, Nagamura Y, et al.: The genome
sequence and structure of rice chromosome 1. Nature 2002,
420:312-316.
5. The Rice Chromosome 10 Sequencing Consortium: In-depth view
of structure, activity, and evolution of rice chromosome 10.
Science 2003, 300:1566-1569.
6. Yu J, Wang J, Lin W, Li S, Li H, Zhou J, Ni P, Dong W, Hu S, Zeng C,
et al.: The genomes of Oryza sativa: a history of duplications.
PLoS Biol 2005, 3:e38.
7. IRGSP releases the assembled rice genome sequences [http:/
/rgp.dna.affrc.go.jp/IRGSP/Build2/build2.html]
8. TIGR Rice Genome Annotation [ />osa1/pseudomolecules/info.shtml]
9. Wong GK, Wang J, Tao L, Tan J, Zhang J, Passey DA, Yu J: Compo-
sitional gradients in Gramineae genes. Genome Res 2002,
12:851-856.
10. Bennetzen JL, Coleman C, Liu R, Ma J, Ramakrishna W: Consistent
over-estimation of gene number in complex plant genomes.
Curr Opin Plant Biol 2004, 7:732-736.
11. Jabbari K, Cruveiller S, Clay O, Le Saux J, Bernardi G: The new
genes of rice: a closer look. Trends Plant Sci 2004, 9:281-285.
12. Jiang N, Bao Z, Zhang X, Eddy SR, Wessler SR: Pack-MULE trans-
posable elements mediate gene evolution in plants. Nature
2004, 431:569-573.
13. Juretic N, Bureau TE, Bruskiewich RM: Transposable element
annotation of the rice genome. Bioinformatics 2004, 20:155-160.
14. Hass BJ, Volfovsky N, Town CD, Troukhan M, Alexandrov N, Feld-
mann KA, Flavell RB, White O, Salzberg SL: Full-length messenger
RNA sequences greatly improve genome annotation. Genome
Biol 2002, 3:research0029.1-0029.12.
15. Kikuchi S, Satoh K, Nagata T, Kawagashira N, Doi K, Kishimoto N,
Yazaki J, Ishikawa M, Yamada H, Ooka H, et al.: Collection,
mapping, and annotation of over 28,000 cDNA clones from
japonica rice. Science 2003, 301:376-379.
16. Castelli V, Aury JM, Jaillon O, Wincker P, Clepet C, Menard M, Cru-
aud C, Quetier F, Scarpelli C, Schachter V, et al.: Whole genome
sequence comparisons and 'full-length' cDNA sequences: a
combined approach to evaluate and improve Arabidopsis
genome annotation. Genome Res 2004, 14:406-413.
17. NCBI Expressed Sequence Tags Database [http://
www.ncbi.nlm.nih.gov/dbEST]
18. Meyers BC, Vu TH, Tej SS, Ghazal H, Matvienko M, Agrawal V, Ning
J, Haudenschild CD: Analysis of the transcriptional complexity
of Arabidopsis thaliana by massively parallel signature
sequencing. Nat Biotechnol 2004, 22:1006-1011.
19. Shoemaker DD, Schadt EE, Armour CD, He YD, Garrett-Engele P,
Genome Biology 2005, Volume 6, Issue 6, Article R52 Li et al. R52.17
comment reviews reports refereed researchdeposited research interactions information
Genome Biology 2005, 6:R52
McDonagh PD, Loerch PM, Leonardson A, Lum PY, Cavet G, et al.:
Experimental annotation of the human genome using micro-
array technology. Nature 2001, 409:922-927.
20. Selinger DW, Cheung KJ, Mei R, Johansson EM, Richmond CS, Blat-
tner FR, Lockhart DJ, Church GM: RNA expression analysis using
a 30 base pair resolution Escherichia coli genome array. Nature
Biotechnol 2000, 18:1262-1268.
21. Kapranov P, Cawley SE, Drenkow J, Bekiranov S, Strausberg RL,
Fodor SP, Gingeras TR: Large-scale transcriptional activity in
chromosomes 21 and 22. Science 2002, 296:916-919.
22. Rinn JL, Euskirchen G, Bertone P, Martone R, Luscombe NM, Hart-
man S, Harrison PM, Nelson FK, Miller P, et al.: The transcriptional
activity of human chromosome 22. Genes Dev 2003, 17:529-540.
23. Yamada K, Lim J, Dale JM, Chen H, Shinn P, Palm CJ, Southwick AM,
Wu HC, Kim C, Nguyen M, et al.: Empirical analysis of transcrip-
tional activity in the Arabidopsis genome. Science 2003,
302:842-846.
24. Bertone P, Stolc V, Royce TE, Rozowsky JS, Urban AE, Zhu X, Tong-
prasit W, Samanta M, Weissman S, Rinn JL, et al.: Global identifica-
tion of human transcribed sequences with genome tiling
arrays. Science 2004, 306:2242-2246.
25. Kampa D, Cheng J, Kapranov P, Yamanaka M, Brubaker S, Cawley S,
Drenkow J, Piccolboni A, Bekiranov S, Helt G, et al.: Novel RNAs
identified from an in-depth analysis of the transcriptome of
human chromosomes 21 and 22. Genome Res 2004, 14:331-342.
26. Stolc V, Gauhar Z, Mason C, Halasz G, vanBatenburg MF, Rifkin SA,
Hua S, Herreman T, Tongprasit W, Barbano PE, et al.: A gene
expression map for the euchromatic genome of Drosophila
melanogaster. Science 2004, 306:655-660.
27. Mockler TC, Ecker JR: Applications of DNA tiling arrays for
whole-genome analysis. Genomics 2005, 85:1-15.
28. Singh-Gasson S, Green RD, Yue YJ, Nelson C, Blattner F, Sussman
MR, Cerrina F: Maskless fabrication of light-directed oligonu-
cleotide microarrays using a digital micromirror array. Nat
Biotechnol 1999, 17:974-978.
29. Nuwaysir EF, Huang W, Albert TJ, Singh J, Nuwaysir K, Pitas A, Rich-
mond T, Gorski T, Berg JP, Ballin J, et al.: Gene expression analysis
using oligonucleotide arrays produced by maskless
photolithography. Genome Res 2002, 12:1749-1755.
30. Zhao WM, Wang J, He X, Huang X, Jiao Y, Dai M, Wei S, Fu J, Chen
Y, Ren X, et al.: BGI-RIS: an integrated information resource
and comparative analysis workbench for rice genomics.
Nucleic Acids Res 2004, 32:D377-D382.
31. Wu P, Ma L, Hou X, Wang M, Wu Y, Liu F, Deng XW: Phosphate
starvation triggers distinct alterations of genome expression
in Arabidopsis roots and leaves. Plant Physiol 2003, 132:1260-1271.
32. Rabbani MA, Maruyama K, Abe H, Khan MA, Katsura K, Ito Y, Yoshi-
wara K, Seki M, Shinozaki K, Yamaguchi-Shinozaki K: Monitoring
expression profiles of rice genes under cold, drought, and
high-salinity stresses and abscisic acid application using
cDNA microarray and RNA gel-blot analyses. Plant Physiol
2003, 133:1755-1767.
33. Cheng Z, Buell CR, Wing RA, Gu M, Jiang J: Toward a cytological
characterization of the rice genome. Genome Res 2001,
11:2133-2141.
34. Gale MD, Devos KM: Comparative genetics in the grasses. Proc
Natl Acad Sci USA 1998, 95:1971-1974.
35. Shimamoto K, Kyozuka J: Rice as a model for comparative
genomics of plants. Annu Rev Plant Biol 2002, 53:399-419.
36. Rensink WA, Buell CR: Arabidopsis to rice. Applying knowledge
from a weed to enhance our understanding of a crop species.
Plant Physiol 2004, 135:622-629.
37. Mathé C, Sagot M-F, Schiex T, Rouzé P: Current methods of gene
prediction, their strengths and weaknesses. Nucleic Acids Res
2002, 30:4103-4117.
38. Zhang MQ: Computational prediction of eukaryotic protein-
coding genes. Nat Rev Genet 2002, 3:698-709.
39. Feschotte C, Jiang N, Wessler SR: Plant transposable elements:
where genetics meets genomics. Nat Rev Genet 2002, 3:329-341.
40. Grandbastien MA: Activation of plant retrotransposons under
stress conditions. Trends Plant Sci 1998, 3:181-187.
41. Jones-Rhoades MW, Bartel DP: Computational identification of
plant microRNAs and their targets, including a stress-
induced miRNA. Mol Cell 2004, 14:787-799.
42. Bedell JA, Budiman MA, Nunberg A, Citek RW, Robbins D, Jones J,
Flick E, Rohlfing T, Fries J, Bradford K, et al.: Sorghum genome
sequencing by methylation filtration. PLoS Biol 2005, 3:e13.
43. Hennig W: Heterochromatin. Chromosoma 1999, 108:1-9.
44. Hoekenga OA, Muszynski MG, Cone KC: Developmental
patterns of chromatin structure and DNA methylation
responsible for epigenetic expression of a maize regulatory
gene. Genetics 2000, 155:1889-1902.
45. Stam M, Belele C, Dorweiler JE, Chandler VL: Differential chroma-
tin structure within a tandem array 100 kb upstream of the
maize b1 locus is associated with paramutation. Genes Dev
2002, 16:1906-1918.
46. Kim H, Snesrud EC, Haas B, Cheung F, Town CD, Quackenbush J:
Gene expression analyses of Arabidopsis chromosome 2
using a genomic DNA amplicon microarray. Genome Res 2003,
13:327-340.
47. Mittelsten Scheid O, Afsar K, Paszkowski J: Formation of stable
epialleles and their paramutation-like interaction in tetra-
ploid Arabidopsis thaliana. Nat Genet 2003, 34:450-454.
48. Preuss D: Chromatin silencing and Arabidopsis development:
a role for polycomb protein. Plant Cell 1999, 11:765-768.
49. Meyer P: Transcriptional transgene silencing and chromatin
components. Plant Mol Biol 2000, 43:221-234.
50. Ahmad K, Henikof S: Modulation of a transcription factor coun-
teracts heterochromatic gene silencing in Drosophila. Cell
2001, 104:839-847.
51. Pandey R, Muller A, Napoli CA, Selinger DA, Pikaard CS, Richards EJ,
Bender J, Mount DW, Jorgensen RA: Analysis of histone acetyl-
transferase and histone deacetylase families of Arabidopsis
thaliana suggests functional diversification of chromatin
modification among multicellular eukaryotes. Nucleic Acids Res
2002, 30:5036-5055.
52. Reyes JC, Hennig L, Gruissem W: Chromatin-remodeling and
memory factors. New regulators of plant development. Plant
Physiol 2002, 130:1090-1101.
53. Soppe WJ, Jasencakova Z, Houben A, Kakutani T, Meister A, Huang
MS, Jacobsen SE, Schubert I, Fransz PF: DNA methylation controls
histone H3 lysine 9 methylation and heterochromatin
assembly in Arabidopsis. EMBO J 2002, 21:6549-6559.
54. Lippman Z, Gendrel AV, Black M, Vaughn MW, Dedhia N, McCombie
WR, Lavine K, Mittal V, May B, Kasschau KD, et al.: Role of trans-
posable elements in heterochromatin and epigenetic
control. Nature 2004, 430:471-476.
55. Lippman Z, Martienssen R: The role of RNA interference in het-
erochromatic silencing. Nature 2004, 431:364-370.
56. Dubcovsky J, Ramakrishna W, SanMiguel PJ, Busso CS, Yan L, Shiloff
BA, Bennetzen JL: Comparative sequence analysis of colinear
barley and rice bacterial artificial chromosomes. Plant Physiol
2001, 125:1342-1353.
57. Song R, Llaca V, Messing J: Mosaic organization of orthologous
sequences in grass genomes. Genome Res 2002, 12:1549-1555.
58. Bennetzen JL, Ma J: The genetic colinearity of rice and other
cereals on the basis of genomic sequence analysis. Curr Opin
Plant Biol 2003, 6:128-133.
59. Wessler SR: Plant transposable elements. A hard act to
follow. Plant Physiol 2001, 125:149-151.
60. Baba A, Hasezawa S, Syono K: Cultivation of rice protoplasts and
their transformation mediated by Agrobacterium
spheroplasts. Plant Cell Physiol 1986, 27:463-471.
61. Ma L, Li J, Qu L, Hager J, Chen Z, Zhao H, Deng XW: Light control
of Arabidopsis development entails coordinated regulation of
genome expression and cellular pathways. Plant Cell 2001,
13:2589-2607.
62. Kent WJ: BLAT-the BLAST-like alignment tool. Genome Res
2002, 12:656-664.
63. Liu YG, Mitsukawa N, Oosumi T, Whittier RF: Efficient isolation
and mapping of Arabidopsis thaliana T-DNA insert junctions
by thermal asymmetric interlaced PCR. Plant J 1995, 8:457-463.
64. Liu YG, Whittier RF: Thermal asymmetric interlaced PCR:
automatable amplification and sequencing of insert end frag-
ments from P1 and YAC clones for chromosome walking.
Genomics 1995, 25:674-681.
65. Li L, Zhao Y, McCaig BC, Wingerd BA, Wang J, Whalon ME, Pichersky
E, Howe GA: The tomato homolog of CORONATINE-
INSENSITIVE1 is required for the maternal control of seed
maturation, jasmonate-signaled defense responses, and
glandular trichome development. Plant Cell 2004, 16:126-143.