Báo cáo y học: "Transcript copy number estimation using a mouse whole-genome oligonucleotide microarray" potx
Bạn đang xem bản rút gọn của tài liệu. Xem và tải ngay bản đầy đủ của tài liệu tại đây (303.24 KB, 12 trang )
Genome Biology 2005, 6:R61
comment reviews reports deposited research refereed research interactions information
Open Access
2005Carteret al.Volume 6, Issue 7, Article R61
Method
Transcript copy number estimation using a mouse whole-genome
oligonucleotide microarray
Mark G Carter
*
, Alexei A Sharov
*
, Vincent VanBuren
*
,
Dawood B Dudekula
*
, Condie E Carmack
†
, Charlie Nelson
†
and
Minoru SH Ko
*
Addresses:
*
Developmental Genomics and Aging Section, Laboratory of Genetics, National Institute on Aging, National Institutes of Health,
333 Cassell Drive, Baltimore, MD 21224, USA.
†
Agilent Technologies, Deer Creek Rd, Palo Alto, CA 94304, USA.
Correspondence: Minoru SH Ko. E-mail:
© 2005 Carter et al.; licensee BioMed Central Ltd.
This is an Open Access article distributed under the terms of the Creative Commons Attribution License (
which permitsunrestricted use, distribution, and reproduction in any medium, provided the original work is properly cited.
Transcript copy number estimation by microarray<p>An <it>in-situ</it>-synthesized 60-mer oligonucleotide microarray designed to detect transcripts from all mouse genes is presented. Exogenous RNA controls derived from yeast allow quantitative estimation of absolute endogenous transcript abundance</p>
Abstract
The ability to quantitatively measure the expression of all genes in a given tissue or cell with a single
assay is an exciting promise of gene-expression profiling technology. An in situ-synthesized 60-mer
oligonucleotide microarray designed to detect transcripts from all mouse genes was validated, as
well as a set of exogenous RNA controls derived from the yeast genome (made freely available
without restriction), which allow quantitative estimation of absolute endogenous transcript
abundance.
Background
One of the most tantalizing promises of gene-expression pro-
filing technology has been to develop assays that measure
expression of all genes in a given species [1]. This is especially
important for the mouse, which is a standard model for vari-
ous human diseases. The early and rapid development of
murine bioinformatics resources such as the draft genome
assembly [2] and numerous expressed sequence tag (EST)
projects have bolstered the feasibility of developing such
microarray platforms for the mouse. However, because it has
been difficult to identify all murine genes and correctly group
genomic and expressed sequences into genes and transcripts,
microarray platforms intended to cover all mouse genes are
only now being made widely available, long after the draft
assembly was released.
Relatively recent microarray technologies, which require
sequence information instead of clones as input, allow
investigators to design microarray platforms to detect genes
without having to obtain clones, including genes which have
yet to be cloned or confirmed as an expressed transcript [3].
Platforms that utilize long oligonucleotides give high sensitiv-
ity, with the potential for transcript specificity sufficient to
distinguish transcripts from the same locus or closely related
gene-family members [4,5].
While microarray-based methods can provide very accurate
relative (ratio-based) expression measurements, they usually
do not provide absolute expression measurements (that is,
transcript copy number). One notable exception described in
the literature does provide absolute expression measure-
ments in yeast, but not as copy numbers [6]. That method
relies on labeled oligonucleotides complementary to common
sequence in each cDNA probe, which are hybridized against
each slide as the reference target. In the case of long-oligonu-
cleotide-based microarrays, there is no sequence common to
Published: 30 June 2005
Genome Biology 2005, 6:R61 (doi:10.1186/gb-2005-6-7-r61)
Received: 31 December 2004
Revised: 27 April 2005
Accepted: 25 May 2005
The electronic version of this article is the complete one and can be
found online at />R61.2 Genome Biology 2005, Volume 6, Issue 7, Article R61 Carter et al. />Genome Biology 2005, 6:R61
all probes, so such a strategy is not feasible. An appropriate
approach for such microarray platforms is to monitor the
hybridization behavior of a few spiked-in RNA controls with
sequence derived from yeast or other genomes. Control tran-
script probe intensity data can be used to create a generalized
dose-signal model and applied to endogenous transcript
intensity data to give transcript abundance estimates. Not
only would such absolute expression measurements from
microarrays help determine what level of sensitivity is
required for downstream validation methods, but they would
also allow direct comparison of expression data generated
using different methods, as well as a valuable mechanism to
compare performance between slides, platforms, or experi-
ments [7]. Most importantly, global absolute expression
measurements can be used to more fully describe a given
transcriptome, perhaps identifying mRNAs present at less
than one copy per cell as candidates for heterogeneous or cell-
type-specific expression, or subdividing groups of genes in
Gene Ontology (GO) nodes [8] based on transcript
abundance.
The work described here is focused on two goals, aimed at
facilitating standardization and comparison among mouse
microarray studies: first, to create a long-oligonucleotide-
based microarray platform covering all identified mouse
genes, which can be made widely available; and second, to
develop exogenous RNA controls which will allow quantita-
tive estimation of absolute endogenous transcript abundance.
The microarray will be made available to the community
through Agilent Technologies and exogenous control plasmid
vectors will be available upon request from the authors and
the American Type Culture Collection (ATCC) (ATCC MBA-
201 to -207) without restriction, to be used with the design
presented here or incorporated into any non-yeast micro-
array platform.
Results and discussion
The development of a mouse whole-genome microarray in
our laboratory has been an ongoing effort, and each new
design has been derived in part from its predecessor (see
Additional data files 1 and 2 and Materials and methods for
details) [9]. Development of the National Institute on Aging
(NIA) Mouse Gene Index [10] facilitated more complete, less
redundant microarray design than EST clustering alone for
the following reasons. First, clustering was mapped to the
genome assembly, improving consolidation of transcriptional
units. Second, transcript selection is no longer restricted to
library contents, allowing genes absent from NIA cDNA clone
collections [11] to be included from other public sequence col-
lections. Finally, all potential splice variants were solved from
EST alignments with genomic sequence, so that probes can be
designed to common regions in a transcript family, minimiz-
ing the effect of differential splicing. Therefore the index has
been the basis of gene/transcript identification and sequence
selection for all oligonucleotide array designs subsequent to
the NIA Mouse 22K Microarray v1.1. During the preparation
of this paper, assembly of a long-oligonucleotide microarray
platform with full coverage of the mouse genome was
reported by Zhang et al. [12] using a sequence selection pro-
tocol that incorporated all National Center for Biotechnology
Information (NCBI) RefSeq entries, including all mRNA tran-
scripts based solely on prediction algorithms, without exper-
imental evidence of expression (XM sequences). In contrast,
our protocol included only a minority of the XM sequences
(only those annotated as an identified gene).
As our oligonucleotide probe design and selection process dif-
fered slightly from protocols previously used with ink-jet
microarrays, we first established that our oligonucleotide
probes perform as well as or better than those designed with
standard protocols [5,9,13]. To assess the overall perform-
ance of the oligonucleotide probes, we carried out a mixing
experiment, combining total RNA from E12.5 mouse embryos
and placentas to produce a range of gene-expression ratios for
each transcript, using a preliminary microarray design (NIA
Mouse 22K Microarray v2.0, see Additional data files 1 and 2
for details). In a comparison of E12.5 mouse embryo and pla-
cental RNA, statistically significant differential expression
was detected for 8,461 of the test array's 21,044 oligonucle-
otide probes. These differential targets were then examined in
the mixtures to calculate observed placental RNA fractions.
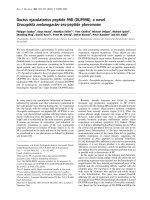
Figure 1 shows that the distributions of the observed placental
RNA fractions at each input level were closely matched with
the input placental RNA fractions (median observed fraction
= input fraction ± 0.075), and the boundaries of 95% confi-
dence regions were 0.121 to 0.405 from the median. These
distributions were consistent with, although narrower than,
those seen in a similar study [13] using standard oligonucle-
otide design procedures, suggesting that our design protocol
produces comparable results. More importantly, these data
suggest that the oligonucleotide probes are capable of highly
quantitative, proportional measurements of transcript abun-
dance, a property required for transcript abundance
estimation.
Exogenous RNA control transcripts were developed from
Saccharomyces cerevisiae intronic and intergenic sequences
[14,15]. A total of 11 candidate sequences were cloned and
tested against multiple oligonucleotide probes in preliminary
microarray hybridizations (data not shown). After assessing
which target/probe pairs produced the best dynamic
responses to abundance with the lowest noise, seven control
transcripts and corresponding oligonucleotide probes (Tables
1 and 2) were selected for use in the control set. As a result, the
NIA Mouse 44K Microarray v2.0 contains all 63 oligonucle-
otide probes considered as controls, while version 2.1, the
final version which will be made available to the community,
contains only the seven selected for use, spotted ten times
each at different locations on the slide. Loading of each con-
trol transcript into total RNA was confirmed as accurate
within 2.6-fold by quantitative real-time RT-PCR (qPCR)
Genome Biology 2005, Volume 6, Issue 7, Article R61 Carter et al. R61.3
comment reviews reports refereed researchdeposited research interactions information
Genome Biology 2005, 6:R61
(Figure 2a), with a very tight correlation (r
2
≥ 0.99) between
expected and measured values over seven orders of
magnitude.
One basic assumption made in our experimental design is
that amplification efficiencies are approximately equal
between endogenous mouse transcripts and exogenous yeast
control transcripts. To test this, transcript abundances were
determined by qPCR for cDNA pools synthesized from total
RNA with spike-in controls added, as well as labeled cRNA
target mixtures amplified from the same total RNA/spike-in
control mixtures, and transcript abundances were deter-
mined by qPCR. After linear amplification, individual ratios
of each control transcript to the endogenous transcript
Dnchc1 (Table 3) were within 3.5-fold (average = 1.98-fold) of
those prior to amplification (Figure 3), and the slopes of
regression lines for pre- and post-amplification datasets were
0.967 and 0.992, respectively. Results were consistent
whether using amplification yield versus input or the increase
in Dnchc1 transcripts as measured by qPCR to calculate the
fold amplification and fraction of the original sample repre-
sented by each qPCR well. The stability of the relationship
holds over seven orders of magnitude, suggesting that ampli-
fication of transcripts during cRNA microarray target synthe-
sis is not a source of significant bias. In previous attempts
using control transcripts with short (20-40 nucleotides) vec-
tor-derived poly(A) tails, exogenous controls amplified one or
two orders of magnitude less efficiently than endogenous
messages (data not shown), indicating that sufficient polya-
denylation of controls is critical for efficient amplification.
Microarray expression profiles were generated for three dis-
tinct samples each of total RNA from E12.5 whole embryos
(EM), E12.5 placenta (PL), R1 embryonic stem cells (ES), and
GFP-Exe trophoblast stem cells (TS) [16]. For each microar-
ray, linear regression analysis on mean normalized
log
10
[intensity] values for seven yeast spike-in control probes
was used to define a standard curve relating signal intensity
to copy number (Figure 2b) for estimation of endogenous
transcript abundances. Correlations were very strong
between log
10
[intensity] and log
10
[input copy number], with
r
2
≥ 0.95.
To test the accuracy of estimating transcript abundance in
this way, we compared the results with qPCR measurements
for a panel of 13 endogenous transcripts (Figure 4). Most (36
of 52, or 69.2%) of the microarray-based transcript copy-
number estimates for a panel of 13 endogenous genes were
within fivefold of qPCR measurements. Furthermore, trend-
ing for each transcript across the four tissue types was con-
sistent between the two methods for all ten non-
housekeeping genes showing differential expression.
Many factors are likely to affect the accuracy of transcript
abundance estimates. Measurements at or near the microar-
ray's detection limit, but still above that of qPCR assays (Fig-
ure 4, Lpl and Axl in TS, filled arrows), tend to overestimate
transcript abundance, and these data suggest that the lower
limit of microarray-based transcript abundance measure-
ment is approximately 0.05 to 0.06 copies per cell in this
experiment. Differential transcript splicing can also have an
effect: note that for Ank, H19, Hand1, and Igf2bp3 (Figure 4,
open arrows), only one tissue out of four shows greater than a
tenfold discrepancy, whereas the other measurement pairs
are more closely matched. Given the preceding discussion, we
present this method as a way to estimate transcript abun-
dances for groups of genes. Accuracy of the estimates for each
gene/probe may be further improved in the future by study-
ing the effects of various probe-selection parameters on
measured fluorescence intensity.
Using conservative estimates of the total RNA content recov-
ered from mammalian cells (2.0-3.0 pg/cell in this case, see
Materials and methods), transcript abundances were
expressed on a copies-per-cell basis (Figure 5). The analysis
60-mer oligonucleotide probe linearity testingFigure 1
60-mer oligonucleotide probe linearity testing. To test the performance of
21,044 60-mer oligonucleotide probes, E12.5 embryo RNA and placenta
RNA were combined to form five pairs of duplicate samples containing
from 0 to 100% placental RNA. Box-plot distribution data for each
placental RNA input level is shown above, with median values labeled. The
boxes show the 25-75 percentile range, with the mean and median
indicated by the central straight line and diamond, respectively. Upper and
lower bars show the 2.5 to 97.5 percentile range. Observed fraction
medians are within 0.075 of input values, and 95% of values are within
0.405 of input values.
0.00 0.25 0.50 0.75 1.00
Median = 0.053
0.239
0.425
0.698
1.068
Observed fraction of placental RNA
Known fraction of placental RNA
−0.25
0.00
0.25
0.50
0.75
1.00
1.25
1.50
R61.4 Genome Biology 2005, Volume 6, Issue 7, Article R61 Carter et al. />Genome Biology 2005, 6:R61
revealed two striking properties of these transcript-abun-
dance distributions. First, mRNA populations in mammalian
tissues are highly complex, which is consistent with previous
observations [17,18]. Many transcripts were measured at less
than one copy per cell in each tissue (EM = 40.1 ± 0.6%, PL =
46.9 ± 1.3%, ES = 48.2 ± 1.9%, TS = 47.4 ± 3.4%) (Figure 5).
A log
10
[intensity] value of 2.5 was used as a lower cutoff,
which corresponds to about one copy in 26 cells, so it appears
that measured values from 0.038 to one copy per cell repre-
sent transcripts present at very low measurable copy num-
bers, rather than nonexpressed transcripts. Indeed,
quantitative RT-PCR studies in yeast have shown that many
Table 1
Yeast controls used in this study with corresponding qPCR primers
Yeast intronic/intergenic
control transcript
Vector name ATCC
number GenBank
Accession
Insert size
(bp)
Copies spiked/5
µg total RNA
Forward/reverse qPCR oligo sequence Optimal
concentration
Amplicon Intron
spanned?
Size T
m
YPL075W_16_412249_41
5357_INTRON_9_759
pNIAysic-1 MBA-201
DQ023287
630 1.00E+04 5'-
CCTACTTGATAAAGCCACATACCTCTA
CCTCTTCTATTAG-3' 5'-
TTGCGTTACTCTATTAATAATCCATAG
TTGGAAC-3'
300 nM
50 nM
134 bp 73.4°C No
YPL081W_16_404945_40
6039_INTRON_8_508
pNIAysic-2 MBA-202
DQ023288
400 1.00E+05 5'-
CGACACTTCAGGTAAAGCGTTCCGAA
GTAATTCAAC-3' 5'-
TCTCAAACCTAACACATTTCTGTATTA
AGCCTAG-3'
300 nM
300 nM
129 bp 75.8°C No
NOT:D_1493031-
1494574_553-1543
pNIAysic-3 MBA-203
DQ023289
997 1.00E+06 5'-
TTACCATTCACTCCATGATGTCGTACC
TGTTACACTAC-3' 5'-
CGGTACATGTTATTACCAGAAAAAGAT
GTATATCC-3'
300 nM
300 nM
145 bp 79.8°C No
YER133W_5_432491_433
954_INTRON_178_702
pNIAysic-4 MBA-204
DQ023290
428 1.00E+07 5'-
GTCGAGATAGCCGAGATAATGTGTGT
G-3' 5'-
GCAAGGGGGATTTTTCTGAATATGG-3'
300 nM
300 nM
136 bp 76.5°C No
YNL162W_14_331319_3
32151_INTRON_5_516
pNIAysic-5 MBA-205
DQ023291
367 1.00E+08 5'-
TGCAGCAACAGAGTATCATATGCATG
G-3' 5'-
CACTGCACAATCTGAAGATAGCGAGG-
3'
300 nM
300 nM
145 bp 77.7°C No
YNL302C_14_62942_619
57_INTRON_21_571
pNIAysic-6 MBA-206
DQ023292
416 1.00E+09 5'-
ATTTCCCATTACCTGATAAATTGAAGT
TCATC-3' 5'-
TTTGTATAGTTGGCTCAAAATATTCTC
TCCAC-3'
900 nM
300 nM
100 bp 73.8°C No
YBL087C_2_60732_5981
5_INTRON_43_546
pNIAysic-7 MBA-207
DQ023293
436 1.00E+010 5'-
GCAGATGAAGTGATACCTGTCAATATT
CATG-3' 5'-
AGAAATAACATTTCGATGGTTATCCAT
TAGTATG-3'
300 nM
300 nM
128 bp 76.2°C No
Table 2
Yeast controls with corresponding in situ-synthesized 60-mer oligonucleotide probes
Control transcript NIA probe ID 60-mer oligonucleotide microarray probe sequence
NIA yeast control 1 Z10000036-1 5'-TTCAAGGGACAAATAACAGGATAAAACGTAATGTCAGGACACAAAGTGTGCCATCAACTT-3'
NIA yeast control 2 Z10000039-1 5'-TCTTCATAGAATACTTTTTTTTTCGGAGAAAACCTTTACACTGAACTCCCGACACTTCAG-3'
NIA yeast control 3 Z10000041-1 5'-TTTAATTATTCTTATTTCGCTTTTTTTCTCAAGGTGACCTGTTGTATCACGTTAGCTGAA-3'
NIA yeast control 4 Z10000020-1 5'-TCATCCGGCCGGCGCCTCCCATATTCAGAAAAATCCCCCTTGCTCACACTAAAAAAAGAA-3'
NIA yeast control 5 Z10000021-1 5'-TCAGATTGTGCAGTGATATTCTTTGAGGAAGGAAACGTAGAGGGGATAAGTTGGATAACT-3'
NIA yeast control 6 Z10000026-1 5'-CATTTACCGAACGAATGAGTTAAACTATTATGATATAATTGCTGTAATTGTGGAGAGAAT-3'
NIA yeast control 7 Z10000002-1 5'-AAAGTAAAGTTCCAAGATTTCATTTTGCTGGGTACAACAGAATTAAACAGAGGTTTAAAA-3'
Genome Biology 2005, Volume 6, Issue 7, Article R61 Carter et al. R61.5
comment reviews reports refereed researchdeposited research interactions information
Genome Biology 2005, 6:R61
genes, particularly transcription factors, are expressed at less
than one copy per cell [19]. Furthermore, our estimates of
numbers of expressed genes/transcripts and mRNA message
content per cell (519,688 to 851,087 mRNAs per cell, 8,357 to
12,739 transcripts, expressed from 8,101 to 11,360 genes,
Table 4) compare well with previous estimates ranging from
200,000 to 600,000 mRNAs per cell [20,21], consisting of
11,500 to 15,000 diverse mRNA species [18,20], transcribed
from as many or more genes up to 17,000 [18,20,22]. Second,
a majority of transcripts expressed in one tissue or cell type
are commonly expressed in other diverse cell and tissue types.
The number of expressed genes in each tissue was estimated
by counting the number of microarray features measuring
absolute expression of at least one copy per cell, and convert-
ing this set of microarray probes to U-clusters (loci) and tran-
scripts via the NIA Mouse Gene Index (Table 4). Examination
of the overlap between each cell type's roster of expressed
genes and transcripts reveals that the majority are expressed
in common (Tables 4 and 5), as suggested by previous assess-
ments of mRNA complexity [18,20,22]. For example, 93% of
expressed placental transcripts are also expressed in embryo,
and this group represents 72% of the expressed transcripts in
embryo (Table 5). The same relationship holds true for pair-
ings of cultured cells with embryo, with 95% of expressed
transcripts in cultured cells also found in embryo, covering
69% of embryonic transcripts.
When comparing frequency distributions for complex, in vivo
samples and less complex in vitro cultured cells, we might
expect to see large differences, particularly in the case of
genes expressed at less than one copy per cell. Transcripts
present at less than one copy per cell cannot be present in
every cell, and therefore must be expressed heterogeneously.
As might be expected, whole embryos had the most distinc-
tive frequency distribution of the four samples examined:
embryos had significantly fewer transcripts in the range
log
10
[copies per cell] = -1.0 (0.1 copies per cell), but signifi-
cantly more in the 0-2 (1 to 100 copies per cell) range. This
difference, combined with the higher estimate of total tran-
scripts per cell for whole embryos (Table 4), may reflect the
activation, within the context of the very high transcriptional
activity present in developing embryos, of many developmen-
tal pathways that are normally inactive or minimally active.
In contrast, the high degree of similarity between the fre-
quency distributions for placenta, ES, and TS cells (Figure 5)
Relating yeast spike-in RNA control copy number to qPCR measurements and microarray signal intensityFigure 2
Relating yeast spike-in RNA control copy number to qPCR measurements and microarray signal intensity. (a) To verify abundances of yeast sequence
RNA transcripts in a control mixture, cDNA was transcribed from the control mixture alone (open boxes), as well as E12.5 whole-mouse embryo total
RNA (open diamonds) and Universal Mouse RNA (filled triangles) with added spike-in control mixture. The cDNA was used as template for real-time PCR
quantitation of each yeast sequence RNA, using a separately prepared standard of cDNA transcribed from the yeast sequences. Expected and measured
copy numbers are closely matched (r
2
≥ 0.99), with maximum measured/observed ratios of 1.5, 1.5, and 2.6, respectively. (b) Expression profiles were
generated for triplicate total RNA samples from E12.5 embryo (filled circles), E12.5 placenta (open circles), ES cells (filled boxes), and TS cells (open
boxes) with yeast sequence control transcripts spiked-in prior to target labeling. For the seven control transcripts, mean log
10
[intensity] is shown for each
tissue type, as well as the mean across all samples (filled triangles), and these data were used to perform linear regression analysis and relate signal intensity
to transcript copy number, allowing abundance estimation for endogenous transcripts. The regression line for the average of all tissues (dashed line) and
its equation is shown. Intensity-copy number correlations for individual tissues were very strong, with r
2
values of 0.98 - 0.99.
34567891011
10456789
Embryo + spike-ins
Spike-ins only
UMR + spike-ins
log
10
[measured copies/5 µg RNA]
Mean log
10
[normalized signal intensity]
EM
PL
ES
TS
Mean
y = 0.571x + 0.6154
R^2 = 0.9941
3
4
5
6
7
8
9
10
11
log
10
[expected copies/5 µg RNA] log
10
[copies input/5 µg RNA]
2
3
4
5
6
7
(a) (b)
R61.6 Genome Biology 2005, Volume 6, Issue 7, Article R61 Carter et al. />Genome Biology 2005, 6:R61
suggests that levels of expression heterogeneity can be similar
for complex tissues and cultured cells. In fact, there is evi-
dence in ES cells that gene expression within a culture is not
as uniform as previously supposed, and even key
differentiation markers such as Oct4 and cKit are expressed
in cellular subpopulations within cultures [23]. Taken
together, these observations suggest that cultured ES and TS
cells, although clonally isolated, are quite heterogeneous in
terms of their gene-expression patterns, with a transcrip-
tional complexity similar to that of E12.5 placenta. Further
study, perhaps using in situ hybridization or single-cell RT-
PCR methods, will be required to address this issue, but it
does beg the question of whether or not this heterogeneity is
common to all cultured cells, or a feature specific to pluripo-
tent stem cells.
Conclusion
Here we present an oligonucleotide microarray for gene-
expression profiling with representation of the entire mouse
genome, according to the NIA Mouse Gene Index version 2.0
[24]. An integral feature of this new whole-genome microar-
ray design is a set of probes detecting yeast spike-in control
transcripts, which will be available to the community without
restriction. Using qPCR, we have shown that this control sys-
tem allows the reproducible estimation of absolute transcript
levels. A valuable tool for the mammalian functional genom-
ics community, this system is a step towards standardization
of microarray results by using exogenous RNA control sys-
tems that are compatible with multiple microarray platforms
and model organisms.
Materials and methods
Microarray design: target sequence selection
The NIA Mouse 44K Microarray v2.0 (Whole Genome 60-
mer Oligo) design was based on the NIA Mouse Gene Index
v2.0 [24]. Like the first version of the NIA Mouse Gene Index
[10], it combines data from multiple transcript databases
(RefSeq, Ensembl, Riken, GenBank, and NIA) to construct
gene/transcript models which represent all possible tran-
scripts. Briefly, 249,200 ESTs developed at NIA were clus-
tered using clustering tools from The Institute for Genome
Reserach (TIGR) [25], generating 58,713 consensus and sin-
gleton sequences which were then combined with the other
datasets. The major difference in version 2 from version 1 is
the use of a clustering method based on genome alignments
rather than sequence homology between NIA EST clusters
and public sequences. Individual sequences were aligned to
the mouse genome [2] using BLAT [26], then clustered by an
algorithm similar to the one described by Eyras et al. [27], to
be published elsewhere. Our assembly included 30,796
primary genes and 1,318 gene copies or pseudogenes, as well
as 28,928 clusters that did not match our criteria for high-
confidence genes (open reading frame (ORF) of more than
100 amino acids or multiple exons). There were 65,477 tran-
scripts associated with primary genes. Because transcripts
were built from sequence alignments to the mouse genome,
they match published genomic sequences [2] (February 2003
edition) exactly.
Microarray design: oligonucleotide probe design and
selection
In designing a mouse whole-genome microarray, we began by
examining existing designs - the NIA Mouse 22K Microarray
v1.1 (Development 60-mer Oligo) [9], which became
commercially available from Agilent as the Agilent Mouse
(Development) Oligonucleotide Microarray (see Additional
data files 1 and 2), and the National Institute of Environmen-
tal Health Sciences (NIEHS) Toxicogenomics Consortium
mouse array (Agilent Mouse Microarray). Criteria for select-
ing previously designed probes included a good match to the
target gene's major transcript with the longest ORF, mini-
mum predicted cross-reactivity with other expressed
sequences, and nonredundancy. Although a perfect match of
all 60 base-pairs (bp) of the oligonucleotide was preferred, we
also accepted up to two mismatches to the genome if the oli-
gonucleotide matched perfectly to the RefSeq sequence, and
oligonucleotide sequences that did not match 100% to the
Exogenous control and endogenous transcript amplification rates are closely matched over seven orders of magnitudeFigure 3
Exogenous control and endogenous transcript amplification rates are
closely matched over seven orders of magnitude. Transcript abundance of
each spike-in control transcript was measured by qPCR before and after
linear amplification labeling, and compared to amounts of the exogenous
transcript Dnchc1. After amplification, individual ratios of each control
transcript to the endogenous transcript were within 3.5-fold (average =
1.98-fold) of those prior to amplification. Blue diamonds = log
10
[ratio
mean control/Dnchc1 transcripts] of three E12.5 embryo and three E12.5
placenta samples before amplification. Red boxes, green triangles =
log
10
[ratio mean control/Dnchc1 transcripts] for the same samples after
amplification, using yield versus input (red boxes) or the increase in
Dnchc1 transcripts as measured by qPCR (green triangles) to calculate the
fraction of the original sample represented by each qPCR well.
log
10
[control abundance/Dnchc1 abundance]
log
10
[copies/cell]:qPCR
−6
−5
−4
−3
−2
−1
0
34567891011
1
2
Genome Biology 2005, Volume 6, Issue 7, Article R61 Carter et al. R61.7
comment reviews reports refereed researchdeposited research interactions information
Genome Biology 2005, 6:R61
RefSeq entry were corrected. An oligonucleotide was consid-
ered cross-reactive if its last 43 bp (solution end) matched to
a non-target gene with less than five mismatches. Deletion
placement studies using in-situ synthesized 60-mer oligonu-
cleotide probes suggest that the 17 bp at the support surface
have a negligible effect on hybridization intensity [5]; thus
only the external 43 bp were considered important. While the
cross-reactivity criterion is easily satisfied for unique genes
with low similarity to other genes, many gene families had
high sequence similarity between member transcripts, and it
was impossible to find regions with low predicted cross-reac-
tivity. In this case we considered the whole gene family as a
target; then the oligonucleotide was considered cross-reac-
tive only if it matched to genes outside the family. Gene fam-
ilies were assembled using a 30% transcript length alignment
as a threshold of similarity; alignments for each pair of tran-
scripts were generated using BLAT [26]. According to the
nonredundancy criterion, we left only one oligonucleotide
that matched to each gene or gene family, and when probes
from both the NIA Mouse 22K v1.1 and NIEHS Toxicogenom-
ics arrays matched well to the same gene, preference was
given to the NIA oligonucleotide.
After filtering with the above criteria, we obtained 6,563
probes from the NIA Mouse 22K Microarray v1.1 and 9,551
probes from the NIEHS Toxicogenomics array. Among these
oligonucleotides, 3,327 did not match the target gene's major
transcript with the longest ORF, so we generated an addi-
tional 3,327 probes for major transcripts of the same genes.
Then we generated 22,850 probes for the best transcripts of
Validation of transcript abundance estimation for endogenous transcriptsFigure 4
Validation of transcript abundance estimation for endogenous transcripts. qPCR primer sets were designed for selected genes so that amplicons were
upstream of 60-mer oligonucleotide probes when possible, or less than 650 bp downstream, and copy number was estimated using serial dilutions of RNA,
in vitro transcribed from mouse cDNAs, at known copy numbers as standards. Error bars represent one standard deviation across three replicate samples
for each tissue. Dotted diagonal lines represent five- and tenfold differences between the two datasets. Each gene's official symbol, along with the unique
identifier for the 60-mer oligonucleotide probe it was measured with, are listed in the key. Data was normalized to Gapd expression for both methods. EM
= E12.5 embryo, PL = E12.5 placenta, ES = embryonic stem cells, TS = trophoblast stem cells.
−3 −2 −101 2 3
log
10
[copies/cell]:microarray
log
10
[copies/cell]:qPCR
Color Gene Oligo ID
Ank Z00013595-1
Axl Z00030401-1
Cd34 Z00011405-1
Gap43 Z00013064-1
Gapd Z00027268-1
H19 Z00005273-1
Hand1 Z00046756-1
Hif1a Z00000975-1
Hmga1 Z00034677-1
Hprt Z00035388-1
Igf2bp3 Z00010932-1
Lpl Z00023659-1
Myo1b Z00012962-1
Shape Tissue type
EM
PL
ES
TS
−2
−1
0
1
2
3
R61.8 Genome Biology 2005, Volume 6, Issue 7, Article R61 Carter et al. />Genome Biology 2005, 6:R61
primary genes in the gene index that were not represented in
the NIA Mouse 22K Microarray v1.1 (Development 60-mer
Oligo) and NIEHS Toxicogenomics arrays, for a total of
42,291 non-control oligonucleotide probes (see Additional
data file 2). For each transcript we generated ten probes using
ArrayOligoSelector [28], then selected the best oligonucle-
otide on the basis of minimum predicted cross-reactivity,
proximity to the 3' end, and degree of matching to RefSeq or
GenBank sequences. The latter criterion was important only
in cases of mismatches between genomic sequence and Ref-
Seq or GenBank.
All microarray data described in this report were generated
using the NIA Mouse 44K Microarray v2.1 (Whole Genome
Table 3
qPCR primer pairs used to quantitate endogenous transcripts in this study
Gene symbol Forward/reverse qPCR oligo sequence Optimal concentration Amplicon Intron spanned?
Size T
m
Ank 5'-AGTACCATAGTACACTCGGTTACCTGTCCTG-3' 900 nM 114 bp 78.8°C Yes
5'-GCAAAGCTTTAAGTCGTAATCTAGCATCC-3' 50 nM
Axl/Ufo 5'-CGACTACCTGCGTCAAGGAAATCG-3' 300 nM 112 bp 82.8°C Yes
5'-AAAACTTGGCCGGTCTCGAGG-3' 300 nM
Cd34 5'-TGCTCTGGAATCCGAGAAGTGAGG-3' 300 nM 140 bp 78.0°C Yes
5'-TCAGCCTCAGCCTCCTCCTTTTC-3' 300 nM
Dnchc1 5'-AACTAAACCCAGCCATTCGGCC-3' 300 nM 98 bp 84.3°C No
5'-TTGCGTTGGCGGGTGACAG-3' 900 nM
Gap43 5'-GAGAAGGGAAGGAGAGAAGGCAGG-3' 900 nM 131 bp 79.5°C Yes
5'-TCCGGCTTGACACCATCTTGTTC-3' 900 nM
Gapd 5'-CGGAGTCAACGGATTTGGTCGTAT-3' 900 nM 214 bp 82.6°C Yes
5'-GAAGATGGTGATGGGCTTCC-3' 300 nM
H19 5'-AGCTAACACTTCTCTGCTGCTCTCTGG-3' 300 nM 144 bp 81.4°C Yes
5'-ATCTTCTTGATTCAGAACGAGACGGAC-3' 900 nM
Hand1 5'-GAGATGTATACCTGAGAGCAACAGGCATGATAGGTAG-3' 300 nM 113 bp 75.1°C No
5'-CTTCTCCTTCATTTCTTTCCTTTTCCTTC-3' 900 nM
Hif1a 5'-GTCAGCAGTACATGGTAGCCACAATTG-3' 900 nM 139 bp 74.4°C No
5'-GATCCAGGCTTAACAATTCCATAGGC-3' 300 nM
Hmga1 5'-AATTCAGGAGGATGAACATCTGACGC-3' 900 nM 114 bp 77.3°C No
5'-TCTGTTCACAAACTACCTCTGGACGG-3' 50 nM
Hprt1 5'-AACAATGCAAACTTTGCTTTCCCTG-3' 300 nM 123 bp 80.1°C Yes
5'-TCAAATCCAACAAAGTCTGGCCTG-3' 300 nM
Igf2bp3 5'-AAGTATACATTCTCACAGAGACAGGATCGAGTGACTG-3' 900 nM 126 bp 81.5°C No
5'-AAAGACAGATTTGCTTAACCAACAGACG-3' 900 nM
Lpl 5'-TTTCCAGCCAGGATGCAACATTG-3' 300 nM 105 bp 82.3°C No
5'-TGAATGGAGCGCTCATGCGAG-3' 900 nM
Myo1b 5'-AATACACACCTTGTACCAATCAGCTCTCTC-3' 900 nM 143 bp 76.1°C No
5'-TGATAAGAAGAGGCTGAGAGCCGTTC-3' 900 nM
Genome Biology 2005, Volume 6, Issue 7, Article R61 Carter et al. R61.9
comment reviews reports refereed researchdeposited research interactions information
Genome Biology 2005, 6:R61
60-mer Oligo) and NIA Mouse 22K Microarray v2.0 (Devel-
opment 60-mer Oligo). We have slightly modified the probe
content of the NIA Mouse 44K v2.0 array by including
Agilent's standard QC probe set, removing candidate spike-in
control probes which were not used, and including additional
probes for known genes that have existing probes with poor
performance or ambiguous targeting. The updated version
(NIA Mouse 44K Microarray v2.1 (Whole Genome 60-mer
Oligo) will be made available to the community (see Addi-
tional data file 1).
Yeast spike-in controls
Yeast (S. cerevisiae) sequences were selected from public
repositories [14,15] to produce exogenous RNA control tran-
scripts, commonly referred to as 'spike-in' controls. Fourteen
candidates (ten intergenic and four intronic) were selected on
the basis of sequence length and the absence of restriction
endonuclease cleavage sites important for our cloning
strategy. Sequences with significant matches to transcripts in
the NIA mouse Gene Index v2.0 [10] were discarded, and ten
of the 14 remaining candidates were successfully cloned from
genomic DNA, with one sequence divided into two clones for
a total of 11 potential controls. Yeast sequences were ampli-
fied with added 5' SalI and 3' XbaI sites from S. cerevisiae
genomic DNA (ATCC 2601D) using Sigma RedTaq, and
cloned directly into pCR4-TOPO (Invitrogen). TA-TOPO
clones were verified by sequencing on an Applied Biosystems
3100 capillary DNA sequencer, and inserts were directionally
subcloned into pSP64 Poly(A) (Promega Catalog number
P1241) using the introduced SalI and XbaI sites. A total of 63
60-mer oligonucleotide 'sense-strand' probes were selected
for the 14 candidate sequences using both ArrayOligoSelector
software [28] and arbitrary manual selection. Oligonucle-
otide probes were compared to NIA Gene Index transcripts,
and no significant matches were found. Control probes were
spotted ten times each in various locations throughout the
slides.
Spike-in RNA was transcribed, polyadenylated, and purified
using Ambion mMessage mMachine, poly(A) tailing, and
MegaClear kits, then sized and quantitated by RNA 6000
Nano assay on an Agilent Bioanalyzer 2100. Spike-in RNAs
were pooled to create tenfold concentration differences, from
10
4
to 10
10
copies per microliter (Table 1). Before preparation
of microarray targets, 1 µl of this control transcript mixture
was added to 5-µg aliquots of each total RNA sample,
including the reference RNA. A separate pool with all yeast
control transcripts present at the same copy number was
added to reference RNA and converted to cDNA for use as a
standard in qPCR assays.
Table 4
Expressed genes and transcripts in developing mouse tissues and cultured stem cells
EM PL ES TS Any tissue All tissues
mRNAs/cell 851,087 519,688 400,045 568,196
Features ≥ 1 CpC 13,718 10,559 9,667 9,840 14,908 8,073
U-clusters ≥ 1 CpC 11,360 8,828 8,101 8,271 12,264 6,838
Transcripts ≥ 1 CpC 11,762 9,108 8,357 8,534 12,739 7,037
Mean copies per cell 1.09 0.63 0.51 0.56
Median copies per cell 0.79 0.45 0.36 0.40
U-clusters and transcripts from the NIA mouse gene index were considered expressed if microarray features measured absolute expression
estimated at one copy per cell or more. Copy-number estimates from expressed transcripts were summed to estimate the number of mRNA
molecules per cell for each tissue, as well as the mean and median copy numbers. Microarray features corresponding to expressed genes and
transcripts were mapped to the NIA Gene Index to calculate the number of U-clusters (loci) and transcripts expressed in each tissue.
Distribution of mouse transcript abundances in E12.5 embryo and placenta, and cultured ES and TS cellsFigure 5
Distribution of mouse transcript abundances in E12.5 embryo and
placenta, and cultured ES and TS cells. Transcript abundances are
expressed as log
10
[copies per cell], varying over six orders of magnitude.
The distributions are highly similar, despite the significant differences
between the four tissues (for example, monolayer culture versus tissue,
placenta versus embryo), suggesting that such distributions are not heavily
skewed according to tissue structure or function. The percentage of
transcripts present at less than one copy per cell ranged from 40.1 to
48.2% in the four tissues. Bins were centered on indicated values, and the
dotted lines indicate values corresponding to mean upper and lower signal
intensity reliability limits of one copy per 26 cells to 2,188 copies per cell.
For definitions of tissue type see Figure 4 legend.
log
10
[copies/cell]
Number of transcripts
EM
Tissue type
PL
ES
TS
−1.5 −0.5 0.5 1.5 2.5 3.5
0
1,000
2,000
3,000
4,000
5,000
6,000
7,000
8,000
R61.10 Genome Biology 2005, Volume 6, Issue 7, Article R61 Carter et al. />Genome Biology 2005, 6:R61
RNA collection/preparation
Total RNA was prepared using TriZol reagent (Invitrogen)
from E12.5 C57BL/6J embryos, pooled by litter, and corre-
sponding E12.5 C57BL/6J placenta pools [9]. Total RNA was
also prepared from R1 ES cells passaged briefly on gelatin to
remove feeder cells, and GFP-Exe TS cells grown on plastic in
conditioned medium as previously described [16]. Total RNA
quantity and quality were assessed by RNA 6000 Nano assay.
For oligonucleotide signal linearity testing, E12.5 embryo and
placenta total RNA were pooled, based on this quantitation,
to produce duplicate samples with 0, 25, 50, 75, and 100%
placental RNA content.
cRNA target labeling
Fluorescently labeled microarray targets were prepared from
2.5 µg aliquots of total RNA samples with yeast sequence con-
trol mixtures added as described above, using a Low RNA
Input Fluorescent Linear Amplification Kit (Agilent). A refer-
ence target (Cy5-CTP-labeled) was produced from Stratagene
Universal Mouse Reference RNA, and all other targets were
labeled with Cy3-CTP. Targets were purified using an RNeasy
Mini Kit (Qiagen) as directed by Agilent's clean-up protocol,
and quantitated on a NanoDrop scanning spectrophotometer
(NanoDrop Technologies).
Microarray hybridization
All hybridizations compared one Cy3-CTP-labeled experi-
mental target to the single Cy5-CTP-labeled reference target.
Microarrays were hybridized and washed according to Agi-
lent protocol G4140-90030 (Agilent 60-mer oligo microarray
processing protocol - SSC Wash, v1.0). Slides were scanned
on an Agilent DNA Microarray Scanner, using standard set-
tings, including automatic PMT adjustment.
Real-time quantitative RT-PCR
Primer sets were designed and tested for SYBR Green chem-
istry using an established in-house protocol [9]. Total RNA
was used to prepare cDNA as described previously [9].
Because the microarray targets were oligo(dT) primed, all
cDNA synthesis reactions were oligo(dT) primed as well, and
qPCR primer sets were designed so that amplicons were
upstream of 60-mer oligonucleotide probes when possible, or
less than 650 bp downstream. These steps were taken to min-
imize the effects of 3' end-labeling bias from microarray
target synthesis. Yeast spike-in standard curve cDNA was
prepared by mixing equal copy numbers of each synthetic
yeast RNA with Mouse Universal Reference total RNA,
followed by cDNA synthesis. A standard for copy-number
measurement of endogenous mouse genes was prepared by
transcribing cDNA clones and adding these transcripts in
equal numbers to yeast total RNA, followed by cDNA synthe-
sis. A BioMek 2000 liquid-handling system (Beckman) was
Table 5
Pairwise comparison of expressed transcript sets in developing mouse tissues and cultured cells
Total expressed features Overlapping features EM PL ES TS
13,718 EM 9,840 9,212 9,314
10,559 PL 8,508 8,881
9,667 ES 8,816
9,840 TS
Total expressed U-clusters Overlapping U-clusters EM PL ES TS
11,360 EM 8,271 7,749 7,853
8,828 PL 7,181 7,492
8,101 ES 7,435
8,271 TS
Total expressed transcripts Overlapping transcripts EM PL ES TS
11,762 EM 8,516 7,980 8,090
9,108 PL 7,386 7,718
8,357 ES 7,657
8,534 TS
Sets of microarray features measuring expressed genes (≥ 1 copy per cell) were compared pairwise to calculate the number of members common to
each pair. By matching microarray features to the NIA Gene Index, numbers of U-clusters (loci) and transcripts expressed in common were derived
for each pairwise comparison. Signal intensities which were lower than those for all spike-in controls, as well as saturated signals, were not
converted to copy number estimates (see Materials and methods), so these calculations may underestimate the number of expressed genes.
Genome Biology 2005, Volume 6, Issue 7, Article R61 Carter et al. R61.11
comment reviews reports refereed researchdeposited research interactions information
Genome Biology 2005, 6:R61
used to aliquot cDNA into 96- and 384-well plates, then
assemble and aliquot PCR master mix into 20-25 µl reactions.
Plates were run on ABI 7700 or ABI 7900 HT Sequence
Detection Systems using the default cycling program, and
data was processed using SDS 1.9 or SDS 2.2 software
(Applied Biosystems) and Microsoft Excel.
Data analysis
Microarray images were processed with Agilent Feature
Extractor A.7.5.1 software to generate normalized, back-
ground-subtracted feature intensities. Dye normalization was
performed by applying a LOWESS algorithm to all significant,
non-control and non-outlier features. Analysis of variance
(ANOVA) and replicate averaging was performed as previ-
ously described [9] using NIA Array Analysis Tool software
[29], which normalizes each probe according to reference
RNA signals.
For each probe identified as differentially expressed in mixing
experiments (false discovery rate < 0.05) [9], linear regres-
sions of ratios against pure placental RNA across the five lev-
els of placental RNA content were calculated, and observed
ratios were back-calculated for population analysis as
where P
oi
is the observed fraction placental RNA content cal-
culated from a given probe i, I
pi
and I
100i
are the normalized
log
10
[intensity] values for the probe i at placental RNA per-
centages p and 100, respectively, and a
i
and b
i
are the
intercept and slope of the ratios versus the input pla-
cental RNA fraction for probe i. For the population of
observed fractions at each input placental RNA fraction, the
mean and median were calculated, along with the 2.5, 25, 75,
and 97.5 percentile boundaries (Figure 1).
For endogenous transcript abundance estimation experi-
ments, linear regression analysis was performed on seven
yeast spike-in probe mean normalized log
10
[intensity] values
for each microarray and the results were used to back-calcu-
late estimated copy numbers for endogenous transcripts as
where C
hmi
is the microarray-estimated number of copies per
hybridization for probe i, I
i
is the normalized log
10
[intensity]
for probe i, and a and b are the intercept and slope of spike-in
control probe microarray signal intensities versus. input
spike-in transcript copy numbers. Dividing these values by
the estimated number of cells represented in each
hybridization,
converts them to estimates of transcript copies per cell.
Amounts of total RNA extracted per cell for the four tissue
types (EM 3.0 pg/cell, PL 2.0 pg/cell, ES 2.3 pg/cell, TS 3.0
pg/cell) were estimated from cell counts, RNA yields, and in
the case of E12.5 embryo and placenta, our estimate that the
average cell volume in these tissues is approximately 1.5 × 10
-
9
cm
3
per cell (data not shown).
For measurement of abundances of mouse endogenous gene
and spiked-in yeast transcripts in total RNA and labeled/
amplified target mixtures by qPCR, linear regression of
threshold cycle (C
t
) values versus input spike-in transcript
copy numbers in a standard was used to back-calculate copy
numbers per well of the transcripts in the total RNA samples
and labeled/amplified target mixtures. These results were
converted to copies per cell as follows:
In the case of endogenous mouse transcript measurements,
results from both the microarray and qPCR were normalized
to Gapd expression.
All microarray data will be deposited to the public repositor-
ies Gene Expression Omnibus at NCBI [30,31] and ArrayEx-
press at EBI [32,33] as soon as possible.
Additional data files
The following additional data are available with the online
version of this paper. Additional data file 1 is a table contain-
ing a standardized naming scheme for NIA oligonucleotide
microarray platforms. Additional data file 2 is a table contain-
ing additional information on previous NIA microarray plat-
forms and how they relate to that presented in this work.
Additional data file 3 contains annotation of all probes in the
NIA 44K Mouse Microarray v2.1.
Additional File 1A standardized naming scheme for NIA oligonucleotide microarray platforms.A standardized naming scheme for NIA oligonucleotide microarray platforms.Click here for fileAdditional File 2Additional information on previous NIA microarray platforms and how they relate to that presented in this work.Additional information on previous NIA microarray platforms and how they relate to that presented in this work.Click here for fileAdditional File 3Annotation of all probes in the NIA 44K Mouse Microarray v2.1Annotation of all probes in the NIA 44K Mouse Microarray v2.1Click here for file
Acknowledgements
The authors thank Peter Webb at Agilent Technologies for his assistance
in preparing the microarray design for production, and his colleague Paul
Wolber for advice in constructing the yeast spike-in control constructs.
Yong Qian of the NIA provided invaluable bioinformatics and computa-
tional support for many aspects of this work. We also thank Janet Rossant
and Tilo Kunath for providing ES and TS cell RNA. DNA microarrays pro-
duced according to NIA designs are available commercially from Agilent
Technologies. However, The National Institutes on Health and The
National Institute on Aging do not endorse these products or make any
claims or guarantees as to their quality or performance.
References
1. Ko MS: An 'equalized cDNA library' by the reassociation of
short double-stranded cDNAs. Nucleic Acids Res 1990,
18:5705-5711.
P
oi
=
−
I
I
a
b
pi
i
i
i
100
,
I
I
pi
i100
C
Ia
b
hmi
i
=
−
,
N
x
h
=×
0 750
1
1. g target
hybridization
target labeling
g ta
µ
µ
rrget yield
g total RNA
target labeling
pg
1 g
1 c
×××
y µ
µ1
10
6
eell
pg total RNAz
,
C
w
z
cqi
=× × ×
copies
well
1 well
ng total RNA
1 ng
1000 pg
pg tota
ll RNA
1 cell
.
R61.12 Genome Biology 2005, Volume 6, Issue 7, Article R61 Carter et al. />Genome Biology 2005, 6:R61
2. Waterston RH, Lindblad-Toh K, Birney E, Rogers J, Abril JF, Agarwal
P, Agarwala R, Ainscough R, Alexandersson M, An P, et al.: Initial
sequencing and comparative analysis of the mouse genome.
Nature 2002, 420:520-562.
3. Schadt EE, Edwards SW, GuhaThakurta D, Holder D, Ying L, Svetnik
V, Leonardson A, Hart KW, Russell A, Li G, et al.: A comprehensive
transcript index of the human genome generated using
microarrays and computational approaches. Genome Biol
2004, 5:R73.
4. Singh-Gasson S, Green RD, Yue Y, Nelson C, Blattner F, Sussman MR,
Cerrina F: Maskless fabrication of light-directed oligonucle-
otide microarrays using a digital micromirror array. Nat
Biotechnol 1999, 17:974-978.
5. Hughes TR, Mao M, Jones AR, Burchard J, Marton MJ, Shannon KW,
Lefkowitz SM, Ziman M, Schelter JM, Meyer MR, et al.: Expression
profiling using microarrays fabricated by an ink-jet oligonu-
cleotide synthesizer. Nat Biotechnol 2001, 19:342-347.
6. Dudley AM, Aach J, Steffen MA, Church GM: Measuring absolute
expression with microarrays with a calibrated reference
sample and an extended signal intensity range. Proc Natl Acad
Sci USA 2002, 99:7554-7559.
7. van Bakel H, Holstege FC: In control: systematic assessment of
microarray performance. EMBO Rep 2004, 5:964-969.
8. Ashburner M, Ball CA, Blake JA, Botstein D, Butler H, Cherry JM,
Davis AP, Dolinski K, Dwight SS, Eppig JT, et al.: Gene ontology:
tool for the unification of biology. The Gene Ontology
Consortium. Nat Genet 2000, 25:25-29.
9. Carter MG, Hamatani T, Sharov AA, Carmack CE, Qian Y, Aiba K, Ko
NT, Dudekula DB, Brzoska PM, Hwang SS, Ko MS: In situ-synthe-
sized novel microarray optimized for mouse stem cell and
early developmental expression profiling. Genome Res 2003,
13:1011-1021.
10. Sharov AA, Piao Y, Matoba R, Dudekula DB, Qian Y, VanBuren V,
Falco G, Martin PR, Stagg CA, Bassey UC, et al.: Transcriptome
analysis of mouse stem cells and early embryos. PLoS Biol
2003, 1:E74.
11. Carter MG, Piao Y, Dudekula DB, Qian Y, VanBuren V, Sharov AA,
Tanaka TS, Martin PR, Bassey UC, Stagg CA, et al.: The NIA cDNA
project in mouse stem cells and early embryos. C R Biol 2003,
326:931-940.
12. Zhang W, Morris QD, Chang R, Shai O, Bakowski MA, Mitsakakis N,
Mohammad N, Robinson MD, Zirngibl R, Somogyi E, et al.: The func-
tional landscape of mouse gene expression. J Biol 2004, 3:21.
13. Parrish ML, Wei N, Duenwald S, Tokiwa GY, Wang Y, Holder D, Dai
H, Zhang X, Wright C, Hodor P, et al.: A microarray platform
comparison for neuroscience applications. J Neurosci Methods
2004, 132:57-68.
14. Grate L, Ares M Jr: Searching yeast intron data at Ares lab web
site. Methods Enzymol 2002, 350:380-392.
15. Ares Lab Yeast Intron Database [ />compbio/yeast_introns/currentDB/stuff.html]
16. Tanaka S, Kunath T, Hadjantonakis AK, Nagy A, Rossant J: Promo-
tion of trophoblast stem cell proliferation by FGF4. Science
1998, 282:2072-2075.
17. Van Ness J, Hahn WE: Sequence complexity of cDNA tran-
scribed from a diverse mRNA population. Nucleic Acids Res
1980, 8:4259-4270.
18. Axel R, Feigelson P, Schutz G: Analysis of the complexity and
diversity of mRNA from chicken liver and oviduct. Cell 1976,
7:247-254.
19. Holland MJ: Transcript abundance in yeast varies over six
orders of magnitude. J Biol Chem 2002, 277:14363-14366.
20. Hastie ND, Bishop JO: The expression of three abundance
classes of messenger RNA in mouse tissues. Cell 1976,
9:761-774.
21. Bishop JO, Morton JG, Rosbash M, Richardson M: Three abun-
dance classes in HeLa cell messenger RNA. Nature 1974,
250:199-204.
22. Jongeneel CV, Iseli C, Stevenson BJ, Riggins GJ, Lal A, Mackay A, Har-
ris RA, O'Hare MJ, Neville AM, Simpson AJ, Strausberg RL: Compre-
hensive sampling of gene expression in human cell lines with
massively parallel signature sequencing. Proc Natl Acad Sci USA
2003, 100:4702-4705.
23. Hubner K, Fuhrmann G, Christenson LK, Kehler J, Reinbold R, De La
Fuente R, Wood J, Strauss JF 3rd, Boiani M, Scholer HR: Derivation
of oocytes from mouse embryonic stem cells. Science 2003,
300:1251-1256.
24. NIA Mouse Gene Index 2.0 [ />geneindex1/index.html]
25. Pertea G, Huang X, Liang F, Antonescu V, Sultana R, Karamycheva S,
Lee Y, White J, Cheung F, Parvizi B, et al.: TIGR Gene Indices clus-
tering tools (TGICL): a software system for fast clustering of
large EST datasets. Bioinformatics 2003, 19:651-652.
26. Kent WJ: BLAT - the BLAST-like alignment tool. Genome Res
2002, 12:656-664.
27. Eyras E, Caccamo M, Curwen V, Clamp M: ESTGenes: alternative
splicing from ESTs in Ensembl. Genome Res 2004, 14:976-987.
28. Bozdech Z, Zhu J, Joachimiak MP, Cohen FE, Pulliam B, DeRisi JL:
Expression profiling of the schizont and trophozoite stages
of Plasmodium falciparum with a long-oligonucleotide
microarray. Genome Biol 2003, 4:R9.
29. NIA Array Analysis Tool [ />index.html]
30. Gene Expression Omnibus [ />31. Edgar R, Domrachev M, Lash AE: Gene Expression Omnibus:
NCBI gene expression and hybridization array data
repository. Nucleic Acids Res 2002, 30:207-210.
32. ArrayExpress [ />33. Brazma A, Parkinson H, Sarkans U, Shojatalab M, Vilo J, Abeyguna-
wardena N, Holloway E, Kapushesky M, Kemmeren P, Lara GG, et al.:
ArrayExpress - a public repository for microarray gene
expression data at the EBI. Nucleic Acids Res 2003, 31:68-71.