Báo cáo y học: "Genomic analysis of heat-shock factor targets in Drosophila" doc
Bạn đang xem bản rút gọn của tài liệu. Xem và tải ngay bản đầy đủ của tài liệu tại đây (1.72 MB, 16 trang )
Genome Biology 2005, 6:R63
comment reviews reports deposited research refereed research interactions information
Open Access
2005Birch-Machinet al.Volume 6, Issue 7, Article R63
Method
Genomic analysis of heat-shock factor targets in Drosophila
Ian Birch-Machin
¤
*
, Shan Gao
¤
†
, David Huen
†
, Richard McGirr
*
,
Robert AH White
*
and Steven Russell
†
Addresses:
*
Department of Anatomy, University of Cambridge, Downing Street, Cambridge, CB2 3EH, UK.
†
Department of Genetics, University
of Cambridge, Downing Street, Cambridge, CB2 3EH, UK.
¤ These authors contributed equally to this work.
Correspondence: Steven Russell. E-mail:
© 2005 Birch-Machin et al.; licensee BioMed Central Ltd.
This is an Open Access article distributed under the terms of the Creative Commons Attribution License (
which permits unrestricted use, distribution, and reproduction in any medium, provided the original work is properly cited.
Abstract
We have used a chromatin immunoprecipitation-microarray (ChIP-array) approach to investigate
the in vivo targets of heat-shock factor (Hsf) in Drosophila embryos. We show that this method
identifies Hsf target sites with high fidelity and resolution. Using cDNA arrays in a genomic search
for Hsf targets, we identified 141 genes with highly significant ChIP enrichment. This study firmly
establishes the potential of ChIP-array for whole-genome transcription factor target mapping in vivo
using intact whole organisms.
Background
Chromatin immunoprecipitation or, more correctly, immu-
nopurification (ChIP) has emerged as a valuable approach for
identifying the in vivo binding sites of transcription factors
[1-6]. Before the availability of complete genome sequence
the use of this approach for identifying transcription targets
on a genome-wide scale was, however, limited. Over the past
few years, a number of laboratories have successfully used
high-density DNA microarrays to identify sequences enriched
by chromatin immunopurification (the ChIP-array
approach). In the yeast Saccharomyces cerevisiae, microar-
rays containing virtually all of the intergenic sequences from
the genome have been used to identify the binding sites of a
large number of transcription factors [7,8]. In principle, the
same techniques can be applied to higher eukaryotes, but the
complexity of their genomes presents a challenge for the con-
struction of full genomic microarrays.
Despite such difficulties, several studies have shown the fea-
sibility of the ChIP-array approach with small regions of com-
plex eukaryotic genomes using tissue culture systems. In
cultured mammalian cells, for example, the binding sites for
several transcription factors have been mapped using micro-
arrays composed of specific promoter regions or enriched for
promoter sequences with CpG arrays [9-11]. Although such
studies are valuable in identifying some of the targets of par-
ticular transcription factors, they are limited because the
microarray designs restrict the analysis to proximal promoter
elements of a subset of genes. It would be preferable to exam-
ine binding sites in an unbiased fashion by constructing tiling
arrays composed of all possible binding targets. Such tiling
arrays have been constructed on a small scale with microar-
rays containing a series of 1-kb fragments from the β-globin
locus [12], or on a large scale with oligonucleotide arrays con-
taining elements that detect all the unique sequences of
human chromosomes 21 and 22 [13]. These studies indicate
that the DNA-binding patterns of regulatory molecules in
Published: 10 June 2005
Genome Biology 2005, 6:R63 (doi:10.1186/gb-2005-6-7-r63)
Received: 31 January 2005
Revised: 7 April 2005
Accepted: 10 May 2005
The electronic version of this article is the complete one and can be
found online at />R63.2 Genome Biology 2005, Volume 6, Issue 7, Article R63 Birch-Machin et al. />Genome Biology 2005, 6:R63
large eukaryotic genomes are complex and highlight the need
for a comprehensive approach to understand how transcrip-
tion factors interact with DNA in vivo.
Drosophila melanogaster, with a genome complexity inter-
mediate between that of yeast and human, provides a power-
ful system for investigating transcription factor targets and
regulatory networks in a complex multicellular eukaryote.
Recently, the principle of using Drosophila genome tile
arrays to identify transcription factor binding sites in tissue
culture cells has been demonstrated. Using a technique
employing fusions between DNA-binding proteins and the
Escherichia coli DNA adenine methyltransferase (DamID;
[14]) the binding locations for the GAGA transcription factor
and the heterochromatin protein HP1 were mapped within a
3-Mb region of the Drosophila genome in a tissue culture sys-
tem [15]. Other studies have used this method to map proxi-
mal binding sites with cDNA arrays [16]. While this elegant
technique has the advantage that high-quality antibodies
against particular transcription factors are not required, and
a recent study indicates that it may be possible to transfer
from a tissue culture system to the intact organism [17], it
clearly has limitations, as in vivo the DAM-tagged transcrip-
tion factor is not expressed in its normal developmental con-
text. It is therefore desirable to develop methods that allow
the mapping of native transcription factors in their correct in
vivo context within the organism.
Here we adapt chromatin immunopurification techniques
using intact Drosophila embryos and demonstrate the relia-
ble identification of in vivo binding sites for the heat-shock
transcription factor Hsf on both genome tile and cDNA
arrays. The response of most organisms to heat stress
involves the rapid induction of a set of heat-shock proteins
(Hsps), including several chaperone molecules that assist in
protecting the cell from the deleterious effects of heat [18-21].
Several direct targets of the Hsf transcription factor are
already well characterized. In higher eukaryotes, including
Drosophila and mammals, heat stress results in the trimeri-
zation of Hsf monomers, which then bind with high affinity to
regulatory elements (heat-shock elements, HSE) close to the
transcriptional start sites of Hsp genes [22,23]. The Dro-
sophila heat-shock system has been characterized at several
levels, from the cytological mapping of Hsf-binding sites on
polytene chromosomes [22] to the detailed molecular and
biochemical analysis of transcriptional regulation at individ-
ual Hsp genes [24-26]. In this study we extend the analysis of
the Drosophila heat-shock response by demonstrating that
chromatin immunopurification from embryos can accurately
map in vivo Hsf-binding sites on genome tile microarrays and
identify new potential in vivo HSEs. In addition, using micro-
arrays containing full-length cDNA clones for over 5,000
Drosophila genes we identify almost 200 genes that are
reproducibly bound by Hsf upon heat shock in Drosophila
embryos. The targets correspond well with previously identi-
fied cytological locations of Hsf binding on salivary gland pol-
ytene chromosomes, thus providing direct target genes
associated with the low-resolution cytological analysis. A
comparison with studies using S. cerevisiae Hsf [27,28] sug-
gest that a set of conserved genes are regulated by Hsf in both
organisms. Overall, this study presents the strong potential of
this approach for in vivo genome-wide mapping of transcrip-
tion factor binding sites in higher eukaryotes using the whole
organism.
Results and discussion
Immunopurification of Hsf-bound chromatin
To test the effectiveness of ChIP-array and assess the possibil-
ity of using genome tile arrays to map the in vivo location of
transcription factor binding sites with intact whole organ-
isms, we used the well characterized transcription factor Hsf,
the mediator of the heat-shock response in Drosophila. For-
maldehyde-crosslinked chromatin from Drosophila embryos
was used as the input for immunopurifications with either
anti-Hsf antisera or preimmune sera. After immunopurifica-
tion and washing, the formaldehyde crosslinks were reversed
by heating and the DNA purified. This DNA was initially ana-
lyzed for the enrichment of known Hsf targets by quantitative
real-time PCR assays using a series of specific primers. We
assayed the Hsp26 and Hsp70A genes with primers that
amplify fragments spanning either the 5' HSE or a control 3'
untranslated region (UTR) fragment of each gene. As shown
in Table 1, the chromatin immunopurification shows both
good enrichment and high specificity. With both Hsp26 and
Hsp70A we observe over 100-fold enrichment of HSE frag-
ments with anti-Hsf versus preimmune serum and a similar
enrichment of HSE versus 3' ends with the anti-Hsf sera.
Because many of the published ChIP-array studies employ a
ligation-mediated PCR step (LM-PCR) to amplify the
enriched DNA, we assayed whether LM-PCR amplification of
the DNA prepared from anti-Hsf immunopurifications main-
tained the enrichments we observe with unamplified mate-
rial. We find that the enrichment of Hsp gene HSEs, as
measured by quantitative PCR, is similar between amplified
and unamplified material, demonstrating, at least with
respect to the Hsp genes we examined, the validity of using
LM-PCR amplification of ChIP-enriched DNA (data not
shown). During the course of our experiments we tested
embryos that had not been subjected to a heat shock but were
processed in the same way as heat-shocked embryos. We
found significant enrichment by quantitative real-time PCR
(between 25- and 90-fold enrichment of HSEs in three inde-
pendent experiments). Because considerable evidence indi-
cates that Hsf is not specifically bound to HSEs in unstressed
Drosophila cells [20], our observation suggests that the prep-
aration of the embryos may have induced the stress response,
possibly during the dechorionation step in bleach.
Genome Biology 2005, Volume 6, Issue 7, Article R63 Birch-Machin et al. R63.3
comment reviews reports refereed researchdeposited research interactions information
Genome Biology 2005, 6:R63
Genome tile arrays
We assayed the effectiveness of using genome tile arrays to
identify in vivo Hsf-binding sites. We constructed microar-
rays containing a total of 3,444 PCR products. These include
3,092 fragments representing 2.9 Mb of chromosome arm 2L,
from kuzbanian to cactus, 96 fragments representing the reg-
ulatory regions for a set of early segmentation genes (even-
skipped, hairy, runt and Dichaete) and a set of 95 products
spanning fragments identified in a previous immunopurifica-
tion experiment with anti-Ubx [2]. The fragments ranged in
size from 282 to 1,380 bp with an average size of 930 bp (SD
± 53 bp). In addition to these we produced 162 fragments
encompassing five different Hsp gene loci; regions of approx-
imately 10 kb encompassing Hsp68 at 95D11, Hsp83 at
63B11, Hsp60 at 10A and Hsp70A at 87A2 along with a 22-kb
region from 67B1 containing Hsp67Bc, Hsp67Ba, CG32041,
Hsp23, Hsp26 and Hsp27. The Hsp gene regions were repre-
sented in two fragment sets: a set of 1-kb fragments overlap-
ping by 500 bp and a set of 2-kb fragments overlapping by 1
kb. Finally, 480 elements were spotted with sheared Dro-
sophila DNA to give a microarray containing 3,924 elements.
We prepared chromatin from heat-shocked embryos, per-
formed immunopurification in parallel with anti-Hsf and pre-
immune sera and amplified the resulting purified DNA by
LM-PCR. Each sample was independently labeled with a flu-
orescent dye, the labeled anti-Hsf and preimmune samples
were mixed and then co-hybridized to the tiling path microar-
rays. We performed dye-swap experiments to assess any bias
in the incorporation of the fluorescent dyes. We used three
independent biological replicates and for each preparation
performed technical replicates, in total carrying out 11 sepa-
rate hybridizations (see Additional data file 1 for the full
data).
After normalization, we calculated the ratio of anti-Hsf signal
to the preimmune signal. Ratios for each technical replicate
were averaged and the average ratios used to calculate a prob-
ability score for each spot using Cyber-T [29]. The 480
sheared genomic DNA fragments were distributed evenly
across the slide and allowed us to evaluate the consistency of
input DNA samples; these had an average asinh ratio of -0.13
± 0.09 (standard error = 0.004, variance = 0.009) indicating
no significant overall difference between the samples. Of the
3,444 elements containing PCR-amplified fragments of Dro-
sophila DNA, 59 showed a greater than 1.6-fold enrichment
(up to 10-fold enrichment) with the DNA purified with anti-
Hsf sera at p-values better than 10
-3
. Of these elements, 53
(88%) correspond to fragments from Hsp gene loci, five from
the Adh region and one from the putative Ubx target set. Plot-
ting the average ratio for each array element with respect to
the order of the fragments on the genome (Figure 1), we
observe a striking distribution of signal; the fragments
derived from the Adh region and the segmentation genes
show little signal above asinh ratios of 0.5, with only four
fragments showing more than twofold enrichment. In con-
trast, many fragments from the Hsp gene regions show sub-
stantial enrichment. Of the 162 fragments from the Hsp gene
loci, 46 show greater than twofold enrichment with the anti-
Hsf sample. The results are highly reproducible; comparing
the ratios obtained with the 162 Hsp fragments from each of
the replicate slides, the correlation between any two slides
ranged from 0.7 to 0.98, with an average correlation of 0.84.
The distribution of the signals across the Hsp genes shows
excellent agreement with the known location of HSEs at the 5'
end of the transcription units and, in addition, show a monot-
onic signal distribution centered on the fragments containing
HSEs. This is best exemplified by the 20-kb region, which
encompasses the eight known or putative Hsp genes in the
67B region (Hsp67Bc, the bicistronic CG32041, CG4461,
Hsp26, Hsp67Ba, Hsp23 and Hsp27) where we observe
strong enrichment of fragments close to the 5' ends of heat-
inducible genes and negligible signals in between (Figure 2).
Five clear peaks of fragment enrichment are observed and
there is good overlap with the known locations of Hsf-binding
sites [30]. A major peak 5' to Hsp26 encompasses the charac-
terized Hsf-binding sites at -349 and -56. Three further peaks
cover the regions of the 5' ends of Hsp67Ba, Hsp23 and
Hsp27, including the known HSEs upstream of Hsp23 (-391
and -119) and Hsp27 (-366, -328 and -270). Finally, a fifth
peak overlaps the 5' ends of the divergent transcription units
of Hsp67Bc and CG32041, the latter being a dicistronic gene
encoding Hsp22 and Hsp67Bb. There appears to be no
substantial enrichment covering the 5' end of the Hsp20-like
CG4461; however, it is not known if this gene is Hsf-induci-
ble. Thus seven out of the eight Hsp genes in the region have
5' regions enriched by our assay. Fragments including known
HSEs show the highest enrichments (more than 3.5-fold),
whereas nearby fragments show no significant signal over the
background. This region demonstrates the potential for high-
resolution mapping of in vivo DNA binding and suggests that
even gene-dense regions can be accurately mapped using the
ChIP-array technique with 1-kb tiling paths.
Table 1
Enrichment of HSE with anti-Hsf ChIP as measured by quantita-
tive real-time PCR
Hsp Primer pairs used Fold enrichment
Hsp26 5' HSE 110
Hsp26 3' UTR < 0.1
Hsp70A 5' HSE 103
Hsp70A 3' UTR 3.5
DNA was analyzed by quantitative real-time PCR as described in
Materials and methods using primer pairs specific for the 5' HSE and 3'
UTR regions of Hsp26 and Hsp70A. Fold enrichment is based on the
comparison between amplifications with DNA from ChIP using anti-Hsf
or preimmune antiseum.
R63.4 Genome Biology 2005, Volume 6, Issue 7, Article R63 Birch-Machin et al. />Genome Biology 2005, 6:R63
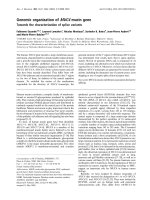
Distribution of fragment enrichment with anti-Hsf immunopurified chromatin on the genomic tiling arrayFigure 1
Distribution of fragment enrichment with anti-Hsf immunopurified chromatin on the genomic tiling array. The y-axis plots the asinh transformation
(approximately equivalent to the log
2
scale) of the ratio of anti-Hsf versus preimmune sera. The x-axis represents each of the 3,444 PCR products, the Adh
region, Hsp gene and segmentation gene (Seg) sequences are indicated below the x-axis. Strong enrichment of fragments from the Hsp genes is indicated by
their high ratio. The signals from l(2)35Bg and PRL-1 in the Adh region are indicated.
Graphical representation derived with the University of California at Santa Cruz (UCSC) genome browser of fragment enrichments in the 67B region containing eight putative Hsp genes (CG32041 encodes a dicistronic transcript)Figure 2
Graphical representation derived with the University of California at Santa Cruz (UCSC) genome browser of fragment enrichments in the 67B region
containing eight putative Hsp genes (CG32041 encodes a dicistronic transcript). The blue fragments represent the 1-kb and 2-kb tiling fragments with the
intensity of the blue color reflecting the degree of enrichment (asinh ratio); selected regions have been labeled with fold enrichments. The direction of
transcription for each of the Hsp genes is indicated by the red arrow. The black triangles at the bottom indicate the locations of known HSEs.
3.500
3.000
2.500
2.000
1.500
l(2)35Bg
PRL-1
Adh-region Hsp Seg
1.000
0.500
0.000
−0.500
−1.000
Genome Biology 2005, Volume 6, Issue 7, Article R63 Birch-Machin et al. R63.5
comment reviews reports refereed researchdeposited research interactions information
Genome Biology 2005, 6:R63
The other Hsp gene loci show similar distributions of frag-
ment enrichment (Figure 3). With Hsp70, three fragments
show greater than twofold enrichment with the two frag-
ments (Hsp-130 and Hsp-114) encompassing the known
Hsp70A regulatory elements, several HSEs between -252 and
-46 bp [30], showing the greatest enrichment (Figure 3a). In
the case of Hsp83 we see a different organization, and Hsf
binding is not restricted to the immediate 5' region (Figure
3b). We observe two strong peaks of signal enrichment. One
centers on the area immediately 5' to the start of Hsp83
expression where HSEs have been mapped between -88 and
-49 [30]. However, the ChIP also reveals a second peak at the
3' of Hsp83 extending to cover CG14966 (a gene of unknown
function) and 3' to CG32276, a predicted chaperone. This
additional signal contains matches with an Hsf consensus
binding sequence, suggesting that it represents a bona fide
Hsf-binding site. It has previously been noted that Hsp83
stands out from other Hsp genes in the dynamics of its
response to heat shock [24] and this may be linked to the dis-
tinct arrangement of Hsf-binding sites we find.
With Hsp68 we find that two overlapping fragments show
greater than fourfold enrichment (Hsp-117 and Hsp-131) and
these correspond to the region immediately 5' to the start of
Hsp68 transcription; the fragments flanking these are also
detected with lower ratios (Figure 3c). Although there are no
reports of mapping Hsf-binding sites in the Hsp68 region, we
find three perfect matches to a consensus Hsf-binding site
160 bp upstream of the mRNA start site, consistent with the
fragment enrichment we observe. Finally, with the Hsp60
gene we observe moderate but clear enrichment with frag-
ments encompassing the first intron of the gene, and also find
a match to a consensus HSE sequence in this region (Figure
3d, see below). Hsp60 is reported not to be induced by heat
shock in Drosophila and previous studies have failed to find
HSE sequences 5' to the start of Hsp60 transcription [31]. In
mammals and yeast, however, Hsp60 homologs are heat
inducible [32,33] and our data indicate conservation of Hsf
binding.
As well as the Hsp genes, we observe a greater than twofold
enrichment with two fragments in the Adh region (Figure 1).
One fragment maps between the divergently transcribed
genes l(2)35Bg and Su(H) suggesting that either of these
genes could be regulated by Hsf. Supporting this suggestion,
we find that l(2)35Bg gives a strong positive signal when inde-
pendent anti-Hsf immunopurifications are used to interro-
gate the cDNA arrays described below. In the second case, we
observe a twofold enrichment of a fragment overlapping the
5' end of the longest transcript from the PRL-1 gene and we
also observe a weak enrichment (1.2-fold) of a fragment over-
lapping a second transcription start-site 5 kb downstream
(data not shown). Interestingly, the PRL-1 gene was identified
by Sun et al. [15] as a candidate GAGA-factor (Gaf)-regulated
gene in their DamID analysis of the Adh region. In some
cases, most notably Hsp70A and Hsp26, Hsf- and Gaf-bind-
ing sites are located in close proximity and are both involved
in transcriptional regulation of Hsp genes [34].
In addition to the fragments showing greater than twofold
enrichment, we find a further eight fragments showing
greater than 1.5-fold enrichment with the anti-Hsf immunop-
urification. Some of these may represent weak Hsf-binding
sites. For two of these regions (CG4500 and CG3793) we
detect enrichment in the experiments with the cDNA arrays
described below, suggesting that they may represent bona
fide Hsf-binding sites in the genome.
To try and assess the validity of the fragments identified on
the array and relate the degree of enrichment with the pres-
ence of HSE, we used the informatics tool MEME [35] to
examine the enriched fragments for the presence of consen-
sus Hsf-binding sites. As noted above, we find predicted Hsf-
binding sequences in the regions enriched upstream of
Hsp68, downstream of Hsp83 and in the intron of Hsp60. We
also find potential Hsf-binding sequences within the frag-
ments enriched from the Adh -region, indicating that enrich-
ment on the tiling arrays corresponds to the location of some
Hsf-binding sites. Taken together, the experiments and anal-
ysis described above demonstrate that chromatin immunop-
urification used in tandem with tiling DNA microarrays can
successfully identify genuine in vivo transcription factor
binding sites at the level of the whole organism. Our mapping
suggests locations for new HSE elements regulating Hsp83,
Hsp68 and Hsp60.
Genome-wide search for HSF target genes
Since much previous work, along with the observations pre-
sented above, indicates that the binding sites for Hsf tend to
be located close to the transcriptional start of responsive
genes [24], we reasoned that we could identify new genes with
Hsf-binding sites by performing a ChIP-array analysis using
arrays containing cDNA clones. To this end we utilized a
microarray containing 5,372 full-length cDNA clones repre-
senting 5,073 genes, prepared from the Drosophila Gene Col-
lection V1.0 [36]. We performed immunopurifications using
anti-Hsf and preimmune sera on chromatin isolated from
three independent biological preparations. In addition, to
assess reproducibility, we performed independent
immunopurification reactions with two of the chromatin
preparations. With chromatin A we performed four separate
immunopurifications (1-4); the first two of these were techni-
cally replicated as well as dye-swapped and the second two
were dye-swapped only. From chromatin B we performed two
independent immunopurifications and each of these were
dye-swapped. With chromatin C we performed a single
immunopurification and dye-swap (full data in Additional
data file 2). In total we performed 18 hybridizations to the
cDNA arrays. The average correlation between each technical
replicate was very high (> 0.85) and after generating an aver-
age ratio for each technical replicate we used the CyberT algo-
R63.6 Genome Biology 2005, Volume 6, Issue 7, Article R63 Birch-Machin et al. />Genome Biology 2005, 6:R63
rithm to generate p-values from the average ratios for each
independent immunopurification.
We identified 188 genes that showed greater than 1.6-fold
enrichment. While we recognize that defining an enrichment
cutoff in the absence of other data is somewhat arbitrary, we
selected a 1.6-fold value based on the enrichments observed
on the genome tiling arrays with known Hsf-binding sites. We
note however that this criterion may underestimate the Hsf-
binding targets as the cDNA array elements will only detect
binding sites close to the 5' end of the cDNA. Genes that bind
Hsf at more distant sites will be expected to generate weaker
signals on the array that will escape detection owing to noise
issues with low signals. To validate the Hsf targets we selected
11 genes distributed across the ranking from 1 to 188, and
tested for enrichment of the 5' genomic DNA upstream of
each gene in a standard ChIP assay along with 5' and 3' end of
hsp26 as a control. As shown in Figure 4, all 11 genes tested
showed clear enrichment when DNA derived from anti-Hsf
sera and preimmune sera are compared. Thus the microarray
assay is in excellent agreement with standard PCR assays and
suggests that, at least with the enrichments we observe, the
ChIP-array data is highly reliable. Of the 188 genes with the
selected 1.6-fold enrichment, 141 were enriched with p-values
of 9 × 10
-3
or better. Enrichments as high as eightfold were
reproducibly observed and, reassuringly, enriched genes
include a number of Hsp genes along with other predicted
chaperone-encoding genes such as DnaJ-1, CG32041 and
Graphical representation of fragment enrichments for four Hsp gene regions derived with the UCSC genome browserFigure 3
Graphical representation of fragment enrichments for four Hsp gene regions derived with the UCSC genome browser. Details as for Figure 2; gray
triangles represent predicted Hsf-binding sites. See text for details. (a) Hsp70A; (b) Hsp83, note the enrichment both 5' and 3' to the gene; (c) Hsp68,
enriched fragments 5' to the gene contain predicted Hsf-binding sites; (d) Hsp60, the enriched fragments within the intron contain predicted Hsf sites.
Genome Biology 2005, Volume 6, Issue 7, Article R63 Birch-Machin et al. R63.7
comment reviews reports refereed researchdeposited research interactions information
Genome Biology 2005, 6:R63
CG32649 (Table 2). Using the stringent p-value cutoff, our
analysis indicates that approximately 3% of the genes in the
Drosophila genome (around 400) may be direct targets of
Hsf, a figure that is in remarkable agreement with a recent
analysis of Hsf binding in S. cerevisiae [28].
In general, the agreement between the independent immu-
nopurifications and the different chromatin samples was very
good, however we noticed that each immunopurification
identified a set of genes that showed no significant
enrichment in other samples. These 'IP-specific' signals were
consistent within the technical replicates and showed high
enrichments (up to sevenfold). They did not, however, corre-
late with a particular chromatin preparation, since there was
no similarity between the different immunopurifications per-
formed from the same chromatin. We assume that these
artifacts reflect the inherent noisiness of the system and
emphasize the need to perform replicate immunopurifica-
tions from particular biological samples in order to identify
consistently positive signals.
We determined the predicted cytological location of the all
188 top Hsf target genes and compared this list to the cytolog-
ical mapping of Hsf-binding sites on polytene chromosomes,
which is, of course, quite low resolution [22]. Of these genes,
82 are predicted to map to the same cytological band as an
Hsf site (50%) and a further 40 are predicted to map within a
lettered division of a site mapped by Westwood et al. [22]
(Figure 5). Thus from the 164 cytological sites reported to
bind Hsf immediately after heat shock, we have identified 122
(75%) candidate genes as Hsf targets in these locations with
our survey of approximately 40% of the predicted genes in the
genome.
We examined the expression of the cDNAs on the array by
hybridizing with labeled cDNA prepared from heat-shocked
embryos compared to unshocked controls; 16 of the top 188
genes showed induction greater than 1.7-fold (Table 2) with
known heat-shock response genes being robustly induced; for
example, over 30-fold increases in Hsp26 and Hsp27 expres-
sion. A further two genes are repressed more than twofold.
We examined the only other reported Drosophila array data,
obtained from custom oligonucleotide arrays hybridized with
RNA derived from heat-shocked and non-heat-shocked
embryos [37]. Of the genes represented on the custom array,
21 are found in our top 188 Hsf-binding genes; of these, seven
genes (Hsp26, 27 and 23, DnaJ-1, Hsc70-5, CG3488 and Cct-
gamma) show induction and one (cyclophilin 1; Cyp1) is
repressed, according to the quality criteria used by the
authors. In general the data are in reasonable agreement;
however, we find no evidence with our cDNA array for induc-
tion of Cct-gamma and CG3488 or repression of Cyp1. These
discrepancies may reflect strain differences, platform-specific
signals or experimental noise. We conclude that only a minor-
ity of the Hsf targets that we have identified show clear
evidence of direct induction or repression using our heat-
shock regimes and sampling times.
In a recent Hsf1 ChIP study of mammalian cell lines, approx-
imately 50% of the 94 identified Hsf1-bound promoters did
not directly produce heat-induced transcripts [38], leading to
the interpretation that Hsf binding alone may not confer
heat-inducibility. Indeed it is clear that even in the well char-
acterized Hsp gene regulatory regions, Hsf collaborates with
other transcription factors [39]. In contrast, Hahn et al. [28]
were able to use the extensive expression data available in
yeast to determine what fraction of the 165 Hsf targets they
identified by ChIP showed evidence of induction by heat
shock. Only 7% of the putative Hsf targets did not show evi-
dence of heat-shock induction. In multicellular eukaryotes,
with the possibilities of considerable developmental and
tissue-specific effects on gene expression, more extensive
expression analyses will be required to enable us to address
the question of how many of the Hsf target sites are associated
with Hsf-mediated regulation of expression.
PCR validation of selected positives from the cDNA arraysFigure 4
PCR validation of selected positives from the cDNA arrays. Agarose gels
showing the products generated by specific PCRs for each of the indicated
genes using preimmune purified (-) or anti-Hsf purified (+) chromatin as an
input.
− + − + − + − +
− + − + − + − +
− + − +
− + − +
− +
CG3273 CG9746 CG10077 CG11166
CG12876 CG33111 CG33144
EP2237 mbf1
hsp26 5′ hsp26 3′
veg
dmt
R63.8 Genome Biology 2005, Volume 6, Issue 7, Article R63 Birch-Machin et al. />Genome Biology 2005, 6:R63
Table 2
Top 50 cDNA clones identified by anti-HSF ChIP on cDNA arrays
FlyBase gene Mean ratio p-value Gene chip cDNA DAM GAGA GAGA p-value HSF sites Cytology
CG32041 3.043 2.02E-05 - 15 1.305 1.25E-05 5 67B1
CG1416 2.793 2.19E-04 - 2.4 -0.024 8.44E-01 1 40A2
CG9705 2.674 4.91E-05 - 1.5 0.118 4.86E-01 8 73C4
CG3428 2.428 6.53E-05 - 2.1 -0.086 4.76E-01 3 67B8
DnaJ-1 2.375 5.25E-04 6.13 4.4 0.489 4.23E-03 1 64E5
FKBP59 2.321 3.88E-04 - 2.4 -0.047 6.19E-01 1 30E1
CG1553 2.179 3.11E-05 - 2.4 0.368 1.47E-02 2 43E17
Hsc70Cb 2.164 2.90E-04 - 2.5 0.189 2.89E-01 1 70C15
Taf7 2.128 3.06E-06 - 1.2 0.462 5.95E-03 1 84E5
CG10286 2.128 6.95E-06 - 1.2 0.226 1.01E-01 5 83E4
CG2182 2.080 1.85E-05 - 1.1 0.188 1.26E-01 5 83B8
MESR6 2.079 9.11E-06 - 1.6 0.104 3.14E-01 4 75F7
Fer1HCH 1.986 4.23E-05 -1.09 0 1.793 6.62E-06 6 99F2
CG8258 1.962 3.83E-05 - 1.4 0.215 1.32E-01 4 44F5
CG11455 1.954 1.47E-03 - 0 0.100 5.55E-01 4 21B1
EP2237 1.928 3.25E-04 - 1.4 0.258 4.45E-02 0 21D6
alphaCop 1.926 4.35E-04 - -0.7 0.820 5.90E-01 5 62A9
Trap36 1.919 1.58E-04 - -2 -0.208 7.55E-02 2 65F2
Sir2 1.917 1.16E-04 - 1.4 0.280 4.32E-02 9 34A7
CG11791 1.906 5.08E-06 - 1.3 0.490 4.34E-03 3 96B19
CG32649 1.836 7.90E-04 - 2 0.064 5.98E-01 5 11D1
l(1)G0331 1.833 1.13E-04 - 1.3 0.143 1.77E-01 3 7B1
Cyp1 1.805 9.67E-05 -1.13 0 0.109 3.59E-01 1 14B12
RNaseX25 1.803 6.23E-05 - 1.1 -0.310 1.87E-02 2 66A21
l(2)08717 1.794 7.56E-04 - 0 1.624 1.49E-07 2 55F3
CG10576 1.724 2.14E-04 - 1.3 -0.329 4.11E-03 6 64E6
Xbp1 1.710 2.23E-04 - 1.5 0.108 3.20E-01 6 57C3
Pgi 1.708 1.65E-03 2.01 1.4 -0.011 9.08E-01 2 44F6
Hsc70-5 1.686 1.76E-04 1.44 2 0.019 8.58E-01 3 50E6
sgl 1.667 1.74E-07 1.84 1.6 0.172 2.51E-01 0 64D4
Hsp23 1.665 7.44E-04 10.11 21 0.786 2.56E-04 14 67B1
Arf79F 1.651 7.42E-04 1.08 0 0.277 7.76E-02 2 80B2
CG8297 1.623 1.95E-03 - 1.9 -0.208 1.77E-01 5 52D2
dmt 1.623 1.39E-03 - 1.2 -0.175 1.19E-01 2 85E5
l(1)G0022 1.591 1.16E-03 - 1.2 -0.110 3.57E-01 3 13E14
CG7945 1.581 9.89E-05 - -2.6 0.034 7.40E-01 5 71D4
CG31536 1.579 1.06E-04 - 0 -0.045 7.04E-01 1 82E2
Hsp27 1.568 6.82E-04 12.42 32 1.001 4.92E-05 9 67B1
Lrr47 1.560 9.19E-04 - 1.1 -0.252 1.77E-02 1 50E6
CG1103 1.551 7.79E-04 - -1.1 -0.310 1.16E-02 5 82A4
CG10600 1.539 9.21E-05 - 1.2 -0.145 1.51E-01 5 37B1
CG10973 1.532 7.99E-03 - 2 -0.148 1.52E-01 4 69E1
Genome Biology 2005, Volume 6, Issue 7, Article R63 Birch-Machin et al. R63.9
comment reviews reports refereed researchdeposited research interactions information
Genome Biology 2005, 6:R63
We used the Gene Ontology (GO) annotation to classify the
gene products represented by the 188 Hsf-bound genes (Fig-
ure 6). As would be predicted, proteins annotated with
chaperone or chaperone ATPase activity are well represented;
we find 17 chaperones among the Hsf target genes. Using
GeneMerge to assess enrichment of GO terms in the Hsf tar-
gets compared to all of the genes on the array, we find highly
significant enrichment of genes with chaperone or heat-shock
protein activity (p < 8 × 10
-6
) functional annotation. In terms
of biological processes, response to heat or temperature are
over-represented (p < 2 × 10
-4
) (Figure 5). In addition, we
find 18 genes involved in basic metabolism, in protein modi-
fication or degradation, 12 genes associated with the cell cycle
or programmed cell death and, interestingly, 14 genes
associated with gene expression. Of this latter class, eight are
documented as showing changes in expression in response to
CG12744 1.496 5.10E-03 - 0 0.693 2.52E-03 3 46C1
sra 1.476 1.79E-04 - 2.2 -0.110 3.25E-01 6 89B12
Rpn6 1.469 8.39E-05 - 1.4 -0.237 4.20E-02 3 51C1-2
CG3488 1.466 8.40E-04 3.2 1.3 -0.023 9.13E-01 3 23D4
sktl 1.462 2.79E-03 1.14 1.1 -0.090 4.45E-01 5 57B3
Actr13E 1.447 1.04E-03 -1.27 -1.1 -0.288 2.35E-02 6 13E12
CG17294 1.447 1.81E-03 - 1.4 -0.241 2.30E-02 7 29B3
CG33111 1.426 1.27E-04 - 0 NA NA 9 95B7
The FlyBase gene symbol, corresponding to the cDNA clone on the array, is given along with the mean asinh ratio and p-values derived from Cyber-
T. Expression data is given from custom Affymetrix GeneChips and from the cDNA arrays with RNA extracted from heat-shocked embryos; bold
indicates significant expression (p better than 10
-3
). The mean ratios and p-values from a GAGA-factor DamID experiment are listed for each gene;
bold indicates significant ratios. Hsf sites indicates the number of predicted Hsf sites found 1 kb upstream of each gene and the column heading
cytology indicates the predicted cytological location; matches with the polytene chromosome studies are in bold. See text for details. The full list of
188 genes with associated data is given in Additional data file 3.
Representation of the predicted cytological location of the top 188 Hsf-binding genesFigure 5
Representation of the predicted cytological location of the top 188 Hsf-binding genes. Those identified with our cDNA array are indicated by blue triangles
and the mapping of Hsf sites on polytene chromosomes reported by Westwood et. al. [22] is shown by red triangles. Filled triangles represent matches
between the two studies and open triangles represent unmatched mapping.
Table 2 (Continued)
Top 50 cDNA clones identified by anti-HSF ChIP on cDNA arrays
X
2L
2R
3L
3R
R63.10 Genome Biology 2005, Volume 6, Issue 7, Article R63 Birch-Machin et al. />Genome Biology 2005, 6:R63
dietary changes or oxidative stress [40,41] and this suggests a
link between downstream components of different stress
responses. Of particular interest are four genes (Taf7,
CG33097, TfIIE
α
and Trap36) that encode core components
of the RNA polymerase II transcription machinery. Trap36 is
a component of the Mediator complex, which has been shown
to play a vital role in transcriptional induction by Hsf at the
Hsp70A promoter [42]. These data suggest that part of Hsf
function may be to regulate components of the core transcrip-
tional machinery necessary for the stress response in order to
modulate or temporally control the response.
As noted above, in some cases heat-shock responsive genes
may be regulated by both Hsf and Gaf. A recent study identi-
fied potential binding targets of Gaf by the Dam-ID technique
using cDNA arrays very similar to those used here [16]. We
therefore examined the overlap between the sets of genes
binding both factors. Of the 188 Hsf-binding genes, 39 were
identified as being potential Gaf targets (>1.4-fold enrich-
ment p < 10
-3
, Table 2). Of these we find, as expected, the
chaperones Hsp22, Hsp23, Hsp26, Hsp27 and DnaJ-1. There
is no obvious correlation between high expression and bind-
ing of both Hsf and Gaf. Although the highly expressed chap-
erones discussed above appear to be targets of both Hsf and
Gaf, four other chaperones (CG7945, Hsc70Cb, Hsc70-5 and
CG32649), which are induced by heat shock, bind only Hsf
and not Gaf. Of interest in the set of genes bound by both fac-
tors is the TGFβ receptor thick veins, as well as three anno-
tated transcriptional regulators (Taf7, CG6792 and GATAd).
This suggests that a complex secondary response to stress
may involve co-regulation of key transcriptional and signal-
ing regulators by both Hsf and Gaf.
We next sought to determine whether the sequences
upstream of the top Hsf-binding genes were enriched for
potential Hsf-binding sites. We used standard pattern match-
ing software to look for matches to a consensus Hsf-binding
site TTCnnGAAnnTTC [43] in the 1 kb immediately upstream
of the top-ranked 188 Hsf-binding genes. As a control we
examined the 1-kb regions upstream of the 5,000 genes on
the array that showed no enrichment with Hsf. Plotting the
number of predicted Hsf sites against the number of genes
shows that for both the anti-Hsf enriched and the non-
enriched sequences there is a broadly similar distribution for
upstream regions containing five or fewer matches to the con-
sensus (Figure 7a). However, in the case of the anti-Hsf
enriched fragments we find an over-representation of
upstream regions that contain six or more consensus Hsf
sites. These include, as expected, the known heat-shock genes
(Hsp23, Hsp26 and Hsp27) but also genes for transcription
factors (TfIIE
α
and CG6197) and genes of unknown function.
In most of these cases we find that predicted Hsf sites are
Gene ontology classification of the top 188 genes identified from the cDNA arrayFigure 6
Gene ontology classification of the top 188 genes identified from the
cDNA array. Percentage representations are given for the prominent
categories.
11%
10%
39%
13%
7%
Unknown
Metabolism
Cell cycle/apoptosis/DNA metabolism
Signalling and transport
Cytoskeleton
Development
Homeostasis
Gene expression
Defense/stress
Protein biochemistry
Predicted Hsf-binding sequences in the 1-kb region upstream of Hsf-binding genesFigure 7
Predicted Hsf-binding sequences in the 1-kb region upstream of Hsf-
binding genes. (a) Plot of the distribution of the number of predicted sites
as a proportion of the population of anti-Hsf-enriched (Heat shock) or
non-enriched (Control). (b) The relative position of predicted Hsf sites
for each of the genes containing eight or more sites. The annotated gene
start is on the right. Red triangles, perfect match; purple, one mismatch;
light blue, two mismatches. Gray boxes represent the known HSEs
upstream of Hsp23, Hsp26 and Hsp27.
Genome Biology 2005, Volume 6, Issue 7, Article R63 Birch-Machin et al. R63.11
comment reviews reports refereed researchdeposited research interactions information
Genome Biology 2005, 6:R63
clustered and preferentially located within 500 bp upstream
of the transcription start (Figure 7b). This supports the view
that the sites we have identified represent genuine HSEs. We
also observe that the number of predicted Hsf sites is not
related to the fold enrichment we observe on the microarrays,
suggesting either that fragment enrichment is not an accurate
measure of Hsf 'binding affinity' or that simple binding site
prediction is not a reliable way of identifying genuine HSEs.
Comparative analysis
Two genome-wide studies in the budding yeast S. cerevisiae
have mapped the location of HSF1 by ChIP-array. In one case,
Hsf binding was determined using unstressed cultures and
over 100 potential targets identified with significant p-values
according to the error model used by the authors [27]. In a
second study, using both unstressed and heat shocked cells,
165 genes were identified with Hsf1-binding sites that showed
enrichment above a threshold set by consideration of heat-
inducible expression [28]. We compared our data from the
Drosophila cDNA array with this yeast data to look for simi-
larities in the sets of genes potentially regulated by Hsf in
both organisms. Taking the protein sequences of the top hits
from the cDNA array, we looked for yeast genes encoding pro-
teins with BLAST matches better than 1e-10 and identified 83
genes. We then examined their enrichment in the yeast Hsf-
binding datasets. These data are summarized in Table 3.
Using the cutoff criteria employed by Hahn et al. [28] we find
11 yeast genes that are predicted to bind Hsf and another gene
(CG4800) just below their threshold. A further 11 genes, iden-
tified in the Lee et al. data [27] with p-values better than 1 ×
10
-2
are also conserved. This set of 23 Hsf target genes con-
served between fly and yeast not only includes characterized
heat-shock response genes (DnaJ-1 and Hsc70-5) but also
seven other putative stress-response genes (including
Hsp60), 12 genes with other functions and two genes of
unknown function. This clearly represents a minimal set as it
is limited by identification of homologous genes and by cross-
comparability of the datasets. For example, the small Hsp20-
like chaperones are not conserved in sequence between fly
and yeast, although proteins with similar functions are clearly
bound by Hsf in both organisms. Since we have only surveyed
approximately 40% of the Drosophila genome, it suggests a
minimal core of over 50 genes as a conserved set of eukaryotic
Hsf targets.
Along with chaperone-encoding genes, we find other genes
whose products are suggested to be implicated in stress
responses; CG4800, a putative microtubule-binding protein
associated with the defense response and cyclophilin1.
CG1416 encodes a protein with a possible Hsp90 interaction
domain, which, according to the data from a Drosophila
gene-expression time course [44], is coexpressed with two
genes: foraging, encoding a cyclic-nucleotide dependent pro-
tein kinase [45], and effete, a predicted ubiquitin-conjugating
enzyme [46]. We find that both these genes are bound by Hsf
in Drosophila, albeit with lower enrichments than CG1416
(1.5- and 1.6-fold) and homologous genes are also bound in
yeast (the protein kinase TPK2, with a modest 2.8-fold
enrichment and UBC4, a ubiquitin-conjugating enzyme with
a highly significant enrichment (p = 1.1e-4). This suggests the
possibility that these proteins may interact in a common
stress-response pathway.
Among the remaining genes, l(2)35Bg represents a highly
conserved protein found throughout eukaryotes. While the
function of this protein is unknown, mutations in yeast and
Drosophila are lethal, in the latter case lethal in embryos. Our
findings suggest that l(2)35Bg encodes a conserved factor
involved in the stress response.
Of particular interest among the conserved Hsf targets is the
helix-turn-helix containing transcription coactivator multi-
protein bridging factor 1 (Mbf-1). This protein has been
shown to mediate the interaction between nuclear hormone
receptors and TATA-binding protein (TBP) in both Dro-
sophila and mammalian systems [47,48] and plays a similar
role in yeast, where it is involved in mediating the interaction
between TBP and the leucine-zipper transcription factor
GCN4. Null mutants in yeast are viable but sensitive to
amino-acid deprivation [49]. In Drosophila the gene is
strongly induced by oxidative stress (paraquat treatment
[40]), moderately induced by heat shock (this paper) and
repressed under starvation conditions [41]. Recent reports
suggest that mbf-1 mutants are also viable in Drosophila but
are sensitive to oxidative stress [50]. This report further sug-
gests that Mbf-1 interacts with the c-Jun/c-Fos AP-1 dimer to
mediate AP-1 stress-response activity. These observations
suggest that there may be an underlying link between differ-
ent types of stress response (heat, oxidation and nutritional)
and that Mbf-1 may be intimately involved in the transcrip-
tional response to environmental conditions, playing a vital
role in coordinating the interaction of different stress-
response transcription factors with the core RNA polymerase
II complex.
Conclusions
We have used chromatin immunopurification in conjunction
with genome tiling and cDNA microarrays to map the in vivo
binding sites of the heat-shock factor Hsf. Our results demon-
strate the potential for mapping bona fide transcription factor
binding sites at a genome-wide scale in complex multicellular
eukaryotes. We find that the technique is highly reproducible
and, with appropriate experimental replication, can identify
binding regions with high fidelity. We further demonstrate a
core set of Hsf targets conserved between fly and yeast that
may represent a evolutionarily conserved regulatory network.
The response of an organism or cell to stress is highly complex
and necessitates direct control of physiological processes as
well as modulation of gene transcription. The set of Hsf tar-
gets we identify includes many metabolic enzymes, which
may be candidates for control points directly controlling met-
R63.12 Genome Biology 2005, Volume 6, Issue 7, Article R63 Birch-Machin et al. />Genome Biology 2005, 6:R63
abolic and physiological processes in times of stress. The find-
ing that several genes encoding transcriptional regulators are
bound by Hsf, in particular components of the core RNA
polymerase complex, suggests that one of the roles of Hsf may
be in initiating or establishing a transcriptional state neces-
sary for recovery from heat stress as well as its more tradi-
tional role in activating immediate stress-response genes. In
both flies and mammalian systems Hsf target genes are not all
immediately transcriptionally induced, suggesting that the
heat response may be more complex than simply activating
chaperones. In addition, the observation that Hsf may be reg-
ulating genes implicated in other stress responses suggests
that responses to different stresses may involve underlying
similarities. The extension of these studies to full genome
coverage in Drosophila as well as other tractable model sys-
tems such as Caenorhabditis elegans, offers the prospect of
understanding the regulatory response underpinning a fun-
damental cellular process.
Materials and methods
Anti-Hsf antiserum
We generated specific rabbit polyclonal antisera against a
bacterially expressed Drosophila Hsf (CG5748). Briefly, we
used a construct (MBP-dHsf [25], kindly provided by J. Lis,
Cornell University) to produce a fusion protein containing the
first 691 amino acids of Hsf fused to maltose-binding protein.
After excision from an SDS-polyacrylamide gel, the gel slice
containing the fusion protein was used as antigen in rabbits
(approx 100 µg per rabbit per immunization) to produce a
high titer antiserum (Eurogentec, Seraing, Belgium). The spe-
cificity of the antiserum for Hsf was confirmed by western
blots of Drosophila nuclear extracts, where a band of approx-
imately 110 kDa is recognized, as expected for Drosophila Hsf
[22]. In addition, immunolabeling of Drosophila embryos
with the anti-Hsf antiserum gives the expected ubiquitous
nuclear staining, which is absent from embryos labeled with
the preimmune serum and from hsf-null embryos labeled
with the anti-Hsf antiserum (two Hsf null conditions were
tested; hsf
1
and Df(2R)ED3610 homozygotes).
Table 3
Genes binding Hsf in both Drosophila and S. cerevisiae
FlyBase Fly ratio Yeast Yeast express NO-HS HS Lee ratio Lee p BLAST Yeast GO function
Acon 0.968 ACO1 2.876 0.833 0.516 1.86 6.90E-02 4.00E-274 Aconitate hydratase
Hsc70-5 1.686 SSC1 1.98 0.999 0.999 7.05 1.50E-04 6.60E-201 Protein transporter*
Hsp60 1.039 HSP60 2.608 0.997 0.997 2.33 1.50E-02 1.00E-177 Single-stranded DNA binding*
Cctgamma 1.275 CCT3 -0.28 0.646 0.343 1.85 7.80E-02 4.00E-162 Unfolded protein binding*
l(1)G0022 1.591 CCT6 0.063 0.714 0.921 1.73 8.60E-02 1.00E-136 Unfolded protein binding*
Hsc70Cb 2.164 SSE1 1.771 0.998 0.999 4.48 1.50E-03 1.70E-115 Unfolded protein binding*
CG8863 0.818 YDJ1 1.529 0.999 0.997 6.62 2.40E-04 2.00E-74 Chaperone regulator*
Cyp1 1.805 CPR1 1.251 0.996 0.995 10.83 3.40E-05 3.00E-65 Peptidyl-prolyl cis-trans isomerase
CG8258 1.962 CCT4 NA 0.385 0.055 1.85 7.80E-02 3.00E-55 Unfolded protein binding*
CG2918 1.100 SSA3 4.479 0.934 0.995 1.19 4.80E-01 7.00E-50 ATPase
DnaJ-1 2.375 SIS1 3.237 0.999 0.999 11.31 3.50E-05 7.00E-46 Unfolded protein binding*
Rab35 1.416 YPT32 0.338 0.269 0.343 1.98 4.30E-02 4.00E-40 GTPase activity
sktl 1.462 MSS4 1.042 0.712 0.879 1.91 4.80E-02 7.00E-35 Phosphatidylinositol kinase
CG4800 1.424 RBF18 0.03 0.872 0.964 2.13 1.50E-01 1.00E-33 Unknown
Cyt-c-d 0.932 CYC1 1.738 0.959 0.942 2.53 1.10E-02 4.70E-33 Electron carrier
mbf1 0.706 MBF1 NA 0.999 0.998 9.4 1.80E-04 2.00E-29 Transcription coactivator
CG1416 2.793 AHA1 3.288 0.999 0.999 9.14 5.60E-04 3.00E-28 Chaperone activator*
CG4500 1.37 FAA1 3.889 0.796 0.943 2.61 8.00E-03 9.00E-23 Fatty-acid-CoA ligase
CG32920 1.081 AHP1 1.547 0.983 0.984 3.81 1.10E-03 1.10E-19 Thioredoxin peroxidase
SH3PX1 0.877 SNX4 1.26 0.824 0.372 2.52 1.30E-02 6.30E-13 lipid binding
CG10973 1.532 FES1 3.541 0.997 0.993 NA NA 1.10E-10 Adenyl-nucleotide exchange factor
l(2)35Bg 0.755 DRE2 0.304 0.843 0.832 3.36 3.70E-03 5.00E-10 Unknown
CG12200 0.786 CST9 1.022 0.346 0.467 1.69 9.40E-02 8.70E-10 DNA binding
The FlyBase gene ID is given, along with the average asinh ratio of Hsf enrichment. Yeast homologs are indicated by their Saccharomyces genome
database (SGD) common names. The average heat-induced expression and ranking of Hsf binding in non-heat shocked (NO-HS) and heat shocked
(HS) cells are from [28], the Lee ratio and Lee p are from [27]. BLAST scores are derived from searches at the SGD using the Drosophila sequences
as probes. Gene Ontology (GO) functional classifications are for the yeast proteins; asterisks indicate stress-response proteins.
Genome Biology 2005, Volume 6, Issue 7, Article R63 Birch-Machin et al. R63.13
comment reviews reports refereed researchdeposited research interactions information
Genome Biology 2005, 6:R63
Chromatin immunopurification from Drosophila
embryos
Embryos (1-2 g) were collected over a 16 h period and then
heat shocked for 15 min at 37°C. After the embryos were
dechorionated in weak bleach (5% w/w available chlorine) for
3 min they were washed in H
2
O and then in PBS/0.01% Tri-
ton (PBST). The embryos were then centrifuged (1 min at 500
g) and resuspended in 10 ml crosslinking solution (50 mM
HEPES pH 8.0, 1 mM EDTA.Na
2,
0.5 mM EGTA, 100 mM
NaCl) containing formaldehyde (1.95%) and 30 ml n-hep-
tane. This was incubated at room temperature with vigorous
shaking for 15 min. The fixed embryos were centrifuged (1
min at 500 g), resuspended in PBST-glycine (PBST, 125 mM
glycine) and allowed to sediment. After the embryos were
washed with ice-cold PBST, they were again allowed to sedi-
ment. The supernatant was removed and the embryos were
resuspended in 15 ml ice-cold PBST containing protease
inhibitors. After douncing using a Wheaton Dounce Tissue
Grinder (pestle B), and centrifugation at 400 g at 4°C for 1
min, the supernatant was removed and centrifuged at 1,100 g
for 10 min at 4°C. The pellet was resuspended in 15 ml ice-
cold cell lysis buffer (5 mM PIPES pH 8, 85 mM KCl, 0.5%
Nonidet P-40) containing protease inhibitors and dounced
using a Wheaton Dounce Tissue Grinder (pestle A). Then the
extract was centrifuged at 2,000 g for 4 min at 4°C and the
pelleted nuclei were resuspended in 3 ml ice-cold nuclear
lysis buffer (50 mM Tris.HCl pH 8.1, 10 mM EDTA.Na
2
, 1%
SDS) including protease inhibitors. After 20 min at 4°C, 0.3 g
acid-washed glass beads (Sigma, 212-300 µm diameter) were
added and the extract was sonicated using a heat systems
ultrasonic liquid processor XL sonicator with a microtip
attached. The extract was exposed to a 1 × 30 sec burst at level
3, and 5 × 30 sec bursts at level 4 with 90 sec resting on ice
between bursts. Fragment sizes between 0.5 and 1 kb were
produced. The chromatin extract was clarified by centrifuga-
tion at 14,000 rpm for 10 min at 4°C, flash frozen in liquid
nitrogen and stored at -80°C.
Chromatin immunopurification was performed according to
the method of Oberley et al., [51]. Briefly, the chromatin
solution was diluted with IP dilution buffer (16.7 mM
Tris.HCl pH 8, 167 mM NaCl, 1.2 mM EDTA.Na
2
, 1.1% Triton
X-100, 0.01% SDS) and precleared with fixed and killed Sta-
phylococcus aureus Protein A-positive strain cells (SAC) for
15 min. The precleared diluted chromatin sample was incu-
bated with 1 µl of either preimmune serum or anti-Hsf serum
overnight at 4°C. To capture the antibody-chromatin com-
plexes, SAC were added and the samples were incubated for
15 min at room temperature. The SAC were washed twice in
IP dialysis buffer (50 mM Tris.HCl pH 8, 2 mM EDTA.Na
2
,
0.2% sarkosyl) and four times in IP wash buffer (100 mM
Tris.HCl pH 9, 500 mM LiCl, 1% deoxycholic acid, 1% Noni-
det P-40). The immunopurified material was eluted from the
SAC by vigorously vortexing for 15 min in elution buffer (50
mM NaHCO
3
, 1% SDS). RNase A was then added (33.3 µg/
ml) and NaCl to 0.3 M. To reverse the crosslinks the material
was incubated for 5 h at 67°C and then precipitated with eth-
anol. Proteinase K (0.6 units/ml) was added and the samples
were incubated at 45°C for 2 h and purified with one extrac-
tion with phenol/chloroform/isoamyl alcohol followed by a
chloroform extraction. After precipitation with ethanol in the
presence of glycogen the DNA was resuspended in TE buffer.
Quantitive real-time PCR
Quantitive real-time PCR experiments were performed with a
Corbett Research RotorGene utilizing SYBR Green fluores-
cence. Reactions were carried out in 15 µl using SYBR Green
PCR master mix according to the manufacturer's protocol
(Qiagen) with 2.4 µl DNA. Cycling was for 15 min at 95°C, fol-
lowed by 40 cycles of 94°C, 60 sec; 60°C, 30 sec and 72°C, 60
sec. The primer pairs to amplify heat-shock element and 3'
ends of the genes for heat-shock proteins 26 (3' UTR) and 70
(5' HSE and 3' UTR) were as described in Andrulis et al. [25]
except the primer pair (5'-GCTGTTTCTTTTGCGCTCTT and
5'-TTGTTTGACTTGTAAGCAAAGGTT) for the heat-shock
element of heat-shock protein 26 (5' HSE). Serial dilutions of
genomic DNA (100-0.3125 pg/µl) were used to produce a
calibration curve. A no-template control was also used. All
samples, controls and standards were performed in triplicate.
Standard PCR
Positives from the cDNA microarray were validated in stand-
ard PCR assays as follows: To 3 µl of immunopurified DNA, 1
µl of 100 pmol/µl primers, 1.5 µl 10x buffer IV (Abgene), 1.5
µl 10 mM dNTPs, 1.2 µl 25 mM MgCl
2
, 1 µl Thermo-Start Taq
DNA polymerase (Abgene, 5 units/µl) and H
2
O to 15 µl were
added. PCR reactions were carried out for 5 min at 95°C, 35
cycles of 1 min at 95°C, 1 min at 57°C and 1 min at 72°C, fol-
lowed by 10 min at 72°C. The primers used are listed in Table
4.
Sample labeling
Concentrations of anti-Hsf and preimmune IP DNA samples
were determined using a NanoDrop spectrophotometer
(Nanodrop Technologies). Fifty nanograms of each IP sample
was incubated with 1 unit T4 DNA polymerase (Promega) in a
total volume of 50 µl manufacturer's buffer for 5 min at 37°C.
The reaction was stopped by adding 2 µl of 0.5 M EDTA and
the DNA purified with MinElute PCR purification columns
(Qiagen). Ten nanograms of purified DNA was combined
with 1 µM of annealed linkers (Linker 1,
5'AGAAGCTTGAATTCGAGCAGTCAG3': Linker 2,
5'CTGCTCGAATTCAAGCTTCT 3') and incubated overnight
at 4°C with 1 unit of DNA ligase (Invitrogen) in standard
ligase buffer.
PCR amplification was carried out directly without further
DNA purification in a reaction volume of 100 µl containing
0.2 mM dNTPs, 15 mM MgCl
2
, 5 U Thermo-Start DNA
polymerase (Abgene) and 100 pg of linker 2 using the follow-
ing conditions: 1 cycle of 55°C 2 min, 72°C 5 min, 94°C 5 min;
R63.14 Genome Biology 2005, Volume 6, Issue 7, Article R63 Birch-Machin et al. />Genome Biology 2005, 6:R63
24 cycles of 94°C 1 min, 55°C 1 min, 72°C 1 min; 1 cycle of 72°C
5 min, 4°C hold. PCR products were purified with MinElute
columns (Qiagen).
Labeling
Purified PCR products were labeled with a Bioprime random
priming labeling system with 0.1 mM each dATP, dGTP and
dTTP, 0.04 mM dCTP and 0.06 mM Cy3 or Cy5-conjugated
dCTP (Amersham Biosciences) at 37°C for 2 h. 5% of the reac-
tion was checked by agarose gel electrophoresis for an
expected smear of product from 200-600 bp and the remain-
der purified with Sephadex G50 minicolumns.
Tiling path microarrays
A total of 3,091 fragments of 1 kb average length were ampli-
fied with primers designed across the Adh region by PCR
(coordinates chr2L:13488459-16409825; these primers were
generously donated by P. Spellman and G. Rubin, University
of California at Berkeley). All sequence coordinates are from
release 3.1 of the Drosophila genome sequence [52]. The
primer design was generated against release 1 of the genome
sequence and we have remapped the fragments onto release
3.1 of the sequence using the UCSC genome browser [53,54].
In addition we synthesized three sets of primers to amplify
the following loci. The first was a set of 1-kb and 2-kb overlap-
ping fragments covering several Hsp gene loci: Hsp70A
(chr3R:7,776,000-7,830,000), Hsp83 (chr3L:3,170,043-
3,180,013), Hsp67Ba-Hsp27 (chr3L:9,326,084-9,348,399),
Hsp68 (chr3R:19,868,471-19,878,621) and Hsp60
(chrX:10,847,030-10,857,109). The second was a set of 1-kb
fragments covering a set of segmentation genes: Eve
(chr2R:5,035,032-5,051,166), Dichaete (chr3L:14,096,994-
14,125,069), Hairy (chr3L:8,619,968-8,637,146) and Runt
(chrX:20,349,976-20,380,172). The third was a set of 81 1-kb
fragments corresponding to regions previously identified by
ChIP with an anti-Ubx antibody [2]. All primer sequences are
given in Additional data file 4.
All PCR amplifications were performed in 96-well plate for-
mat and each product was assayed by agarose gel electro-
phoresis. In total, 3,444 fragments were amplified and
spotted, along with 480 samples of sonicated Drosophila
genomic DNA (250 ng/µl), onto FMB-cDNA glass microarray
slides with a Biorobotics Microgrid II arrayer. cDNA arrays
were constructed from PCR amplified inserts from the Dro-
sophila Gene Collection V.1 [36] and are described at the Fly-
Chip website [55].
Slides were treated as described on the FlyChip website [55].
Slide hybridization and washing was carried out with a
Genomic Solutions GenTAC hybridization station. Slides
were scanned with an Applied Precision ArrayWoRx CCD
scanner and the data processed using a custom implementa-
tion of the VSN normalization method of Huber et al. [56].
VSN performs an asinh transform with the microarray ratio
data rather than the more traditional log
2
transformation; in
most cases the two are equivalent. The CyberT framework
and website was used to assess the significance of the
microarray results [29,57]. Yeast data were obtained from Lee
et al. [27] and Hahn et al. [28] and the mammalian data from
Trinklein et al. [38].
Expression analysis comparing RNA from heat-shock treated
embryos and unshocked embryos was carried out as
described on the FlyChip website [55]. Four independent
samples were labeled and hybridized to the cDNA arrays.
Data processing, normalization and statistical analysis were
as described above for the ChIP-array studies.
Table 4
Primers used in the standard PCR analysis
Gene 5' primer 3' primer Product (bp)
CG3273 ACCTGGCGGAATATCACAGA ACCCCAATGTCGGATGTAGA 421
CG9746 GCGAAAACCAATCGATGTTA CGAAGCAAGATGACCTTTCC 403
CG10077 CGACCCAAAAACCAAAGTGT GATATCGGTTTTCGCCTTCA 444
CG11166 GGCCTGCGAGGAAAAGTTAT GTCGATCCCAACAGCTACAA 414
CG12876 TTTTTATTACTAACATGAACCGGTAA GCCGTTGGTTTCTCCACTT 408
CG33111 TACGCAGCGAATATCGATTG TTCTGCACGAGGGGTAGTCT 417
CG33144 CCCAATTGGAAATGAGTGCT GAATTTCCTAAATTTTGCAAGGA 441
dmt ACCATCCCCCGATCTCTAAG GCAGGCAGGAAAATCACAAT 404
EP2237 GAAAAAGGCAAAGCCATTCA CTCGGAAAAGATGGCAACAT 451
MBF1 CCAGATGGTTAAACGGCAAT GGCTCAAGGAGCTACTGAAAAA 405
veg AATTCTCGTTGCTCTCGAACT TGGAGTTCTTCTTGGCCACT 409
Genome Biology 2005, Volume 6, Issue 7, Article R63 Birch-Machin et al. R63.15
comment reviews reports refereed researchdeposited research interactions information
Genome Biology 2005, 6:R63
Binding site distribution
The 1 kb of sequence immediately upstream of all transcripts
of genes within Release 1 of the Drosophila Gene Collection
(DGC1) was obtained by filtering the corresponding
sequences recovered from Ensembl version 24.3b.1 (BDGP
Release 3.1) via EnsMart against a list of DGC1 genes obtained
from FlyBase. This subset was then searched for partial
matches (mismatches <2) to an Hsf consensus sequence
(GAAnnTTCnnGAA [43]) on both strands and statistics on
the total number of hits for each of the DGC1 fragments cal-
culated with custom-written BioJava-based software. The
distribution of hits against the 137 Hsf-binding genes and the
remaining non-Hsf-binding genes were then plotted against
increasing hit counts.
Data availability
Raw and processed microarray data are available from the
national Center for Biotechnology Information (NCBI) Gene
Expression Omnibus site [58] with the following series acces-
sion numbers: genome tile arrays, GSE2423; cDNA arrays,
GSE2398.
Additional data files
The following additional data are available with the online
version of this paper. Additional data file 1 contains a tab-
delimited table containing the ratios and CyberT statistics for
the genome tile array. Additional data file 2 contains a tab-
delimited file of data from the cDNA arrays. Additional data
file 3 contains compiled data for the top 188 cDNA clones.
Additional data file 4 contains sequences of the primer pairs
used to amplify each of the fragments on the genome tile
array.
Additional Data File 1Tab delimited table containing the ratios and CyberT statistics for the genome tile arrayTab delimited table containing the ratios and CyberT statistics for the genome tile array. For each fragment (Clone_ID) the VSN-nor-malized ratio (average of the dye swaps) of Hsf-enriched v control for each independent immunopurification is given. The CyberT sta-tistics are: #obs = number of measurements accepted, Mn = mean ratio, SD = standard deviation of the mean, t = t-test statistic calcu-lated using the standard deviation,p = p-value associated with the t-test.Click here for fileAdditional Data File 2Tab-delimited file of data from the cDNA arraysTab-delimited file of data from the cDNA arrays. The average ratio for each of the 7 independent immunopurifications from 3 separate chromatin preparations is given (N = number of technical repli-cates used to calculate the average). For each clone the FlyBase ID, gene symbol and BDGP clone number is given. The headers indi-cate the chromatin batch (A, B and C) and immunopurification (1-4).Click here for fileAdditional Data File 3Compiled data for the top 188 cDNA clonesCompiled data for the top 188 cDNA clones. For each gene the Fbgn and FlyBase symbol is given followed by the summarized CyberT statistics, mean ratio (Mn) and p value. The remaining data are: Custom Affymetrix array (Affy), expression ratio and p-value from cDNA arrays (cDNA and cDNA P), GAGA-factor DAM-ID experi-ment (GAGA, GAGA P), number of predicted Hsf sites in the 1kb upstream fragment, predicted cytological location from FlyBase, yeast homologue, expression and percentile ranking from Hahn et al. [28] (MaxExp, Non-HS, HS), p value and ratios from Lee et al. [27] and the blast score of Drosophila vs yeast protein matches.Click here for fileAdditional Data File 4Sequences of the primer pairs used to amplify each of the fragments on the genome tile arraySequences of the primer pairs used to amplify each of the fragments on the genome tile array. Clone_ID - identifier as in Additional data file 1, 5' and 3' - primer sequences, size - PCR amplicon size.Click here for file
Acknowledgements
We are grateful to John Lis for his help in providing reagents to initiate this
project and Paul Spellman and Gerry Rubin for the primers for the Adh
region. We thank Peggy Farnham for advice on chromatin immunopurifica-
tion and Vishy Iyer for help with the yeast data. We are indebted to Richard
Auburn and FlyChip for help with the array construction, Gos Micklem for
informatics input and to other members of the Russell and White labs for
advice and support. This work was funded by the UK Biotechnology and
Biological Sciences Research Council.
References
1. Solomon MJ, Varshavsky A: Formaldehyde-mediated DNA-pro-
tein crosslinking: a probe for in vivo chromatin structures.
Proc Natl Acad Sci USA 1985, 82:6470-6474.
2. Gould AP, Brookman JJ, Strutt DI, White RA: Targets of homeotic
gene control in Drosophila. Nature 1990, 348:308-312.
3. Orlando V, Paro R: Mapping Polycomb-repressed domains in
the bithorax complex using in vivo formaldehyde cross-
linked chromatin. Cell 1993, 75:1187-1198.
4. Orlando V, Strutt H, Paro R: Analysis of chromatin structure by
in vivo formaldehyde cross-linking. Methods 1997, 11:205-214.
5. Walter J, Biggin MD: Measurement of in vivo DNA binding by
sequence-specific transcription factors using UV cross-link-
ing. Methods 1997, 11:215-224.
6. Boyd KE, Farnham PJ: Coexamination of site-specific transcrip-
tion factor binding and promoter activity in living cells. Mol
Cell Biol 1999, 19:8393-8399.
7. Ren B, Robert F, Wyrick JJ, Aparicio O, Jennings EG, Simon I, Zeitlin-
ger J, Schreiber J, Hannett N, Kanin E, et al.: Genome-wide location
and function of DNA binding proteins. Science 2000,
290:2306-2309.
8. Iyer VR, Horak CE, Scafe CS, Botstein D, Snyder M, Brown PO:
Genomic binding sites of the yeast cell-cycle transcription
factors SBF and MBF. Nature 2001, 409:533-538.
9. Yan PS, Chen CM, Shi H, Rahmatpanah F, Wei SH, Caldwell CW,
Huang TH: Dissecting complex epigenetic alterations in
breast cancer using CpG island microarrays. Cancer Res 2001,
61:8375-8380.
10. Ren B, Cam H, Takahashi Y, Volkert T, Terragni J, Young RA,
Dynlacht BD: E2F integrates cell cycle progression with DNA
repair, replication, and G(2)/M checkpoints. Genes Dev 2002,
16:245-256.
11. Weinmann AS, Yan PS, Oberley MJ, Huang TH, Farnham PJ: Isolating
human transcription factor targets by coupling chromatin
immunoprecipitation and CpG island microarray analysis.
Genes Dev 2002, 16:235-244.
12. Horak CE, Mahajan MC, Luscombe NM, Gerstein M, Weissman SM,
Snyder M: GATA-1 binding sites mapped in the beta-globin
locus by using mammalian chIp-chip analysis. Proc Natl Acad Sci
USA 2002, 99:2924-2929.
13. Cawley S, Bekiranov S, Ng HH, Kapranov P, Sekinger EA, Kampa D,
Piccolboni A, Sementchenko V, Cheng J, Williams AJ, et al.: Unbiased
mapping of transcription factor binding sites along human
chromosomes 21 and 22 points to widespread regulation of
noncoding RNAs. Cell 2004, 116:499-509.
14. van Steensel B, Delrow J, Henikoff S: Chromatin profiling using
targeted DNA adenine methyltransferase. Nat Genet 2001,
27:304-308.
15. Sun LV, Chen L, Greil F, Negre N, Li TR, Cavalli G, Zhao H, Van
Steensel B, White KP: Protein-DNA interaction mapping using
genomic tiling path microarrays in Drosophila. Proc Natl Acad
Sci USA 2003, 100:9428-9433.
16. van Steensel B, Delrow J, Bussemaker HJ: Genomewide analysis of
Drosophila GAGA factor target genes reveals context-
dependent DNA binding. Proc Natl Acad Sci USA 2003,
100:2580-2585.
17. Bianchi-Frias D, Orian A, Delrow JJ, Vazquez J, Rosales-Nieves AE,
Parkhurst SM: Hairy transcriptional repression targets and
cofactor recruitment in Drosophila. PLoS Biol 2004, 2:E178.
18. Morimoto RI: Regulation of the heat shock transcriptional
response: cross talk between a family of heat shock factors,
molecular chaperones, and negative regulators. Genes Dev
1998, 12:3788-3796.
19. O'Brien T, Lis JT: Rapid changes in Drosophila transcription
after an instantaneous heat shock. Mol Cell Biol 1993,
13:3456-3463.
20. Wu C: Heat shock transcription factors: structure and
regulation. Annu Rev Cell Dev Biol 1995, 11:441-469.
21. Liu XD, Liu PC, Santoro N, Thiele DJ: Conservation of a stress
response: human heat shock transcription factors function-
ally substitute for yeast HSF. EMBO J 1997, 16:6466-6477.
22. Westwood JT, Clos J, Wu C: Stress-induced oligomerization
and chromosomal relocalization of heat-shock factor. Nature
1991, 353:822-827.
23. Mason PB Jr, Lis JT: Cooperative and competitive protein inter-
actions at the hsp70 promoter. J Biol Chem 1997,
272:33227-33233.
24. Shopland LS, Lis JT: HSF recruitment and loss at most Dro-
sophila heat shock loci is coordinated and depends on proxi-
mal promoter sequences. Chromosoma 1996, 105:158-171.
25. Andrulis ED, Guzman E, Doring P, Werner J, Lis JT: High-resolution
localization of Drosophila Spt5 and Spt6 at heat shock genes
in vivo: roles in promoter proximal pausing and transcription
elongation. Genes Dev 2000, 14:2635-2649.
26. Lis JT, Mason P, Peng J, Price DH, Werner J: P-TEFb kinase
recruitment and function at heat shock loci. Genes Dev 2000,
14:792-803.
27. Lee TI, Rinaldi NJ, Robert F, Odom DT, Bar-Joseph Z, Gerber GK,
Hannett NM, Harbison CT, Thompson CM, Simon I, et al.: Tran-
scriptional regulatory networks in Saccharomyces cerevisiae.
Science 2002, 298:799-804.
28. Hahn JS, Hu Z, Thiele DJ, Iyer VR: Genome-wide analysis of the
biology of stress responses through heat shock transcription
factor. Mol Cell Biol 2004, 24:5249-5256.
29. Baldi P, Long AD: A Bayesian framework for the analysis of
R63.16 Genome Biology 2005, Volume 6, Issue 7, Article R63 Birch-Machin et al. />Genome Biology 2005, 6:R63
microarray expression data: regularized t -test and statisti-
cal inferences of gene changes. Bioinformatics 2001, 17:509-519.
30. Fernandes M, Xiao H, Lis JT: Binding of heat shock factor to and
transcriptional activation of heat shock genes in Drosophila.
Nucleic Acids Res 1995, 23:4799-4804.
31. Perezgasga L, Segovia L, Zurita M: Molecular characterization of
the 5' control region and of two lethal alleles affecting the
hsp60 gene in Drosophila melanogaster. FEBS Lett 1999,
456:269-273.
32. Patriarca EJ, Maresca B: Acquired thermotolerance following
heat shock protein synthesis prevents impairment of mito-
chondrial ATPase activity at elevated temperatures in Sac-
charomyces cerevisiae. Exp Cell Res 1990, 190:57-64.
33. Ferm MT, Soderstrom K, Jindal S, Gronberg A, Ivanyi J, Young R,
Kiessling R: Induction of human hsp60 expression in mono-
cytic cell lines. Int Immunol 1992, 4:305-311.
34. Lis J: Promoter-associated pausing in promoter architecture
and postinitiation transcriptional regulation. Cold Spring Harb
Symp Quant Biol 1998, 63:347-356.
35. Bailey TL, Elkan C: Fitting a mixture model by expectation
maximization to discover motifs in biopolymers. Proc Int Conf
Intell Syst Mol Biol 1994, 2:28-36.
36. Rubin GM, Hong L, Brokstein P, Evans-Holm M, Frise E, Stapleton M,
Harvey DA: A Drosophila complementary DNA resource. Sci-
ence 2000, 287:2222-2224.
37. Leemans R, Egger B, Loop T, Kammermeier L, He H, Hartmann B,
Certa U, Hirth F, Reichert H: Quantitative transcript imaging in
normal and heat-shocked Drosophila embryos by using high-
density oligonucleotide arrays. Proc Natl Acad Sci USA 2000,
97:12138-12143.
38. Trinklein ND, Murray JI, Hartman SJ, Botstein D, Myers RM: The
role of heat shock transcription factor 1 in the genome-wide
regulation of the mammalian heat shock response. Mol Biol
Cell 2004, 15:1254-1261.
39. Boehm AK, Saunders A, Werner J, Lis JT: Transcription factor and
polymerase recruitment, modification, and movement on
dhsp70 in vivo in the minutes following heat shock. Mol Cell Biol
2003, 23:7628-7637.
40. Zou S, Meadows S, Sharp L, Jan LY, Jan YN: Genome-wide study
of aging and oxidative stress response in Drosophila
melanogaster. Proc Natl Acad Sci USA 2000, 97:13726-13731.
41. Zinke I, Schutz CS, Katzenberger JD, Bauer M, Pankratz MJ: Nutrient
control of gene expression in Drosophila : microarray analy-
sis of starvation and sugar-dependent response. EMBO J 2002,
21:6162-6173.
42. Park JM, Werner J, Kim JM, Lis JT, Kim YJ: Mediator, not holoen-
zyme, is directly recruited to the heat shock promoter by
HSF upon heat shock. Mol Cell 2001, 8:9-19.
43. Xiao H, Lis JT: Germline transformation used to define key
features of heat-shock response elements. Science 1988,
239:1139-1142.
44. Arbeitman MN, Furlong EE, Imam F, Johnson E, Null BH, Baker BS,
Krasnow MA, Scott MP, Davis RW, White KP: Gene expression
during the life cycle of Drosophila melanogaster. Science 2002,
297:2270-2275.
45. Osborne KA, Robichon A, Burgess E, Butland S, Shaw RA, Coulthard
A, Pereira HS, Greenspan RJ, Sokolowski MB: Natural behavior
polymorphism due to a cGMP-dependent protein kinase of
Drosophila. Science 1997, 277:834-836.
46. Matuschewski K, Hauser HP, Treier M, Jentsch S: Identification of
a novel family of ubiquitin-conjugating enzymes with distinct
amino-terminal extensions. J Biol Chem 1996, 271:2789-2794.
47. Takemaru K, Li FQ, Ueda H, Hirose S: Multiprotein bridging fac-
tor 1 (MBF1) is an evolutionarily conserved transcriptional
coactivator that connects a regulatory factor and TATA ele-
ment-binding protein. Proc Natl Acad Sci USA 1997, 94:7251-7256.
48. Brendel C, Gelman L, Auwerx J: Multiprotein bridging factor-1
(MBF-1) is a cofactor for nuclear receptors that regulate
lipid metabolism. Mol Endocrinol 2002, 16:1367-1377.
49. Takemaru K, Harashima S, Ueda H, Hirose S: Yeast coactivator
MBF1 mediates GCN4-dependent transcriptional activation.
Mol Cell Biol 1998, 18:4971-4976.
50. Jindra M, Gaziova I, Uhlirova M, Okabe M, Hiromi Y, Hirose S: Coac-
tivator MBF1 preserves the redox-dependent AP-1 activity
during oxidative stress in Drosophila. Embo J 2004,
23:3538-3547.
51. Oberley MJ, Tsao J, Yau P, Farnham PJ: High-throughput screen-
ing of chromatin immunoprecipitates using CpG-island
microarrays. Methods Enzymol 2004, 376:315-334.
52. Celniker SE, Wheeler DA, Kronmiller B, Carlson JW, Halpern A,
Patel S, Adams M, Champe M, Dugan SP, Frise E, et al.: Finishing a
whole-genome shotgun: release 3 of the Drosophila mela-
nogaster euchromatic genome sequence. Genome Biol 2002,
3:research0079.
53. Kent WJ, Sugnet CW, Furey TS, Roskin KM, Pringle TH, Zahler AM,
Haussler D: The human genome browser at UCSC. Genome Res
2002, 12:996-1006.
54. UCSC Genome Browser []
55. FlyChip Cambridge Microarray Facility [
chip.org.uk]
56. Huber W, von Heydebreck A, Sultmann H, Poustka A, Vingron M:
Variance stabilization applied to microarray data calibration
and to the quantification of differential expression. Bioinfor-
matics 2002, 18(Suppl 1):S96-S104.
57. CyberT microarray statistical analysis [ />genex/cybert]
58. NCBI Gene Expression Omnibus [ />geo]