Báo cáo y học: "Correction: A DNA microarray survey of gene expression in normal human tissues" pdf
Bạn đang xem bản rút gọn của tài liệu. Xem và tải ngay bản đầy đủ của tài liệu tại đây (499.19 KB, 2 trang )
Genome Biology 2005, 6:404
Correction
Correction: A DNA microarray survey of gene expression in
normal human tissues
Radha Shyamsundar*
†
, Young H Kim*, John P Higgins*, Kelli
Montgomery*, Michelle Jorden*, Anand Sethuraman
‡
, Matt van de Rijn*
†
,
David Botstein
‡¶
, Patrick O Brown
†§
and Jonathan R Pollack*
Addresses: *Department of Pathology, Stanford University, Stanford, CA 94305, USA.
†
Department of Biochemistry, Stanford University,
Stanford, CA 94305, USA.
‡
Department of Genetics, Stanford University, Stanford, CA 94305, USA.
§
Howard Hughes Medical Institute,
Stanford University, Stanford, CA 94305, USA.
¶
Current address: Lewis-Sigler Institute for Integrative Genomics, Princeton University,
Princeton, NJ 80544, USA.
Correspondence: Patrick O Brown. Email: Jonathan R Pollack. Email:
Published: 19 August 2005
Genome Biology 2005, 6:404 (doi:10.1186/gb-2005-6-9-404)
The electronic version of this article is the complete one and can be
found online at />© 2005 BioMed Central Ltd
Received: 22 July 2005
Accepted: 29 July 2005
We wish to report two corrections to our study [1], neither
of which alters the interpretation of the data or the conclu-
sions drawn. First, we have discovered that the data file
from a microarray hybridization (prostate RNA versus
normal genomic DNA) used to derive the plot in Figure 4a
became corrupted during data processing. The corrected
plot (Figure 4a) displays a stronger correlation between
directly and indirectly estimated transcript levels, indicat-
ing even better performance of our method of estimating
transcript abundance. The corrected data file has been
deposited to the Stanford Microarray Database (SMD) and
Gene Expression Omnibus (GEO) repositories. Second, we
have identified a ‘frame-shift’ in the Additional data file 2
(Sheet 5) data set; the corrected data file has been deposited
to the supplemental site.
Additional data files
Additional data file 2 contains a corrected list of the variably
expressed genes.
References
1. Shyamsundar R, Kim YH, Higgins JP, Montgomery K, Jorden M,
Sethuraman A, van de Rijn M, Botstein D, Brown PO, Pollack JR: A
DNA microarray survey of gene expression in normal
human tissues. Genome Biol 2005, 6:R22.
comment
reviews reports
deposited research
interactions
information
refereed research
(See the corrected figure on the next page)
404.2 Genome Biology 2005, Volume 6, Issue 9, Article 404 Shyamsundar et al. />Genome Biology 2005, 6:404
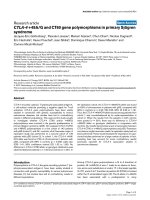
Figure 4
Estimating relative transcript abundance. (a) Comparison of transcript levels estimated either directly by hybridization of prostate sample mRNA versus
normal female genomic DNA, or indirectly by multiplying the ratio of prostate sample mRNA versus common reference mRNA by the ratio of common
reference mRNA versus normal female genomic DNA. The correlation value (R) is indicated. (b) Prostate-specific gene expression cluster, extracted
from the hierarchical cluster shown in Figure 1a, displayed as mean-centered relative gene expression (ratio-fold change scale indicated). (c) The same
gene expression feature as in (b), now displayed as transcript abundance (relative to the average transcript level for all expressed genes), calculated
indirectly using the common reference mRNA versus normal female genomic DNA hybridization data.
Esophagus 0022
Esophagus 0406
Esophagus 0331
Placenta 2876
Vagina 0304
Cervix 2209
Cervix 2385
Lung 1356
Lung 0221
Lung 1351
Lung 0330
Ovary 0408
Fallopian tube 065B
Fallopian tube 065A
Fallopian tube 2184
Fallopian tube 2386
Ovary 0466
Ovary 0314
Ovary 0538
Ovary 1080
Cervix, endo cervical canal 1200
Uterine corpus, myometriun 1205
Uterus, endomyometrium 0002
Uterus, endomyometrium 0126
Uterus, endomyometrium 0158
Uterus, endomyometrium 002B
Small bowel, duodenum 0825
Bladder 1678
Bladder 1004
Seminal vesicle 0233
Seminal vesicle 0234
Seminal vesicle 0235
Prostate 1277
Prostate 0845
Prostate 0805
Prostate 0782
Prostate 1045
Breast, lactating 0162
Salivary gland, parotid 0506
Salivary gland, parotid 0493
Salivary gland, parotid 0396
Salivary gland, parotid 1762
Epididymus 2125
Parathyroid 2995
Parathyroid 1748
Parathyroid 0499
Thyroid 0838
Thyroid 1193
Thyroid 3077
Thyroid 0182
Thyroid 0029
Testes 1853
Testes 1068
Testes 0553
Brain, temporal cortex 2272
Brain, occipital cortex 2271
Brain, frontal cortex 2271
Brain, frontal cortex 2272
Brain, occipital cortex 2273
Brain, occipital cortex 2272
Brain, temporal cortex 2273
Brain, frontal cortex 2273
Adrenal 0433
Adrenal 1111
Adrenal 1354
Thyroid 0555
Adrenal 0558
Heart 0559
Pericardium 0465
Muscle, abdominal 0031
Diaphragm 0366
Muscle, right calf 0315
Heart 0980
Heart 0477
Heart 2869
Heart 0841
Heart 0024
Gallbladder 2131
Stomach, fundus 0878
Colon, ascending 0222
Stomach, body 0468
Stomach, body 0328
Stomach, pylorus 2173
Small bowel, ileum 0359
Small bowel, duodenum 2174
Colon, sigmoid 0361
Colon 2075
Kidney 0265
Kidney 1651
Kidney 1594
Kidney 0226
Kidney 0088
Liver 0560
Liver 1274
Liver 1267
Liver 0032
Liver 0586
Pancreas 2650
Pancreas 0432
Thymus 0512
Tonsil 1398
Lymph node 1337
Lymph node 0599
Lymph node, axillary 0936
Lymph node, axillary 1187
Tonsil 1428
Tonsil 3011
Tonsil 2852
Thymus 0035
Buffycoat 3643
Buffycoat 3642
Spleen 0405
Spleen 0089
Spleen 0125
Lymph node 2096
(a)
(b)
2
4
>8
0.5
0.25
< 0.125
1
(c)
TTRAP
ABCC4
NKX3-1
AA229499
PAK1IP1
TRIP8
AA425692
AMD1
AI078552
AMD1
AA229573
RDH11
RDH11
STEAP2
KIAA1411
AA772497
FLJ13409
PRIM2A
MSH2
ACLY
TTRAP
ABCC4
NKX3-1
AA229499
PAK1IP1
TRIP8
AA425692
AMD1
AI078552
AMD1
AA229573
RDH11
RDH11
STEAP2
KIAA1411
AA772497
FLJ13409
PRIM2A
MSH2
ACLY
-20
-15
-10
-5
0
5
10
15
-15 -10 -5 0 5 10 15
Prostate mRNA vs Genomic DNA
Calculated Prostate mRNA vs Genomic DNA
R = 0.93